Paper Menu >>
Journal Menu >>
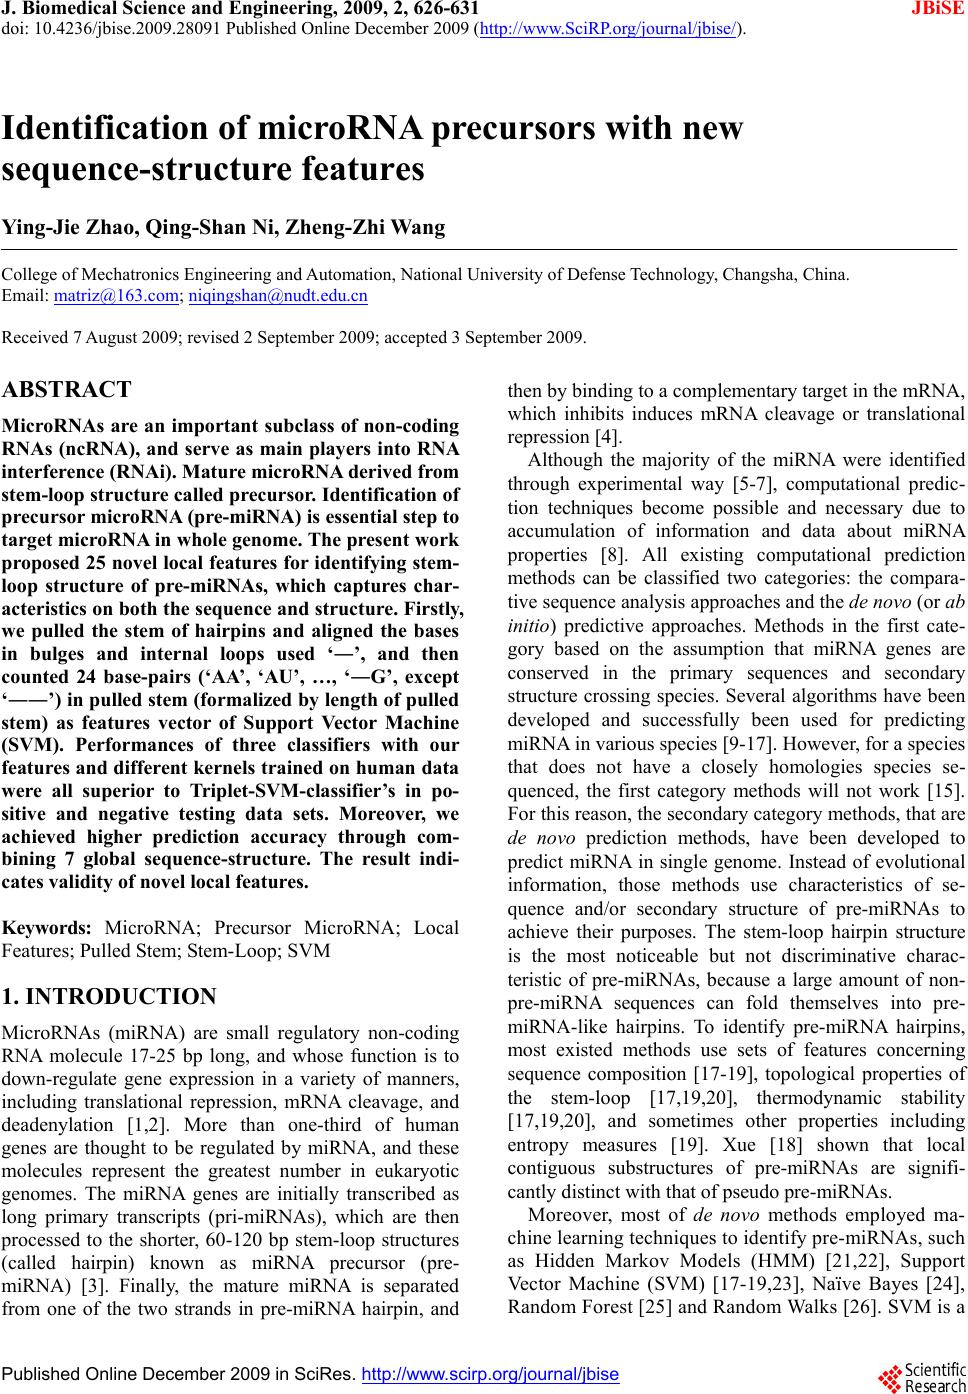 J. Biomedical Science and Engineering, 2009, 2, 626-631 JBiSE doi: 10.4236/jbise.2009.28091 Published Online December 2009 (http://www.SciRP.org/journal/jbise/ ). Published Online December 2009 in SciRes. http://www.scirp.org/journal/jbise Identification of microRNA precursors with new sequence-structure features Ying-Jie Zhao, Qing-Shan Ni, Zheng-Zhi Wang College of Mechatronics Engineering and Automation, National University of Defense Technology, Changsha, China. Email: matriz@163.com; niqingshan@nudt.edu.cn Received 7 August 2009; revised 2 September 2009; accepted 3 September 2009. ABSTRACT MicroRNAs are an important subclass of non-coding RNAs (ncRNA), and serve as main players into RNA interference (RNAi). Mature microRNA derived from stem-loop structure called precursor. Identification of precursor microRNA (pre-miRNA) is essential step to target microRNA in whole genome. The present work proposed 25 novel local features for identifying stem- loop structure of pre-miRNAs, which captures char- acteristics on both the sequence and structure. Firstly, we pulled the stem of hairpins and aligned the bases in bulges and internal loops used ‘―’, and then counted 24 base-pairs (‘AA’, ‘AU’, …, ‘―G’, except ‘――’) in pulled stem (formalized by length of pulled stem) as features vector of Support Vector Machine (SVM). Performances of three classifiers with our features and different kernels trained on human data were all superior to Triplet-SVM-classifier’s in po- sitive and negative testing data sets. Moreover, we achieved higher prediction accuracy through com- bining 7 global sequence-structure. The result indi- cates validity of novel local features. Keywords: MicroRNA; Precursor MicroRNA; Local Features; Pulled Stem; Stem-Loop; SVM 1. INTRODUCTION MicroRNAs (miRNA) are small regulatory non-coding RNA molecule 17-25 bp long, and whose function is to down-regulate gene expression in a variety of manners, including translational repression, mRNA cleavage, and deadenylation [1,2]. More than one-third of human genes are thought to be regulated by miRNA, and these molecules represent the greatest number in eukaryotic genomes. The miRNA genes are initially transcribed as long primary transcripts (pri-miRNAs), which are then processed to the shorter, 60-120 bp stem-loop structures (called hairpin) known as miRNA precursor (pre- miRNA) [3]. Finally, the mature miRNA is separated from one of the two strands in pre-miRNA hairpin, and then by binding to a complementary target in the mRNA, which inhibits induces mRNA cleavage or translational repression [4]. Although the majority of the miRNA were identified through experimental way [5-7], computational predic- tion techniques become possible and necessary due to accumulation of information and data about miRNA properties [8]. All existing computational prediction methods can be classified two categories: the compara- tive sequence analysis approaches and the de novo (or ab initio) predictive approaches. Methods in the first cate- gory based on the assumption that miRNA genes are conserved in the primary sequences and secondary structure crossing species. Several algorithms have been developed and successfully been used for predicting miRNA in various species [9-17]. However, for a species that does not have a closely homologies species se- quenced, the first category methods will not work [15]. For this reason, the secondary category methods, that are de novo prediction methods, have been developed to predict miRNA in single genome. Instead of evolutional information, those methods use characteristics of se- quence and/or secondary structure of pre-miRNAs to achieve their purposes. The stem-loop hairpin structure is the most noticeable but not discriminative charac- teristic of pre-miRNAs, because a large amount of non- pre-miRNA sequences can fold themselves into pre- miRNA-like hairpins. To identify pre-miRNA hairpins, most existed methods use sets of features concerning sequence composition [17-19], topological properties of the stem-loop [17,19,20], thermodynamic stability [17,19,20], and sometimes other properties including entropy measures [19]. Xue [18] shown that local contiguous substructures of pre-miRNAs are signifi- cantly distinct with that of pseudo pre-miRNAs. Moreover, most of de novo methods employed ma- chine learning techniques to identify pre-miRNAs, such as Hidden Markov Models (HMM) [21,22], Support Vector Machine (SVM) [17-19,23], Naïve Bayes [24], Random Forest [25] and Random Walks [26]. SVM is a 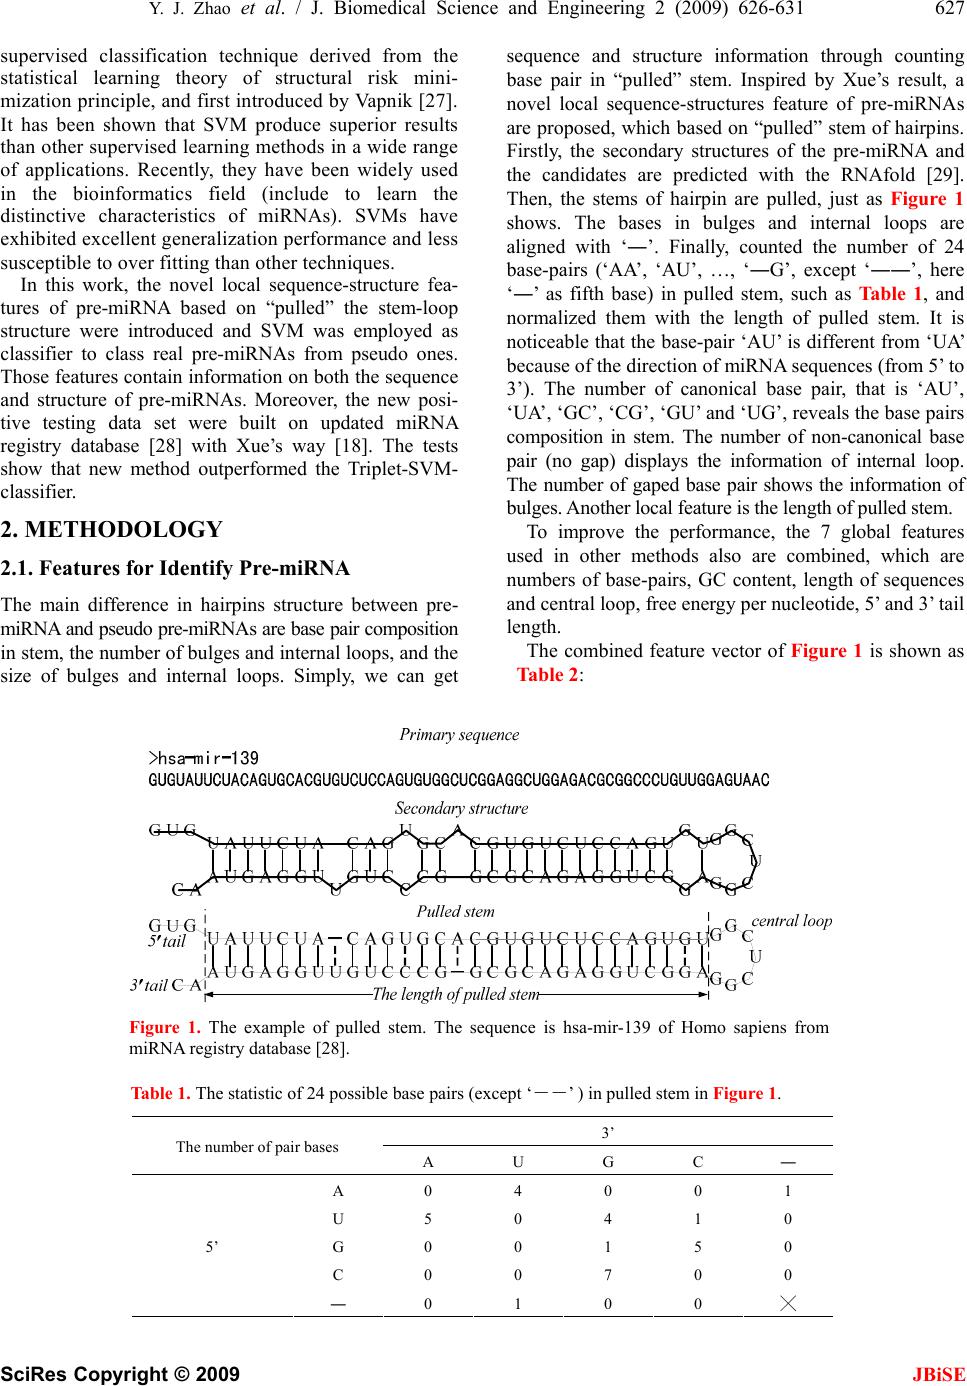 Y. J. Zhao et al. / J. Biomedical Science and Engineering 2 (2009) 626-631 627 SciRes Copyright © 2009 JBiSE supervised classification technique derived from the statistical learning theory of structural risk mini- mization principle, and first introduced by Vapnik [27]. It has been shown that SVM produce superior results than other supervised learning methods in a wide range of applications. Recently, they have been widely used in the bioinformatics field (include to learn the distinctive characteristics of miRNAs). SVMs have exhibited excellent generalization performance and less susceptible to over fitting than other techniques. In this work, the novel local sequence-structure fea- tures of pre-miRNA based on “pulled” the stem-loop structure were introduced and SVM was employed as classifier to class real pre-miRNAs from pseudo ones. Those features contain information on both the sequence and structure of pre-miRNAs. Moreover, the new posi- tive testing data set were built on updated miRNA registry database [28] with Xue’s way [18]. The tests show that new method outperformed the Triplet-SVM- classifier. 2. METHODOLOGY 2.1. Features for Identify Pre-miRNA The main difference in hairpins structure between pre- miRNA and pseudo pre-miRNAs are base pair composition in stem, the number of bulges and internal loops, and the size of bulges and internal loops. Simply, we can get sequence and structure information through counting base pair in “pulled” stem. Inspired by Xue’s result, a novel local sequence-structures feature of pre-miRNAs are proposed, which based on “pulled” stem of hairpins. Firstly, the secondary structures of the pre-miRNA and the candidates are predicted with the RNAfold [29]. Then, the stems of hairpin are pulled, just as Figure 1 shows. The bases in bulges and internal loops are aligned with ‘―’. Finally, counted the number of 24 base-pairs (‘AA’, ‘AU’, …, ‘―G’, except ‘――’, here ‘―’ as fifth base) in pulled stem, such as Table 1, and normalized them with the length of pulled stem. It is noticeable that the base-pair ‘AU’ is different from ‘UA’ because of the direction of miRNA sequences (from 5’ to 3’). The number of canonical base pair, that is ‘AU’, ‘UA’, ‘GC’, ‘CG ’, ‘GU’ and ‘UG’, reveals the base pairs composition in stem. The number of non-canonical base pair (no gap) displays the information of internal loop. The number of gaped base pair shows the information of bulges. Another local feature is the length of pulled stem. To improve the performance, the 7 global features used in other methods also are combined, which are numbers of base-pairs, GC content, length of sequences and central loop, free energy per nucleotide, 5’ and 3’ tail length. The combined feature vector of Figure 1 is shown as Table 2: Figure 1. The example of pulled stem. The sequence is hsa-mir-139 of Homo sapiens from miRNA registry database [28]. Table 1. The statistic of 24 possible base pairs (except ‘――’ ) in pulled stem in Figure 1. 3’ The number of pair bases A U G C ― A 0 4 0 0 1 U 5 0 4 1 0 G 0 0 1 5 0 C 0 0 7 0 0 5’ ― 0 1 0 0 ╳ 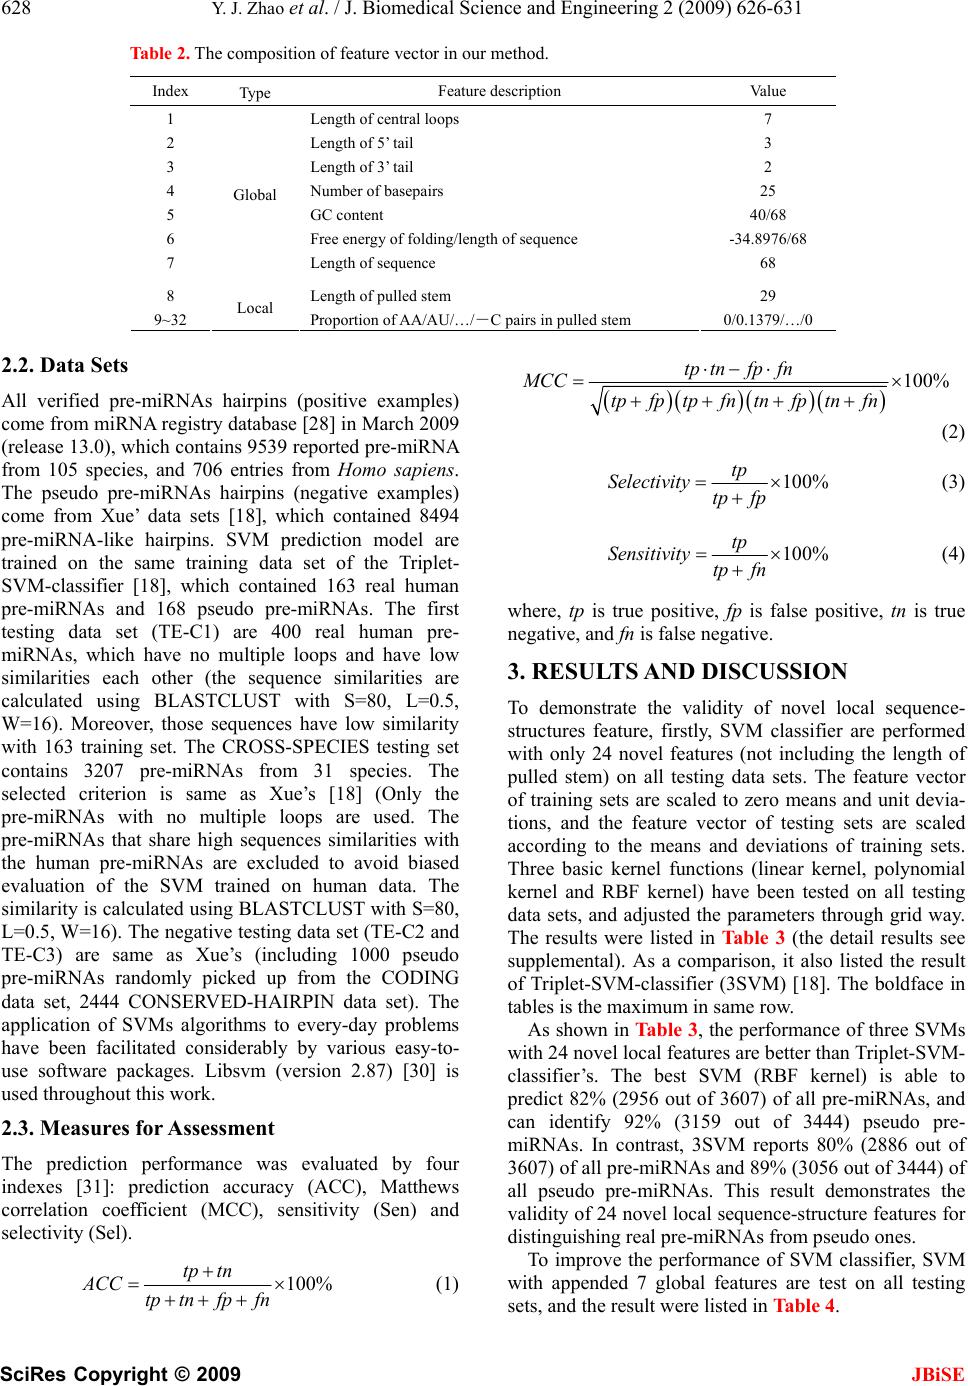 628 Y. J. Zhao et al. / J. Biomedical Science and Engineering 2 (2009) 626-631 SciRes Copyright © 2009 JBiSE Table 2. The composition of feature vector in our method. Index Type Feature description Value 1 Length of central loops 7 2 Length of 5’ tail 3 3 Length of 3’ tail 2 4 Number of basepairs 25 5 GC content 40/68 6 Free energy of folding/length of sequence -34.8976/68 7 Global Length of sequence 68 8 Length of pulled stem 29 9~32 Local Proportion of AA/AU/…/―C pairs in pulled stem 0/0.1379/…/0 2.2. Data Sets All verified pre-miRNAs hairpins (positive examples) come from miRNA registry database [28] in March 2009 (release 13.0), which contains 9539 reported pre-miRNA from 105 species, and 706 entries from Homo sapiens. The pseudo pre-miRNAs hairpins (negative examples) come from Xue’ data sets [18], which contained 8494 pre-miRNA-like hairpins. SVM prediction model are trained on the same training data set of the Triplet- SVM-classifier [18], which contained 163 real human pre-miRNAs and 168 pseudo pre-miRNAs. The first testing data set (TE-C1) are 400 real human pre- miRNAs, which have no multiple loops and have low similarities each other (the sequence similarities are calculated using BLASTCLUST with S=80, L=0.5, W=16). Moreover, those sequences have low similarity with 163 training set. The CROSS-SPECIES testing set contains 3207 pre-miRNAs from 31 species. The selected criterion is same as Xue’s [18] (Only the pre-miRNAs with no multiple loops are used. The pre-miRNAs that share high sequences similarities with the human pre-miRNAs are excluded to avoid biased evaluation of the SVM trained on human data. The similarity is calculated using BLASTCLUST with S=80, L=0.5, W=16). The negative testing data set (TE-C2 and TE-C3) are same as Xue’s (including 1000 pseudo pre-miRNAs randomly picked up from the CODING data set, 2444 CONSERVED-HAIRPIN data set). The application of SVMs algorithms to every-day problems have been facilitated considerably by various easy-to- use software packages. Libsvm (version 2.87) [30] is used throughout this work. 2.3. Measures for Assessment The prediction performance was evaluated by four indexes [31]: prediction accuracy (ACC), Matthews correlation coefficient (MCC), sensitivity (Sen) and selectivity (Sel). 100% tptn ACC tptnfpfn + =× +++ (1) ()( )( )( ) 100% tptnfpfn MCC tpfptpfntnfptnfn ⋅−⋅ =× ++++ (2) 100% tp Selectivity tpfp =× + (3) 100% tp Sensitivity tpfn =× + (4) where, tp is true positive, fp is false positive, tn is true negative, and fn is false negative. 3. RESULTS AND DISCUSSION To demonstrate the validity of novel local sequence- structures feature, firstly, SVM classifier are performed with only 24 novel features (not including the length of pulled stem) on all testing data sets. The feature vector of training sets are scaled to zero means and unit devia- tions, and the feature vector of testing sets are scaled according to the means and deviations of training sets. Three basic kernel functions (linear kernel, polynomial kernel and RBF kernel) have been tested on all testing data sets, and adjusted the parameters through grid way. The results were listed in Table 3 (the detail results see supplemental). As a comparison, it also listed the result of Triplet-SVM-classifier (3SVM) [18]. The boldface in tables is the maximum in same row. As shown in Table 3, the performance of three SVMs with 24 novel local features are better than Triplet-SVM- classifier’s. The best SVM (RBF kernel) is able to predict 82% (2956 out of 3607) of all pre-miRNAs, and can identify 92% (3159 out of 3444) pseudo pre- miRNAs. In contrast, 3SVM reports 80% (2886 out of 3607) of all pre-miRNAs and 89% (3056 out of 3444) of all pseudo pre-miRNAs. This result demonstrates the validity of 24 novel local sequence-structure features for distinguishing real pre-miRNAs from pseudo ones. To improve the performance of SVM classifier, SVM with appended 7 global features are test on all testing sets, and the result were listed in Table 4. 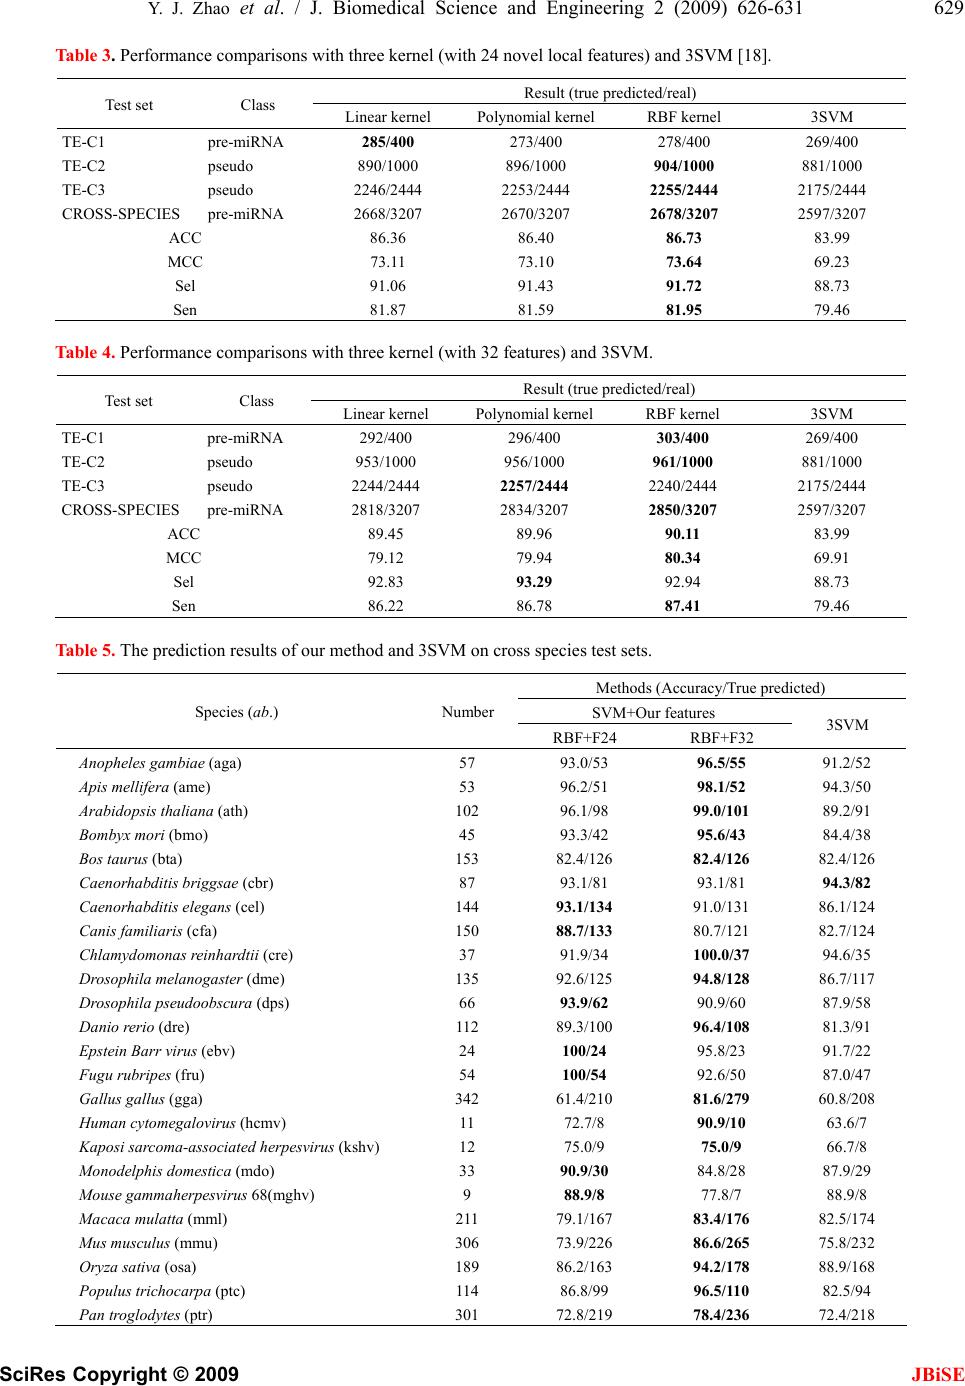 Y. J. Zhao et al. / J. Biomedical Science and Engineering 2 (2009) 626-631 629 SciRes Copyright © 2009 JBiSE Table 3. Performance comparisons with three kernel (with 24 novel local features) and 3SVM [18]. Result (true predicted/real) Test set Class Linear kernel Polynomial kernel RBF kernel 3SVM TE-C1 pre-miRNA 285/400 273/400 278/400 269/400 TE-C2 pseudo 890/1000 896/1000 904/1000 881/1000 TE-C3 pseudo 2246/2444 2253/2444 2255/2444 2175/2444 CROSS-SPECIES pre-miRNA 2668/3207 2670/3207 2678/3207 2597/3207 ACC 86.36 86.40 86.73 83.99 MCC 73.11 73.10 73.64 69.23 Sel 91.06 91.43 91.72 88.73 Sen 81.87 81.59 81.95 79.46 Table 4. Performance comparisons with three kernel (with 32 features) and 3SVM. Result (true predicted/real) Test set Class Linear kernel Polynomial kernel RBF kernel 3SVM TE-C1 pre-miRNA 292/400 296/400 303/400 269/400 TE-C2 pseudo 953/1000 956/1000 961/1000 881/1000 TE-C3 pseudo 2244/2444 2257/2444 2240/2444 2175/2444 CROSS-SPECIES pre-miRNA 2818/3207 2834/3207 2850/3207 2597/3207 ACC 89.45 89.96 90.11 83.99 MCC 79.12 79.94 80.34 69.91 Sel 92.83 93.29 92.94 88.73 Sen 86.22 86.78 87.41 79.46 Table 5. The prediction results of our method and 3SVM on cross species test sets. Methods (Accuracy/True predicted) SVM+Our features Species (ab.) Number RBF+F24 RBF+F32 3SVM Anopheles gambiae (aga) 57 93.0/53 96.5/55 91.2/52 Apis mellifera (ame) 53 96.2/51 98.1/52 94.3/50 Arabidopsis thaliana (ath) 102 96.1/98 99.0/101 89.2/91 Bombyx mori (bmo) 45 93.3/42 95.6/43 84.4/38 Bos taurus (bta) 153 82.4/126 82.4/126 82.4/126 Caenorhabditis briggsae (cbr) 87 93.1/81 93.1/81 94.3/82 Caenorhabditis elegans (cel) 144 93.1/134 91.0/131 86.1/124 Canis familiaris (cfa) 150 88.7/133 80.7/121 82.7/124 Chlamydomonas reinhardtii (cre) 37 91.9/34 100.0/37 94.6/35 Drosophila melanogaster (dme) 135 92.6/125 94.8/128 86.7/117 Drosophila pseudoobscura (dps) 66 93.9/62 90.9/60 87.9/58 Danio rerio (dre) 112 89.3/100 96.4/108 81.3/91 Epstein Barr virus (ebv) 24 100/24 95.8/23 91.7/22 Fugu rubripes (fru) 54 100/54 92.6/50 87.0/47 Gallus gallus (gga) 342 61.4/210 81.6/279 60.8/208 Human cytomegalovirus (hcmv) 11 72.7/8 90.9/10 63.6/7 Kaposi sarcoma-associated herpesvirus (kshv) 12 75.0/9 75.0/9 66.7/8 Monodelphis domestica (mdo) 33 90.9/30 84.8/28 87.9/29 Mouse gammaherpesvirus 68(mghv) 9 88.9/8 77.8/7 88.9/8 Macaca mulatta (mml) 211 79.1/167 83.4/176 82.5/174 Mus musculus (mmu) 306 73.9/226 86.6/265 75.8/232 Oryza sativa (osa) 189 86.2/163 94.2/178 88.9/168 Populus trichocarpa (ptc) 114 86.8/99 96.5/110 82.5/94 Pan troglodytes (ptr) 301 72.8/219 78.4/236 72.4/218  630 Y. J. Zhao et al. / J. Biomedical Science and Engineering 2 (2009) 626-631 SciRes Copyright © 2009 JBiSE Rattus norvegicus (rno) 126 95.2/120 94.4/119 88.1/111 Schmidtea mediterranea (sme) 63 92.1/58 95.2/60 77.8/49 Triticum aestivum (tae) 16 93.8/15 93.8/15 93.8/15 Tetraodon nigroviridis (tni) 55 96.4/53 90.9/50 87.3/48 Vitis vinifera (vvi) 77 88.3/68 96.1/74 88.3/68 Xenopus tropicalis (xtr) 68 95.6/65 94.1/64 91.2/62 Zea mays (zma) 55 78.2/43 98.2/54 83.6/46 Total 3207 83.5/2678 88.9/2850 81.1/2597 We can see from Table 4 that the performance of SVM classifier significantly increased by combining the 7 global features with 25 new local features (including the length of pulled stem). The ACC and MCC of the best SVM with 32 combined features are 90.11% and 80.34%, respectively. It indicated that the global features are important to identify real pre-miRNAs from pseudo ones. Table 5 shows the SVM prediction on the CROSS- PECIES data sets, which contains 3207 known pre- iRNAs of 31 species. The SVM with new 24 local features and 32 combined features achieve overall accuracy of 83.5% and 88.9% on the CROSS-SPECIES data sets, respectively. The new 24 local features have better performance than Xue’s local features in almost 31 species, especially for Epstein Barr virus (ebv) and Fugu rubripes (fru), our accuracy achieve 100% on those species, but Xue’s accuracy is 91.7% and 87%, respectively. 4. CONCLUSIONS In this paper, a novel local features different from Xue’s [18] have been present for identifying real pre-miRNAs from pseudo ones. These features come from simply statistical on pulled stem of hairpin structure, and achieve higher accuracy than Triplet-SVM-classifier on updating testing data sets with SVM classifier. The results indicate that our method could be used as an alternative way for finding pre-miRNAs. REFERENCES [1] V. Ambros. (2004) The functions of animal microRNAs, Nature, 431, 350–355. [2] D. P. Bartel. (2004) MicroRNAs: Genomics, biogenesis, mechanism, and function, Cell, 116, 281–297. [3] E. Lund, S. Guttinger, A. Calado, J. E. Dahlberg and U. Kutay. (2004) Nuclear export of microRNA precursors, Science, 303, 95–98. [4] L. He and G. Hannon. (2004) MicroRNAs: Small RNAs with a big role in gene regulation, Nat Rev Genet, 5, 522–531. [5] M. Lagos-Quintana, R. Rauhut, W. Lendeckel and T. Tuschl. (2001) Identification of novel genes coding for small expressed RNAs, Science, 294, 853–858. [6] N. C. Lau, L. P. Lim, E. G. Weinstein and D. P. Bartel. (2001) An abundant class of tiny RNAs with probable regulatory roles in Caenorhabditis elegans, Science, 294, 858–862. [7] R. C. Lee and V. Ambros. (2001) An extensive class of small RNAs in Caenorhabditis elegans, Science, 294, 862–864. [8] E. Berezikov, E. Cuppen and R. H. A. Plasterk. (2006) Approaches to microRNA discovery, Nature genetics, 38, s1–s7. [9] L. P. Lim, M. E. Glasner, S. Yekta, C. B. Burge and D. P. Bartel. (2003) Vertebrate microRNA genes, Science, 299, 1540. [10] L. P. Lim, N. C. Lau, E. G. Weinstein, A. Abdelhakim, S. Yekta, M. W. Rhoades, C. B. Burge and D. P. Bartel. (2003) The microRNAs of Caenorhabditis elegans, Genes Dev, 17, 991–1008. [11] M. W. Jones-Rhoades and D. P. Bartel. (2004) Computa- tional identification of plant microRNAs and their targets, including a stress-induced miRNA, Mol Cell, 14, 787– 799. [12] E. Bonnet, J. Wuyts, P. Rouze and Van de Peer Y. (2004) Evidence that microRNA precursors, unlike other non- coding RNAs, have lower folding free energies than random sequences, Bioinformatics, 20, 2911–2917. [13] E. C. Lai, P. Tomancak, R. W. Williams and G. M. Rubin. (2003) Computational identification of Drosophila mi- croRNA genes, Genome Biol, 4, R42. [14] A. Adai, C. Johnson, S. Mlotshwa, S. Archer-Evans and V. Manocha. (2005) Computational prediction of miRNAs in Arabidopsis thaliana, Genome Res, 15, 78–91. [15] I. Bentwich, A. Avniel, Y. Karov, R. Aharonov, S. Gilad, O. Barad, A. Barzilai, P. Einat, U. Einav, E. Meiri, E. Sharon, Y. Spector and Z. Bentwich. (2005) Identifica- tion of hundreds of conserved and nonconserved human microRNAs, Nat Genet, 37, 766–770. [16] X. Wang, J. Zhang, F. Li, J. Gu, T. He, X. Zhang and Y. Li. (2005) MicroRNA identification based on sequence and structure alignment, Bioinformatics, 21, 3610– 3614. [17] J. Hertel and P. F. Stadler. (2006) Hairpins in a haystack: recognizing microRNA precursors in comparative ge- nomics data. Bioinformatics, 22, e197–e202. [18] C. Xue, F. Li, T. He, G. P. Liu, Y. Li and X. Zhang. (2005) Classification of real and pseudo microRNA precursors using local structure-sequence features and support vec- tor machine, BMC Bioinformatics, 6, 310. [19] K. L. S. Ng and S. K. Mishra. (2007) De novo SVM classification of precursor microRNAs from genomic pseudo hairpins using global and intrinsic folding meas- ures, Bioinformatics, 23, 1321–1330. [20] T. Huang, B. Fan, M. Rothschild, Z. Hu, K. Li and S. Zhao. (2007) MiRFinder: An improved approach and  Y. J. Zhao et al. / J. Biomedical Science and Engineering 2 (2009) 626-631 631 SciRes Copyright © 2009 JBiSE software implementation for genome-wide fast mi- croRNA precursor scans, BMC Bioinformatics, 8, 341. [21] J. W. Nam, K. R. Shin, J. Han, Y. Lee, V. N. Kim and B. T. Zhang. (2005) Human microRNA prediction through a probabilistic co-learning model of sequence and structure, Nucleic Acids Res, 33, 3570–3581. [22] S. Kadri, V. Hinman and P. V. Benos. (2009) HHMMiR: efficient de novo prediction of microRNAs using hierar- chical hidden Markov models, BMC Bioinformatics, 10, S35. [23] A. Sewer, N. Paul, P. Landgraf, A. Aravin, S. Pfeffer, M. J. Brownstein, T. Tuschl, E. V. Nimwegen and M. Zavolan. (2005) Identification of clustered microRNAs using an ab initio prediction method, BMC Bioinformatics, 6, 267. [24] M. Yousef, M. Nebozhyn, H. Shatkay, S. Kanterakis, L. C. Showe and M. K. Showe. (2006) Combining multi- species genomic data for microRNA identification using a Naïve Bayes classifier, Bioinformatics, 22, 1325–1334. [25] P. Jiang, H. Wu, W. Wang, W. Ma, X. Sun and Z. Lu. (2007) MiPred: Classification of real and pseudo mi- croRNA precursors using random forest prediction model with combined features, Nucleic Acids Research, 35, 339–344. [26] Y. Xu, X. Zhou and W. Zhang. (2008) MicroRNA predic- tion with a novel ranking algorithm based on random walks, Bioinformatics, 24, 50–58. [27] V. N. Vapnik. (1995) The Nature of Statistical Learning Theory, Springer-Verlag, New York. [28] S. Griffiths-Jones. (2004) The microRNA registry, Nu- cleic Acids Res, 32, 109–111. [29] I. L. Hofacker. (2003) Vienna RNA secondary structure server, Nucleic Acids Res, 31, 3429–3431. [30] C. C. Chang and C. J. Lin. (2001) LIBSVM: A library for support vector machines. [31] P. P. Gardner and R. Giegerich. (2004) A comprehensive comparison of comparative RNA structure prediction ap- proaches, BMC Bioinformatics, 5, 140. |