Paper Menu >>
Journal Menu >>
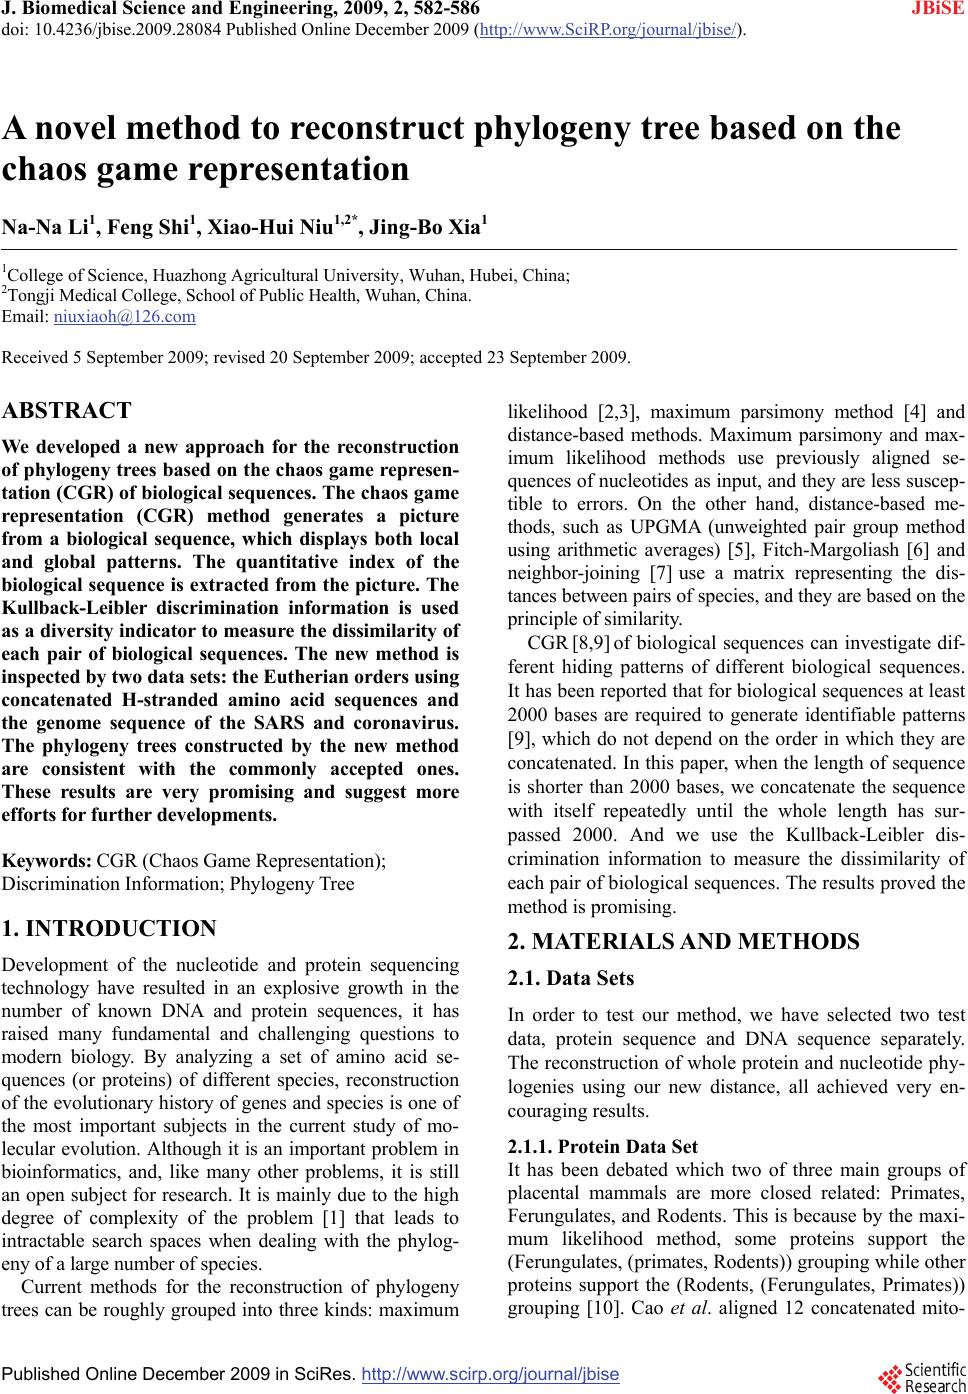 J. Biomedical Science and Engineering, 2009, 2, 582-586 doi: 10.4236/jbise.2009.28084 Published Online December 2009 (http://www.SciRP.org/journal/jbise/ JBiSE ). Published Online December 2009 in SciRes.http://www.scirp.org/journal/jbise A novel method to reconstruct phylogeny tree based on the chaos game representation Na-Na Li1, Feng Shi1, Xiao-Hui Niu1,2*, Jing-Bo Xia1 1College of Science, Huazhong Agricultural University, Wuhan, Hubei, China; 2Tongji Medical College, School of Public Health, Wuhan, China. Email: niuxiaoh@126.com Received 5 September 2009; revised 20 September 2009; accepted 23 September 2009. ABSTRACT We developed a new approach for the reconstruction of phylogeny trees based on the chaos game represen- tation (CGR) of biological sequences. The chaos game representation (CGR) method generates a picture from a biological sequence, which displays both local and global patterns. The quantitative index of the biological sequence is extracted from the picture. The Kullback-Leibler discrimination information is used as a diversity indicator to measure the dissimilarity of each pair of biological sequences. The new method is inspected by two data sets: the Eutherian orders using concatenated H-stranded amino acid sequences and the genome sequence of the SARS and coronavirus. The phylogeny trees constructed by the new method are consistent with the commonly accepted ones. These results are very promising and suggest more efforts for further developments. Keywords: CGR (Chaos Game Representation); Discrimination Information; Phylogeny Tree 1. INTRODUCTION Development of the nucleotide and protein sequencing technology have resulted in an explosive growth in the number of known DNA and protein sequences, it has raised many fundamental and challenging questions to modern biology. By analyzing a set of amino acid se- quences (or proteins) of different species, reconstruction of the evolutionary history of genes and species is one of the most important subjects in the current study of mo- lecular evolution. Although it is an important problem in bioinformatics, and, like many other problems, it is still an open subject for research. It is mainly due to the high degree of complexity of the problem [1] that leads to intractable search spaces when dealing with the phylog- eny of a large number of species. Current methods for the reconstruction of phylogeny trees can be roughly grouped into three kinds: maximum likelihood [2,3], maximum parsimony method [4] and distance-based methods. Maximum parsimony and max- imum likelihood methods use previously aligned se- quences of nucleotides as input, and they are less suscep- tible to errors. On the other hand, distance-based me- thods, such as UPGMA (unweighted pair group method using arithmetic averages) [5], Fitch-Margoliash [6] and neighbor-joining [7] use a matrix representing the dis- tances between pairs of species, and they are based on the principle of similarity. CGR [8,9] of biological sequences can investigate dif- ferent hiding patterns of different biological sequences. It has been reported that for biological sequences at least 2000 bases are required to generate identifiable patterns [9], which do not depend on the order in which they are concatenated. In this paper, when the length of sequence is shorter than 2000 bases, we concatenate the sequence with itself repeatedly until the whole length has sur- passed 2000. And we use the Kullback-Leibler dis- crimination information to measure the dissimilarity of each pair of biological sequences. The results proved the method is promising. 2. MATERIALS AND METHODS 2.1. Data Sets In order to test our method, we have selected two test data, protein sequence and DNA sequence separately. The reconstruction of whole protein and nucleotide phy- logenies using our new distance, all achieved very en- couraging results. 2.1.1. Protein Data Set It has been debated which two of three main groups of placental mammals are more closed related: Primates, Ferungulates, and Rodents. This is because by the maxi- mum likelihood method, some proteins support the (Ferungulates, (primates, Rodents)) grouping while other proteins support the (Rodents, (Ferungulates, Primates)) grouping [10]. Cao et al. aligned 12 concatenated mito-  N. N. Li et al. / J. Biomedical Science and Engineering 2 (2009) 582-586 583 SciRes Copyright © 2009 JBiSE chondrial proteins from the following species (available in the EMBL database (release 61)): human (Homo sapiens, V00622), common chimpanzee (Pan troglodytes, D38116), pygmy chimpanzee (Pan paniscus, D38113), gorilla (Gorilla gorilla, D38114), orangutan (pongo pyg- maeus, D38115), gibbon (Hylobates lar, X99256), Su- matran orangutan (pongo pygmaeus abelii, X97707), rat (Rattus norvegicus, X14848), house mouse (Mus mus- culus, V00711), grey seal (Halichoerus grypus, X72004), harbor seal (Phoca vitulina, X63726), cat (Felis catus, U20753), white rhino (Ceratotherium simum, Y07726), horse (Equus caballus, X79547), finback whale (Bala- enoptera physalus, X61145), blue whale (Balaenoptera musculus, X72204), cow (Bos taurus, V00654), using opossum (Didelphis virginiana, Z29573), wallaroo (Ma- cropus robustus, Y10524) and platypus (Ornithorhyn- chus anatinus, X83427) as the out-group, and built the maximum likelihood tree to confirm the grouping (Ro- dents, (Primates, Ferungulates)). So we select this con- troversial data set to test our method. 2.1.2. DNA Data Set From NCBI (National center for biotechnology informa- tion), we download the 12 coronavirus sequences and 12 SARS virus sequences [11,12] that have been cultured isolating from the index case from all over the world. The 24 complete genome sequences’ logo, accession, host, and location are listed in the Table 1. 2.2. Chaos Game of Representation of Proteins It is known that the protein sequence is formed by 20 different kinds of amino acids. Basu. et al. [8] classify 20 kinds of amino acids to 12 different groups according to Table 1. Coronaviruses and SARS virus sequences’ information. Logo Accession Host Location cAvian NC_001451.1 Avian cBovine_1 AF391541.1 Bovine cBovine_2 AF391542.1 Bovine cBovine_3 U00735.2 Bovine cBovine_4 AF220295.1 Bovine cHuman AF304460.1 Human cMouse AF029248.1 Murine cMurine_1 AF208066.1 Murine cMurine_2 AF201929.1 Murine cMurine_3 AF208067.1 Murine cPig_1 NC_002306.2 Pig cPig_2 NC_003436.1 Pig SARS_BJ01 AY278488.2 Human Beijing SARS_HK_1 AY282752.1 Human Hong Kong SARS_HK_2 AY278491.2 Human Hong Kong SARS_HK_3 AY278554.2 Human Hong Kong SARS_SG_1 AY283794.1 Human Singapore SARS_SG_2 AY283795.1 Human Singapore SARS_SG_3 AY283796.1 Human Singapore SARS_SG_4 AY283797.1 Human Singapore SARS_SG_5 AY283798.1 Human Singapore SARS_TOR2 AY274119.3 Human Toronto in Canada SARS_TW1 AY291451.1 Human Taiwan SARS_Urban AY278741.1 Human United States their different conservative substitutions such as alanine (A) and glycine (G), are considered as one vertex; serine (S) and threonine (T) represent a vertex; and so on. Fur- thermore, Basu. et al. claims that the following 12-ver- tex CGR algorithm is optimum for generation of distinct patterns for different protein families. Following the chaos game algorithm, the first amino acid residue of the concatenated protein sequence is plot- ted halfway between the random initial point and the vertex labelled with the first residue. The second residue in the sequence is then plotted halfway between the first point and the vertex labelled with the second residue. The process must be repeated until the last residue in the se- quence is plotted. The 12-sided polygon is divided into 24 segments (grid) as shown in Figure 1 and the segments are la- belled serially with numbers 1-24. For each segment, says Sk, we count the number of points fall in Sk, says Lk. (The points falling on boundaries should be counted in any one of the neighboring segments). Then set Gk = Lk/N; k = 1; 2; …; 24; where N is the length of the pro- tein sequence. From the above 12-vertex CGR algorithm, we can transform each protein sequence into a 24-di- mensional vector (G1; …; G24). Figure 1. Chaos game representation of protein. Figure 2. Chaos game of representation of DNA.  584 N. N. Li et al. / J. Biomedical Science and Engineering 2 (2009) 582-586 SciRes Copyright © 2009 2.3. Chaos Game Representation of DNA Sequence Similar to the chaos game representation of proteins, each of the four vertex of the square is labelled ‘a’, ‘c’, ‘g’, or ‘u’. According to the DNA sequence [9], we plot half way between the random initial point and the vertex labeled with the first nucleotide acid. Then the second nucleotide acid in the sequence is plotted halfway be- tween the first point and the vertex labelled with the second one. Following this method, it is repeated until the last nucleotide acid is plotted. JBiSE The square is divided into 16 segments (shown in Fig- ure 2). Each of segments is labelled with the numbers 1-16.Then we can count the percent of the points that are fallen into each of segment. Following this algorithm, each DNA sequence will induce a 16-dimensional vector (G1; …; G16). 2.4. The Kullback-Leibler Discrimination Information X is a discrete random variable. It has the different dis- tribution laws under the different hypotheses. Such as, under hypothesis H1, its distribution law is defined as follow: 12 111121 ()( )()() K K Xaa a pxpa papa By similarity, under hypothesis H2, its distribution is similar: 12 221222 ()( )( )() K K Xaa a pxpa papa The Kullback-Leibler discrimination information be- tween the two distributions is defined as follow: 1 12 1 12 () ()()() K i i ii pa Ip,pp alogpa The detailed step to measure the dissimilarity using this concept is listed as follow. For example, there are two sequences, X and Y. Fol- lowing the CGR algorithm, they can transform into the vector of the percent, (GX(1); …; GX(k)) and (GY(1); …; GY(k)) k = 16 or 24, according to the kind of biological sequence. The two vectors can be seen as the two dif- ferent distribution laws. 1 () ()() () k X Xx iY Gi IX ,YGiloglim Gi Then the Kullback-Leibler discrimination information of two frequencies distribution is defined as follow: I(X, Y) denote the discrimination information between the X and Y. It is should be noted that maybe some GY(i) = 0, this make GX(i)/GY(i) no sense. In this case, we may treat GY(i) as a very small positive real number, and this would not cause trouble, and make our discussion very conversional. At the same, we always note that 00log0 . Because the discrimination information has direction (also termed as directed divergence), it is I(X, Y) ≠ I(Y, X) in general, so we now introduce another measure J(X, Y) as the following: J(X, Y) = I(X, Y) + I(Y, X) Then J(X, Y) has the following properties: (1) J(X, Y) ≥ 0 (2) J(X, Y) = 0 if and only if X = Y. (3) J(X, Y) = J(Y, X). At last, we introduce Distance (X, Y) to measure the diversity (dissimilarity) of the biological sequences, X and Y. 3. RESULTS 3.1. Protein Data Set With the protein data set, firstly, the out-group species separate from other mammals. Secondly, the three classes grouped each other obviously. Above all, we computed the Distance (X, Y) for each pair of species X and Y and constructed a tree (shown in Figure 3) using the neighbor joining [7] program in the MOLPHY package. The tree is very close to the maximum likeli- hood tree of Cao et al [10]. We also support the collu- sion of the (Rodents, (Ferungulates, Primates)) grouping. And we try to connect the midpoint of every edge to divide the polygon into 84 segments. Then following the same routine, we get the similar phylogeny tree, there is one difference from the previous tree that the horse’s position is different. 3.2. DNA Data Set With the DNA data set, we reconstructed the phylogeny tree (shown in Figure 4), separated the coronavirus se- quences and SARS sequences completely. And the SARS sequences are more resemble to the first group of coronavirus. These results are similar to the commonly accepted results [13]. The 12 SARS virus sequences are obviously separated from the 12 coronavirus sequences. It supports the conclusion that SARS virus belong to the coronavirus, but they are different from the conventional coronavirus. On the phylogeny tree, SARS viruses are closest to the c_pig1, c_pig2 and c_Human which be- long to the first kind of the coronavirus according to the serotype. It shows that SARS virus is nearest to the first kind of coronavirus. This is different from the Rota et al [13]. But it supports the experiment result of the Ksiazek et al [14]. Then we further divide the every segment into four average parts. That is to say, we divide the square into 64 segments. With the same method, we get the completely same tree.  N. N. Li et al. / J. Biomedical Science and Engineering 2 (2009) 582-586 585 SciRes Copyright © 2009 JBiSE cow cat human chimpanzee pygmy chim gibbon orangutan sumatran o gorilla house mous rat horse white rhin finback wh blue whale wallaroo harbor sea gray seal platypus opossum Figure 3. Phylogeny tree with the mitochondrial proteins from 20 species. cPig 1 cPig 2 cHuman A cAvian F cBovine 1 cBovine 2 cBovine 3 cBovine 4 cMouse AF cMurine 3 cMurine 1 cMurine 2 SARS Ur b a n SARS SG2 SARS TW1 G4SARS S SARS SG5 HK1 SARS SG1 SARS SG3 SARS BJ01 SARS HK2 OR2SARS T SARS SARS HK3 Figure 4. Phylogeny tree with coronavirus and SARS virus sequences. 4. CONCLUSIONS We develop the new method based on the CGR of bio- logical sequences. We achieved the promising results. This method is universal. It can reconstruct the phylog- eny tree not only with the protein sequences data but also with the DNA (or RNA) sequences data. The nu- merical experiments show its stability. We tried to divide the square (or polygon) into more segments, and then we reconstruct the phylogeny tree in the similar way. We achieved the similar results. That is to say, the CGR method can show the distinct pattern for different pro- teins, no matter how to divide the pictures. And the Kullback-Leibler discrimination information can meas- ure the dissimilarity of the proteins rightly. The successful application to reconstruct the phylog- eny tree means that this new measurement of the dis- similarity between the biological molecules can not only use to reconstruct the phylogeny tree, but also apply to other comparative genomics research communities. REFERENCES [1] G. H. Gonnet. (1994) New algorithms for the compu- tation of evolutionary phylogenetic trees [M], Com- putationalMethods in Genome Research (Suhai, S., ed.), Plenum, New York, 153–161. [2] L. L. Cavalli Sforza and A. W. Edwards. (1967) Phy- logenetic analysis: Models and estimation procedures [J], Genetics, 19(3), 233–257. [3] J. Felesenstein. (1981) Evolutionary trees from DNA sequences: A maximum likelihood approach [J], J Mol Evol, 17(6), 368–376.  586 N. N. Li et al. / J. Biomedical Science and Engineering 2 (2009) 582-586 SciRes Copyright © 2009 JBiSE [4] L. Jin and M. Nei. (1990) Limitation of the evolution parsimony method of phylogenetic analysis [J], Mol Biol Evol, 7(1), 82–102. [5] R. R. Sokal and C. D. Michener. (1958). A statistical method for evaluating systematic relationships [J], Univ. Kans. Sci. Bull, 28, 1409–1438. [6] Chris. (2004) Fitch-Margoliash algorithm for calculating the branch lengths [EB/OL], http://www.bioinfo.rpi.edu/~bystr c/courses/biol4540/lectur e12/sld002.htm. [7] N. Saitou and M. Nei. (1987) The neighbor-joining method: A new method for reconstructing phylogenetic trees [J], Molecular Biology and Evolution, 4(4), 406– 425. [8] S. Basu, A. Pan, C. Dutta and J. Das. (1997) Chaos game representation of protein, J. Mol. Graphics Model, 15, 279–289. [9] H. J. Jeffrey. (1990) Chaos game representation of gene structure [J], Nucleic AcidsRes., 18, 2163–2170. [10] Y. Cao, N. Okada, and M. Hasegawa. (1997) Phylo- genetuc position of guinea pigs revisited [J], Mol. Biol. Evol., 14, 461–464. [11] M. A. Marra, S. J. Jones, C. R. Astell, et al. (2003) The genome sequence of the SARS-associated coronavirus [J], Science, 300(5624), 1399–1404. [12] Y. J. Ruan, C. L. Wei, L. A. Ee, et al. (2003) Com- parative full-length genome sequence analysis of 14 SARS coronavirus isolates and common mutations associated with putative origins of infection [J], The Lancet, 361(9371), 1779–1785. [13] P. A. Rota, M. S. Oberste, S. S. Monroe, et al. (2003) Characterization of a novel coronavirus associated with severe acute respiratory syndrome [J], Science, 300 (5624), 1394–1399. [14] T. G. Ksiazek, D. Erdman, C. Goldsmith, et al. (2003) A novel coronavirus associated with severe acute respira- tory syndrome [J], N Engl J Med, 348(20), 1953–1966. |