Paper Menu >>
Journal Menu >>
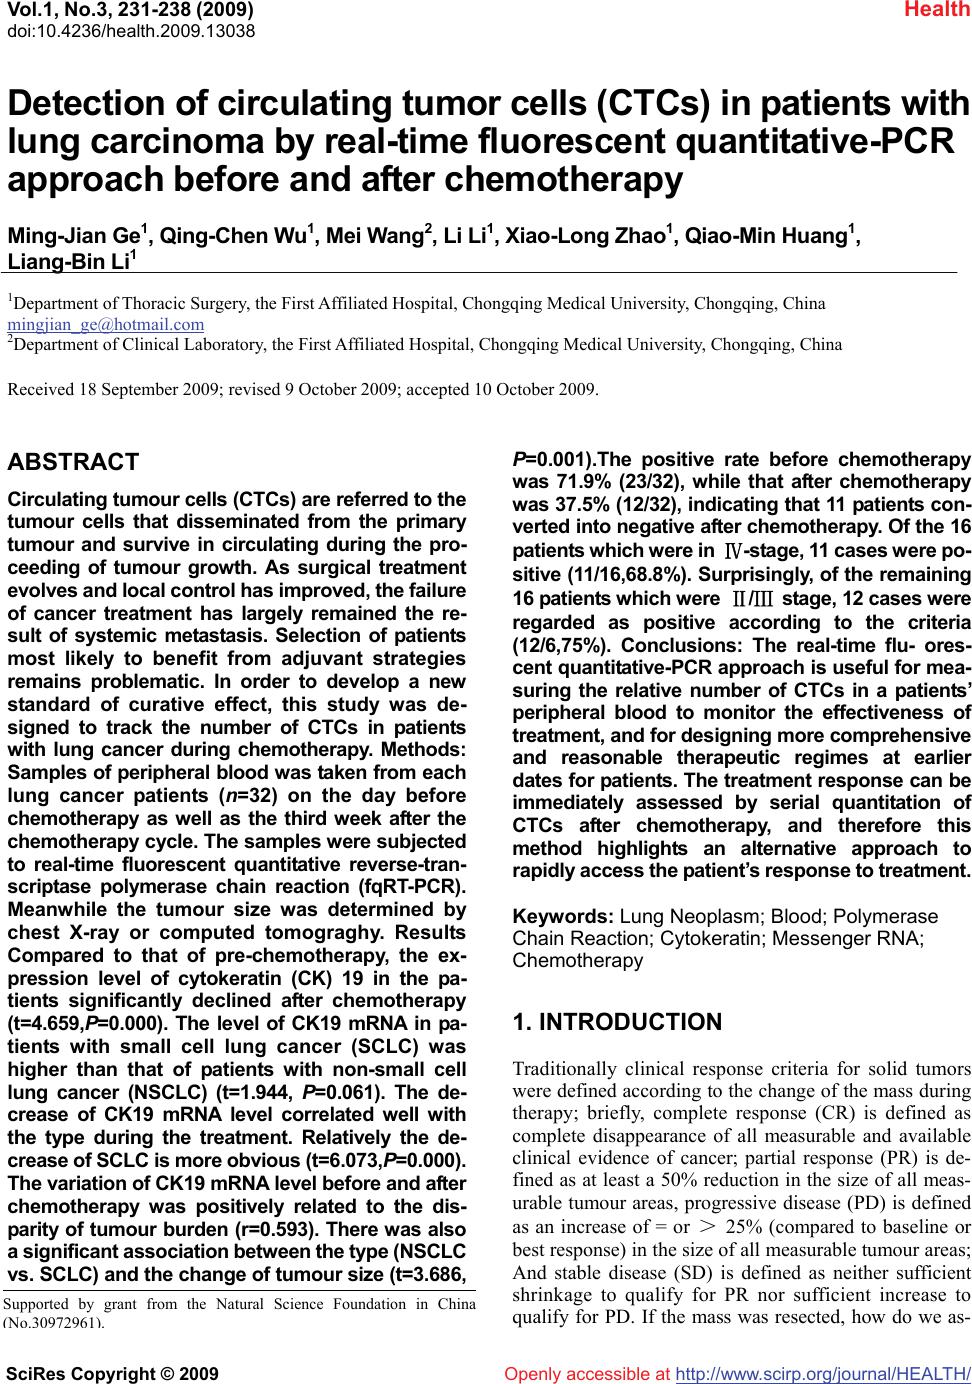 Vol.1, No.3, 231-238 (2009) doi:10.4236/health.2009.13038 SciRes Copyright © 2009 http://www.scirp.org/journal/HEALTH/ Health Openly accessible at Detection of circulating tumor cells (CTCs) in patients with lung carcinoma by real-time fluorescent quantitative-PCR approach before and after chemotherapy Ming-Jian Ge1, Qing-Chen Wu1, Mei Wang2, Li Li1, Xiao-Long Zhao1, Qiao-Min Huang1, Liang-Bin Li1 1Department of Thoracic Surgery, the First Affiliated Hospital, Chongqing Medical University, Chongqing, China mingjian_ge@hotmail.com 2Department of Clinical Laboratory, the First Affiliated Hospital, Chongqing Medical University, Chongqing, China Received 18 September 2009; revised 9 October 2009; accepted 10 October 2009. ABSTRACT Circulating tumour cells (CTCs) are referred to the tumour cells that disseminated from the primary tumour and survive in circulating during the pro- ceeding of tumour growth. As surgical treatment evolves and local control has improved, the failure of cancer treatment has largely remained the re- sult of systemic metastasis. Selection of patients most likely to benefit from adjuvant strategies remains problematic. In order to develop a new standard of curative effect, this study was de- signed to track the number of CTCs in patients with lung cancer during chemotherapy. Methods: Samples of peripheral blood was taken from each lung cancer patients (n=32) on the day before chemotherapy as well as the third week after the chemotherapy cycle. The samples were subjected to real-time fluorescent quantitative reverse-tran- scriptase polymerase chain reaction (fqRT-PCR). Meanwhile the tumour size was determined by chest X-ray or computed tomograghy. Results Compared to that of pre-chemotherapy, the ex- pression level of cytokeratin (CK) 19 in the pa- tients significantly declined after chemotherapy (t=4.659,P=0.000). The level of CK19 mRNA in pa- tients with small cell lung cancer (SCLC) was higher than that of patients with non-small cell lung cancer (NSCLC) (t=1.944, P=0.061). The de- crease of CK19 mRNA level correlated well with the type during the treatment. Relatively the de- crease of SCLC is more obvious (t=6.073,P=0.000). The variation of CK19 mRNA level before and after chemotherapy was positively related to the dis- parity of tumour burden (r=0.593). There was also a significant association between the type (NSCLC vs. SCLC) and the change of tumour size (t=3.686, P=0.001).The positive rate before chemotherapy was 71.9% (23/32), while that after chemotherapy was 37.5% (12/32), indicating that 11 patients con- verted into negative after chemotherapy. Of the 16 patients which were in Ⅳ-stage, 11 cases were po- sitive (11/16,68.8%). Surprisingly, of the remaining 16 patients which were Ⅱ/Ⅲ stage, 12 cases were regarded as positive according to the criteria (12/6,75%). Conclusions: The real-time flu- ores- cent quantitative-PCR approach is useful for mea- suring the relative number of CTCs in a patients’ peripheral blood to monitor the effectiveness of treatment, and for designing more comprehensive and reasonable therapeutic regimes at earlier dates for patients. The treatment response can be immediately assessed by serial quantitation of CTCs after chemotherapy, and therefore this method highlights an alternative approach to rapidly access the patient’s response to treatment. Keywords: Lung Neoplasm; Blood; Polymerase Chain Reaction; Cytokeratin; Messenger RNA; Chemotherapy 1. INTRODUCTION Traditionally clinical response criteria for solid tumors were defined according to the change of the mass during therapy; briefly, complete response (CR) is defined as complete disappearance of all measurable and available clinical evidence of cancer; partial response (PR) is de- fined as at least a 50% reduction in the size of all meas- urable tumour areas, progressive disease (PD) is defined as an increase of = or > 25% (compared to baseline or best response) in the size of all measurable tumour areas; And stable disease (SD) is defined as neither sufficient shrinkage to qualify for PR nor sufficient increase to qualify for PD. If the mass was resected, how do we as- Supported by grant from the Natural Science Foundation in China ( No.30972961 ). 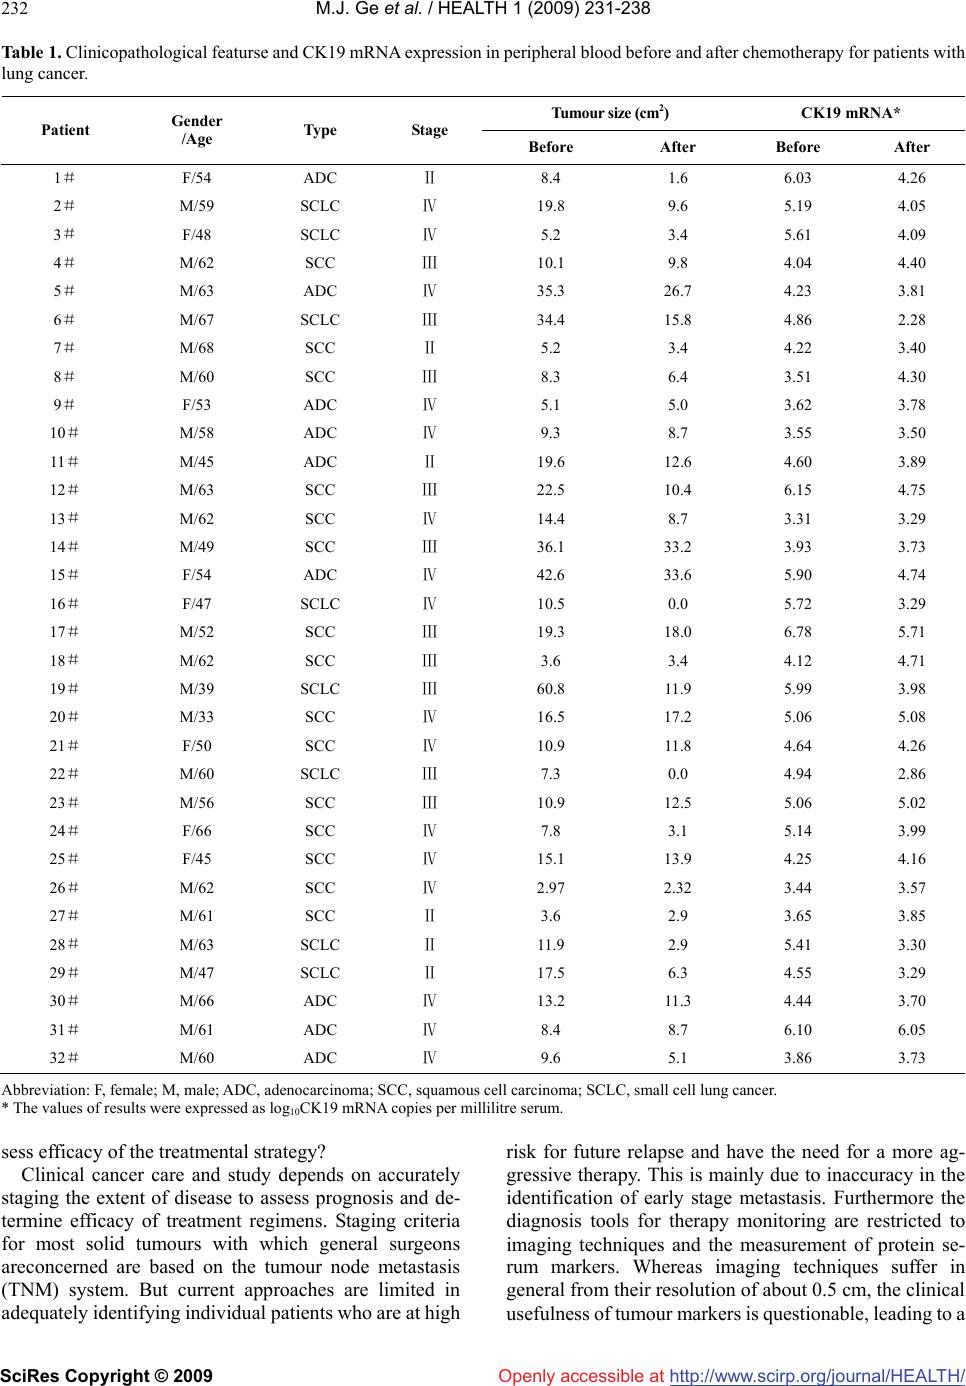 M.J. Ge et al. / HEALTH 1 (2009) 231-238 SciRes Copyright © 2009 http://www.scirp.org/journal/HEALTH/Openly accessible at 232 Table 1. Clinicopathological featurse and CK19 mRNA expression in peripheral blood before and after chemotherapy for patients with lung cancer. Tumour size (cm2) CK19 mRNA* Patient Gender /Age Type Stage Before After Before After 1# F/54 ADC Ⅱ 8.4 1.6 6.03 4.26 2# M/59 SCLC Ⅳ 19.8 9.6 5.19 4.05 3# F/48 SCLC Ⅳ 5.2 3.4 5.61 4.09 4# M/62 SCC Ⅲ 10.1 9.8 4.04 4.40 5# M/63 ADC Ⅳ 35.3 26.7 4.23 3.81 6# M/67 SCLC Ⅲ 34.4 15.8 4.86 2.28 7# M/68 SCC Ⅱ 5.2 3.4 4.22 3.40 8# M/60 SCC Ⅲ 8.3 6.4 3.51 4.30 9# F/53 ADC Ⅳ 5.1 5.0 3.62 3.78 10# M/58 ADC Ⅳ 9.3 8.7 3.55 3.50 11 # M/45 ADC Ⅱ 19.6 12.6 4.60 3.89 12# M/63 SCC Ⅲ 22.5 10.4 6.15 4.75 13# M/62 SCC Ⅳ 14.4 8.7 3.31 3.29 14# M/49 SCC Ⅲ 36.1 33.2 3.93 3.73 15# F/54 ADC Ⅳ 42.6 33.6 5.90 4.74 16# F/47 SCLC Ⅳ 10.5 0.0 5.72 3.29 17# M/52 SCC Ⅲ 19.3 18.0 6.78 5.71 18# M/62 SCC Ⅲ 3.6 3.4 4.12 4.71 19# M/39 SCLC Ⅲ 60.8 11.9 5.99 3.98 20# M/33 SCC Ⅳ 16.5 17.2 5.06 5.08 21# F/50 SCC Ⅳ 10.9 11.8 4.64 4.26 22# M/60 SCLC Ⅲ 7.3 0.0 4.94 2.86 23# M/56 SCC Ⅲ 10.9 12.5 5.06 5.02 24# F/66 SCC Ⅳ 7.8 3.1 5.14 3.99 25# F/45 SCC Ⅳ 15.1 13.9 4.25 4.16 26# M/62 SCC Ⅳ 2.97 2.32 3.44 3.57 27# M/61 SCC Ⅱ 3.6 2.9 3.65 3.85 28# M/63 SCLC Ⅱ 11.9 2.9 5.41 3.30 29# M/47 SCLC Ⅱ 17.5 6.3 4.55 3.29 30# M/66 ADC Ⅳ 13.2 11.3 4.44 3.70 31# M/61 ADC Ⅳ 8.4 8.7 6.10 6.05 32# M/60 ADC Ⅳ 9.6 5.1 3.86 3.73 Abbreviation: F, female; M, male; ADC, adenocarcinoma; SCC, squamous cell carcinoma; SCLC, small cell lung cancer. * The values of results were expressed as log10CK19 mRNA copies per millilitre serum. sess efficacy of the treatmental strategy? Clinical cancer care and study depends on accurately staging the extent of disease to assess prognosis and de- termine efficacy of treatment regimens. Staging criteria for most solid tumours with which general surgeons areconcerned are based on the tumour node metastasis (TNM) system. But current approaches are limited in adequately identifying individual patients who are at high risk for future relapse and have the need for a more ag- gressive therapy. This is mainly due to inaccuracy in the identification of early stage metastasis. Furthermore the diagnosis tools for therapy monitoring are restricted to imaging techniques and the measurement of protein se- rum markers. Whereas imaging techniques suffer in general from their resolution of about 0.5 cm, the clinical usefulness of tumour markers is questionable, leading to a 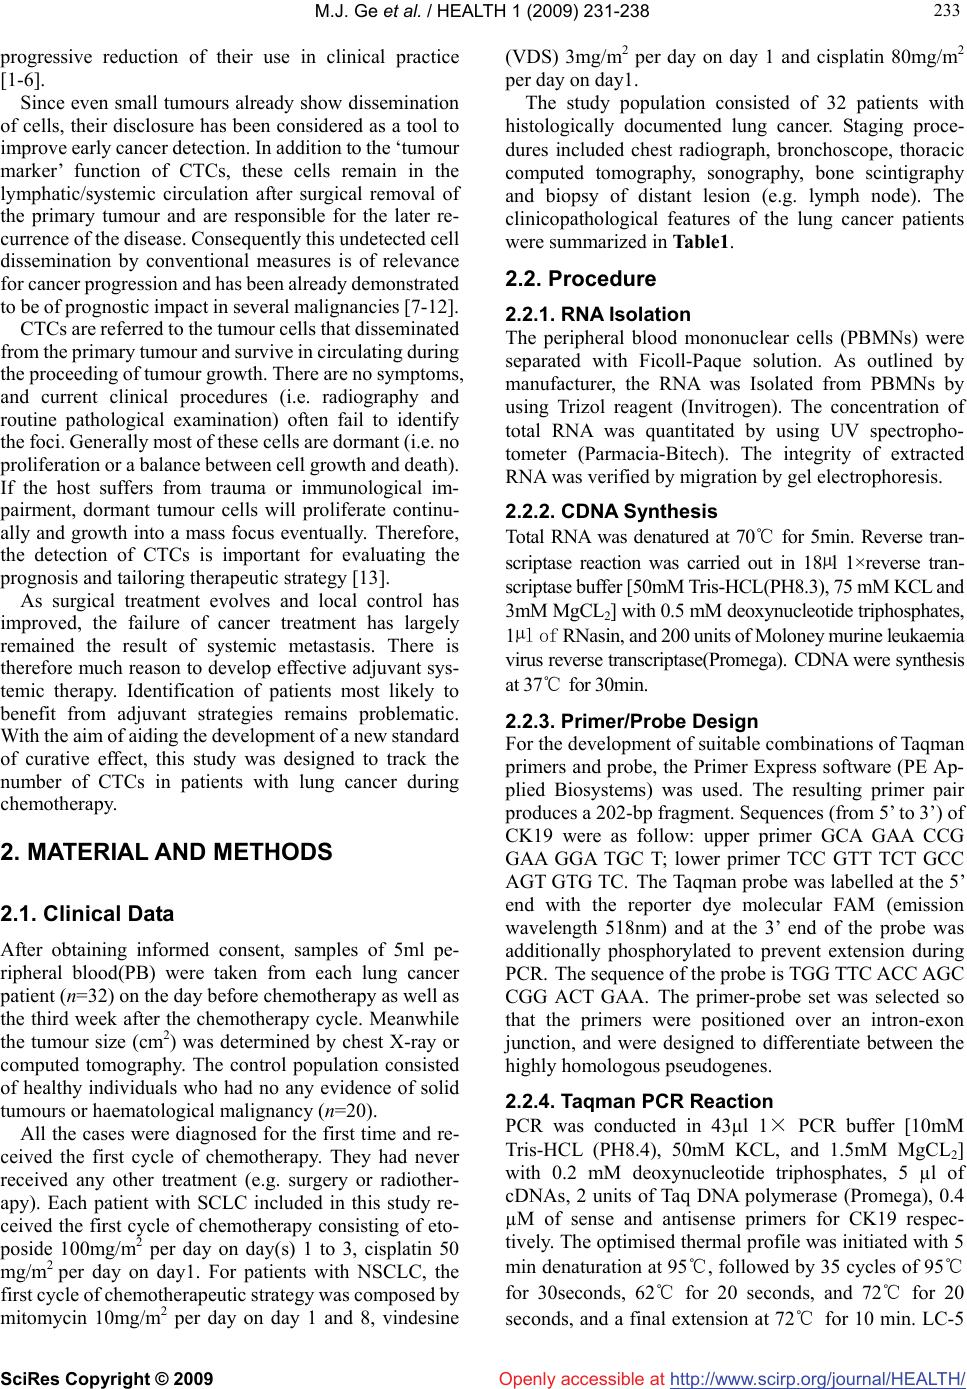 M.J. Ge et al. / HEALTH 1 (2009) 231-238 SciRes Copyright © 2009 http://www.scirp.org/journal/HEALTH/Openly accessible at 233 233 progressive reduction of their use in clinical practice [1-6]. Since even small tumours already show dissemination of cells, their disclosure has been considered as a tool to improve early cancer detection. In addition to the ‘tumour marker’ function of CTCs, these cells remain in the lymphatic/systemic circulation after surgical removal of the primary tumour and are responsible for the later re- currence of the disease. Consequently this undetected cell dissemination by conventional measures is of relevance for cancer progression and has been already demonstrated to be of prognostic impact in several malignancies [7-12]. CTCs are referred to the tumour cells that disseminated from the primary tumour and survive in circulating during the proceeding of tumour growth. There are no symptoms, and current clinical procedures (i.e. radiography and routine pathological examination) often fail to identify the foci. Generally most of these cells are dormant (i.e. no proliferation or a balance between cell growth and death). If the host suffers from trauma or immunological im- pairment, dormant tumour cells will proliferate continu- ally and growth into a mass focus eventually. Therefore, the detection of CTCs is important for evaluating the prognosis and tailoring therapeutic strategy [13]. As surgical treatment evolves and local control has improved, the failure of cancer treatment has largely remained the result of systemic metastasis. There is therefore much reason to develop effective adjuvant sys- temic therapy. Identification of patients most likely to benefit from adjuvant strategies remains problematic. With the aim of aiding the development of a new standard of curative effect, this study was designed to track the number of CTCs in patients with lung cancer during chemotherapy. 2. MATERIAL AND METHODS 2.1. Clinical Data After obtaining informed consent, samples of 5ml pe- ripheral blood(PB) were taken from each lung cancer patient (n=32) on the day before chemotherapy as well as the third week after the chemotherapy cycle. Meanwhile the tumour size (cm2) was determined by chest X-ray or computed tomography. The control population consisted of healthy individuals who had no any evidence of solid tumours or haematological malignancy (n=20). All the cases were diagnosed for the first time and re- ceived the first cycle of chemotherapy. They had never received any other treatment (e.g. surgery or radiother- apy). Each patient with SCLC included in this study re- ceived the first cycle of chemotherapy consisting of eto- poside 100mg/m2 per day on day(s) 1 to 3, cisplatin 50 mg/ m2 per day on day1. For patients with NSCLC, the first cycle of chemotherapeutic strategy was composed by mitomycin 10mg/m2 per day on day 1 and 8, vindesine (VDS) 3mg/m2 per day on day 1 and cisplatin 80mg/m2 per day on day1. The study population consisted of 32 patients with histologically documented lung cancer. Staging proce- dures included chest radiograph, bronchoscope, thoracic computed tomography, sonography, bone scintigraphy and biopsy of distant lesion (e.g. lymph node). The clinicopathological features of the lung cancer patients were summarized in Table1. 2.2. Procedure 2.2.1. RNA Isolation The peripheral blood mononuclear cells (PBMNs) were separated with Ficoll-Paque solution. As outlined by manufacturer, the RNA was Isolated from PBMNs by using Trizol reagent (Invitrogen). The concentration of total RNA was quantitated by using UV spectropho- tometer (Parmacia-Bitech). The integrity of extracted RNA was verified by migration by gel electrophoresis. 2.2.2. CDNA Synthesis Total RNA was denatured at 70℃ for 5min. Reverse tran- scriptase reaction was carried out in 18µl 1×reverse tran- scriptase buffer [50mM Tris-HCL(PH8.3), 75 mM KCL and 3mM MgCL2] with 0.5 mM deoxynucleotide triphosphates, 1µl of RNasin, and 200 units of Moloney murine leukaemia virus reverse transcriptase(Promega). CDNA were synthesis at 37℃ for 30min. 2.2.3. Primer/Probe Design For the development of suitable combinations of Taqman primers and probe, the Primer Express software (PE Ap- plied Biosystems) was used. The resulting primer pair produces a 202-bp fragment. Sequences (from 5’ to 3’) of CK19 were as follow: upper primer GCA GAA CCG GAA GGA TGC T; lower primer TCC GTT TCT GCC AGT GTG TC. The Taqman probe was labelled at the 5’ end with the reporter dye molecular FAM (emission wavelength 518nm) and at the 3’ end of the probe was additionally phosphorylated to prevent extension during PCR. The sequence of the probe is TGG TTC ACC AGC CGG ACT GAA. The primer-probe set was selected so that the primers were positioned over an intron-exon junction, and were designed to differentiate between the highly homologous pseudogenes. 2.2.4. Taqman PCR Reaction PCR was conducted in 43µl 1× PCR buffer [10mM Tris-HCL (PH8.4), 50mM KCL, and 1.5mM MgCL2] with 0.2 mM deoxynucleotide triphosphates, 5 µl of cDNAs, 2 units of Taq DNA polymerase (Promega), 0.4 µM of sense and antisense primers for CK19 respec- tively. The optimised thermal profile was initiated with 5 min denaturation at 95℃, followed by 35 cycles of 95℃ for 30seconds, 62℃ for 20 seconds, and 72℃ for 20 seconds, and a final extension at 72℃ for 10 min. LC-5  M.J. Ge et al. / HEALTH 1 (2009) 231-238 SciRes Copyright © 2009 http://www.scirp.org/journal/HEALTH/ 234 Openly accessible at RNA standards and multiple water blanks were analysed in parallel with blood samples in each set of PCRs. All reactions were performed in the ABI Prism 7000 Se- quence Detection System. The initial concentration of every sample could be achieved according to the standard curves gained previ- ously. In this study, the values of results were expressed as log10CK19mRNA copies per millilitre serum. All reac- tions were performed in the ABI Prism 7000 Sequence Detection System (Perkin-Elmer Applied Biosystems), which detects the signal from the fluorogenic probe dur- ing PCR. The 7000 system has a built-in thermal cycler and a laser directed via fiber optical cables to each of the 96 sample wells. A charge-coupled device camera col- lects the emission from each sample and the data are analysed automatically. The software accompanying the 7000 system calculates cycle threshold (Ct) and deter- mines the starting copy number in the samples. 2.2.5. Spiking Experiment Using LC-5 Cells LC-5 cells (a squamous cell line of lung cancer) from a monolayer culture were harvested with trypsin-EDTA (Sigma), washed in cold PBS and resuspended. Cell densities were evaluated using a counting chamber and viability by trypan blue staining (Sigma). Densities were adapted to a total of 106 cells in 2 ml diehypyrocarbon- ate-treated water. To simulate the presence of lung cancer cells in the circulation of lung cancer patients, total RNA was first extracted from 107 PBMNs from healthy sub- jects and 106 LC-5 cells. Aliquots of total RNA from 106 PBMNs were mixed with LC-5 total RNA, corresponding to 1,10,102,103,104 and 105 LC-5 cells. As for the negative control, only RNA extracted from 106 PBMNs was used. The RNA mixtures were then subject to fqRT-PCR for construction of the calibration curves and receiver op- erator characteristic (ROC) curves. Each sample was measured in triplicate. 2.3. Statistical Analysis The results were analysed with statistical software SPSS10.0 for Windows. The statistical assays included paired samples t test, independent samples t test and bivariate correlate analysis, with P<0.05 indicating significance. The method used to calculate the appropriate sample size in the study was similar to that used to paired measurement data. Sup- pose if TypeⅠerror is 0.05,the sample sizes for both pre- and post-chemotherapeutical group were thirty, respectively. The weighted sample size i.e. thirty-two, calculated by the proposed method, preserved the power (1-β) above 0.9. 3. RESULTS 3.1. Evaluation of the CK19 Diagnostic Test To rigorously define the value of the real time RT-PCR 1 - Specificity 1.00.75.50.250.00 Sensitivity 1.00 .75 .50 .25 0.00 Figure 1. ROC curve of CK19 diagnostic test. ROC curve analysis is based on a plot of sensitivity as a function of 1-specificity. The area under the curve in this study was 0.965, indicating high accu- racy. In this study, the upper value of the confidence interval of the median of the volunteer group was considered as the cut-off value, which is 4.120.Under this standard, the sensitivity of the diagnostic test was 90%, and the specificity was 84%. Figure 2. Standard curve for LC-5cell line dilutions. The graph shows the Ct value versus the log of the number of CK19 mRNA, measured in triplicate. The standard curve shows 4 orders of linear dynamic range. analysis for the detection of CTCs, we performed a ROC curve analysis using SPSS 10.0 for windows software. ROC curve analysis is based on a plot of sensitivity as a function of 1-specificity. The area under the ROC curve in this study was 0.965 (95% confidence interval:0.916~1.014) (Figure 1). In order to define the criteria to identify true positiv- ity,the upper value of the confidence interval of the median of the volunteer group was considered as the cut-off value,  M.J. Ge et al. / HEALTH 1 (2009) 231-238 SciRes Copyright © 2009 http://www.scirp.org/journal/HEALTH/ 235 235 Openly accessible at which is 4.120. Under this standard, the sensitivity of the diagnostic test was 90%, and the specificity was 84%. The reproducibility of the technique was established with the Ct value obtained for each dilution (105~108) of the standard curve in different assays and within an assay: the intraassay and interassay CVs of the threshold cycle were 2.2 and 6.5%, respectively, on average. Standard curve and amplification plots are showed in Figure 2 and Figure 3, respectively. 3.2. Comparison of CK19 Mrna Level in PB Before and after Chemotherapy Compared to that of pre-chemotherapy, the expression level of CK19 in peripheral blood significantly declined post-chemotherapeutically (4.7323±0.9698 vs. 3.9864 ± 0.8309, t=4.659, P=0.000. Paired Samples T Test). 3.3. The Relationship Between CK19 MRNA Level in PB and Classic Clinocopathological Features The level of CK19 mRNA in patients with SCLC was higher than that of patients with NSCLC (5.2853±0.4880 vs. 4.5480±1.0263, t=1.944, P=0.061, Independent Sam- ples T Test, Figure 4). Nevertheless, there was no link between value and other clinicopathological parameters such as stage, gender and age etc. (P>0.05). The difference of CK19 mRNA level correlated well with the type during the treatment. Relatively the dispar- ity of SCLC is more obvious (1.8924 vs. 0.3637, t=6.073, P=0.000, Independent Samples T Test). However, there was no relationship between the difference of CK19 mRNA level and other parameters such as stage, gender and age etc. (P>0.05). The variation of CK19 mRNA level before and after chemotherapy was positively re- lated to the disparity of tumour burden (r=0.593, P=0.000, Bivariate Correlation Analysis). There was also a sig- nificant association between the type (NSCLC vs. SCLC) and the difference of tumour size (3.0525 vs. 14.6875, t=3.686, P=0.001, Independent Samples T Test). Figure 5 showed the difference of tumour volumes of different types of tumour before and after treatment. 3.4. The Positive Rate of CK19 Gene Expressive Level before and after Chemotherapy The upper value (4.120) of confidence interval of the median (3.6647) of the healthy volunteer group was con- sidered as the cut-off value. If lgCK19>4.120, the case would be classified as a positive one. The positive rate before chemotherapy was 71.9% (23/32), while that after chemotherapy was 37.5% (12/32), indicating that 11 patients converted into negative after chemotherapy. Of the 16 patients who were in Ⅳ-stage,11 cases were posi- tive(11/16,68.8%). Surprisingly, of the remaining 16 patients who were Ⅱ/Ⅲ stage,12 cases were regarded as Figure 3. Typical amplification plot. The graph of the increment of fluorescence reporter signal(ΔRn) versus cycle number during PCR shows three stages: baseline, exponential phase, and plateau. The Ct value is calculated by determining the point at which the fluorescence exceeds an arbitrary threshold limit. For each reaction tube, the fluorescence signal of the reporter dye is divided by the fluorescence signal of the passive reference dye, to obtain a ratio defined as the normalized reporter signal (Rn). ΔRn represents the normalized reporter signal (Rn) minus the baseline signal. SCC/ADC SCLC 3 4 5 6 7 Pathological Type Lg CK19mRNA Figure 4. The comparison of CK19 mRNA in PB of patients with SCLC and NSCLC before chemotherapy. positive according to the criteria (12/16,75%). 4. DISCUSSION Since traditional RT-PCR technology is at best semi- -quantitative, it has been difficult to differentiate between baseline level of gene expression in normal tissues and increased level of gene expression associated with cancer, rising the concerning for false-positive results. In this study, the real time PCR was exploited to investigate the possibility of using easily accessible body fluids as a source for CTCs detection enabling longitudinal obser- vation of the disease, therapy monitoring and initial di- agnosis.  M.J. Ge et al. / HEALTH 1 (2009) 231-238 SciRes Copyright © 2009 http://www.scirp.org/journal/HEALTH/ 236 Openly accessible at 824824N = Pathological Type SCLCNSCLC Variation of CK19 mRNA or Mass Volume 20 15 10 5 0 -5 -10 lgpre ck-lg po stck prevol-postvol Figure 5. The comparison of CK19 mRNA in PB and tumour volumes of patients with SCLC and NSCLC before and after treatment. In this study, we could detect low level of CK19 ex- pression in healthy volunteers, suggesting low expression in non-malignant cells in peripheral blood. In order to define criteria to identify true positivity, we have taken this observation into account in the calculation of the median and 95% CI of the median (i.e. the upper limit for normal expression) of the volunteer group. In order to define criteria to identify true positivity, the upper value of the confidence interval of the median of the volunteer group was considered as the “cut-off” value. Therefore, the specificity of CK19 analysis could be restored by the use of a quantitative assay with subtraction of background transcription. The possibility of obtaining quantitative information represents a milestone in the identification of subtle changes in the expression profiles and numbers of circulating tumour cells. The real-time PCR method of- fers several advantages over other current quantitative PCR methods [14]. The study demonstrated that, comparing with that of pre-chemotherapy, the expression level of CK19 in PB of patients with lung cancer declined dramatically after chemotherapy (P=0.000). We believed that, due to anti- cancer drugs, the number of cancer cells shedding from primary tumour decrease greatly. Furthermore, these drugs could directly kill cancer cells in the circulation. The level of CK19 mRNA in PB of patients with SCLC was higher than that of NSCLC (P=0.061). After one cycle of chemotherapy, the dropping of CK19 mRNA level in SCLC was much more obvious than that of NSCLC (P=0.000). The phenomena could be due to two group’s different sensitivity to chemotherapy, coordinat- ing with previous studies. The traditional standard for evaluating the curative effect of solid tumour depends on the variation of the mass size. It belongs to magnificent criterion. In clinical practise, in order to develop more accurate standard, other factors such as cytology and molecular ones should be taken into account. To improve the current staging and effect of tumours, oncologists are striving for new norm. This study showed that the dif- ference in expression level of CK19 in PB was correlated well with the variation of tumour size during chemo- therapy, indicating that it could be considered as a brand new criterion regarding assessing the result of therapy. Blood can be sampled throughout the course of the dis- ease and its collection is a minimally invasive procedure. The permanent access to CTCs enables follow up studies to be done to forecast prognostication of disease outcome, therapy monitoring or drug targeting. For example, for postoperative patients whose mass no longer exits, it could be exploited to evaluate the animated therapeutic results. It was interesting that we found there was no correla- tion between the existence of CTCs and the traditional TNM staging system. Why were only 11 patients not all who were in Ⅳ stage positive in this study? We insisted that this phenomenon could be due to intermittent shed- ding of tumour cells in the circulation. This problem should be overcome by sequential sampling, defined as the analysis of multiple blood samples at different time points. False-negative results could also be due to down-regulation of the target gene by therapy (e.g. hor- monal treatment) or to the presence of poorly differenti- ated subclones that do not express the tissue-specific marker being tested. For example, PSA mRNA expres- sion was shown to be decreased by antiandrogen therapy [15] and in poorly differentiated prostatic carcinoma [16]. The use of multiple markers will help diminish these types of false negative. On the other hand, it was sur- prising that, of the 16 patients who were on Ⅱ/Ⅲ stage, 12 cases were positive! We believe that many cancers have systemic spread at an early stage of their develop- ment. The presence of CTCs in PB should be incorporated in the UICC staging nomenclature by including isolated tumour cells (Mi) in the M-stage of the Tumour - Node - Metastases classification. Patients with occult dissemi- nation of viable tumour cells are not cured by surgery alone and may benefit from additional adjuvant therapy [17]. The permanent access to CTCs enables longitudinal studies to monitor therapy outcome. This aspect is sub- stantially improved by recent quantitative methods (e.g. FQ-PCR) allowing the detection of changes in the quality and number of tumour cells [18]. In contrast to solid metastatic tumours, micrometastatic tumour cells are an appropriate target for intravenously applied agents be- cause macromolecular and immunocompetent effectors cells should have access to the tumour cells. Because the majority of micrometastatic tumour cells may be non- proliferative (G0 phase), standard cytotoxic chemothera- pies aimed at proliferating cells may be less effective,  M.J. Ge et al. / HEALTH 1 (2009) 231-238 SciRes Copyright © 2009 http://www.scirp.org/journal/HEALTH/ 237 237 Openly accessible at which might explain, in part, the failure of chemotherapy. Thus, adjuvant therapies that are aimed at dividing and quiescent cells, such as antibody-based therapies, are of considerable interest [19]. Our study showed that quantitation of CTCs is possible during the course of therapy. Because cancer cells express different levels of CK19 mRNA, patients with higher CK19 mRNA level do not necessarily have more CTCs in peripheral blood than do patients with lower one. Nev- ertheless, the real-time fluorescent quantitative-PCR ap- proach is useful for measuring the relative number of CTCs in a patients’ peripheral blood to monitor the ef- fectiveness of treatment. In a limited number of patients, we demonstrated that the relative number of CTCs cor- related well with the tumour burden and therapeutic re- sponse. This method highlights an alternative approach to rapidly access the treatment response of patients. The treatment response can be immediately assessed by serial quantitation of CTCs after chemotherapy. This method may, therefore, help to design more comprehensive and reasonable therapeutic regimen at an earlier date for pa- tients [20]. A large prospective study is needed to deter- mine whether prognostic significance can be derived from the presence of CTCs and whether this group of patients might benefit from adjuvant treatment. 5. ACKNOWLEDGEMENTS I extremely thank Dr Gaynor Bates, who works in Breast Cancer Campaign in UK, for her suggestion concerning the revision for the initial English draft of the study. I am indebted to all the members of the Chongqing Lung Cancer Center who have cheerfully donated the sam- ples. REFERENCES [1] S. Lankiewicz, S Zimmermann, C Hollmann, T Hillemann, T. F. Greten, (2008) Circulating tumour cells as a predictive factor for response to systemic chemotherapy in patients with advanced colorectal cancer, Mol Oncol, 2(4), 349-355. [2] C. Wu, H. Hao, L. Li, X. Zhou, Z. Guo, L. Zhang, X. Zhang, W. Zhong, H. Guo, R.M. Bremner, P. Lin, (2009) Pre- liminary investigation of the clinical significance of de- tecting circulating tumor cells enriched from lung cancer patients, J Thorac Oncol, 4(1), 30-36. [3] T. Okegawa, K. Nutahara, E. Higashihara, (2008) Im- munomagnetic quantification of circulating tumor cells as a prognostic factor of androgen deprivation responsive- ness in patients with hormone naive metastatic prostate cancer, J Urol, 180(4), 1342-1347. [4] M. Tewes, B. Aktas, A. Welt, S. Mueller, S. Hauch, R. Kimmig, S. Kasimir-Bauer, (2009) Molecular profiling and predictive value of circulating tumor cells in patients with metastatic breast cancer: an option for monitoring response to breast cancer related therapies, Breast Cancer Res Treat, 115(3), 581-590. [5] S. Maheswaran, L.V. Sequist, S. Nagrath, L. Ulkus, B. Brannigan, C.V. Collura, E. Inserra, S. Diederichs, A. J. Iafrate, D. W. Bell, S. Digumarthy, A. Muzikansky, D. Irimia, J. Settleman, R. G. Tompkins, T. J. Lynch, M. Toner, D. A. Haber, (2008) Detection of mutations in EGFR in circulating lung-cancer cells, N Engl J Med, 359(4), 366- 377. [6] M. Ignatiadis, G. Kallergi, M. Ntoulia, M. Perraki, S. Apostolaki, M. Kafousi, G. Chlouverakis, E. Stathopoulos, E. Lianidou, V. Georgoulias, D. Mavroudis, (2008) Prog- nostic value of the molecular detection of circulating tumor cells using a multimarker reverse transcription-PCR assay for cytokeratin 19, mammaglobin A, and HER2 in early breast cancer, Clin Cancer Res, 14(9), 2593-2600. [7] N. Xenidis, M. Ignatiadis, S. Apostolaki, M. Perraki, K. Kalbakis, S. Agelaki, E. N. Stathopoulos, G. Chlouverakis, E. Lianidou, S. Kakolyris, V. Georgoulias, D. Mavroudis, (2009) Cytokeratin-19 mRNA-positive circulating tumor cells after adjuvant chemotherapy in patients with early breast cancer, J Clin Oncol, 27(13), 2177-2184. [8] S. J. Cohen, C. J. Punt, N. Iannotti, B. H. Saidman, K. D. Sabbath, N. Y. Gabrail, J. Picus, M. A. Morse, E. Mitchell, M. C. Miller, G. V. Doyle, H. Tissing, L. W. Terstappen, N. J. Meropol, (2009) Prognostic significance of circulating tumor cells in patients with metastatic colorectal cancer, Ann Oncol, 20(7), 1223-1229. [9] M. J. Serrano, P. Sánchez-Rovira, M. Delgado-Rodriguez, J. J. Gaforio, (2009) Detection of circulating tumor cells in the context of treatment: prognostic value in breast cancer, Cancer Biol Ther, 8(8), 671-675. [10] H. I. Scher, X. Jia, J. S. de Bono, M. Fleisher, K. J. Pienta, D. Raghavan, G. Heller, (2009) Circulating tumour cells as prognostic markers in progressive, castration-resistant prostate cancer: a reanalysis of IMMC38 trial data, Lancet Oncol, 10(3), 233-239. [11] T. Kuroda, N. Morikawa, K. Matsuoka, A. Fujino, T. Honna, A. Nakagawa, M. Kumagai, H. Masaki, M. Saeki, (2008) Prognostic significance of circulating tumor cells and bone marrow micrometastasis in advanced neuro- blastoma, J Pediatr Surg, 43(12), 2182-2185. [12] J. S. de Bono, H. I. Scher, R. B. Montgomery, C. Parker, M. C. Miller, H. Tissing, G. V. Doyle, L. W. Terstappen, K. J. Pienta, D. Raghavan, (2008) Circulating tumor cells predict survival benefit from treatment in metastatic castration -resistant prostate cancer, Clin Cancer Res, 14(19), 6302- 6309. [13] B. J. Curry, K. Myers, P. Hersey, (1998) Polymerase chain reaction detection of melanoma cells in the circulation: relation to clinical stage, surgical treatment, and recur- rence from melanoma, J Clin Oncol, 16(5), 1760-1769. [14] F. S. Celi, M. M. Cohen, S. E. Antonarakis, E. Wertheimer, J. Roth, A. R. Shuldiner, (1994) Determination of gene dosage by a quantitative adaptation of the polymerase chain reaction (gd-PCR): rapid detection of deletions and duplications of gene sequences.Genomics, 21(2), 304- 310. [15] C. Y. Young, B. T. Montgomery, P. E. Andrews, S. D. Qui, D. L. Bilhartz, D. J. Tindall, (1991) Hormonal regulation of prostate-specific antigen messenger RNA in human prostatic adenocarcinoma cell line LNCaP, Cancer Res, 51(14), 3748-3752. [16] S. D. Qiu, C. Y. Young, D. L. Bilhartz, J. L. Prescott, G. M. Farrow, W. W. He, D. J. Tindall, (1990) In situ hybridiza- tion of prostate-specific antigen mRNA in human prostate,  M.J. Ge et al. / HEALTH 1 (2009) 231-238 SciRes Copyright © 2009 http://www.scirp.org/journal/HEALTH/Openly accessible at 238 J Urol, 144(6), 1550-1556. [17] S. Hosch, J. Kraus, P. Scheunemann, J. R. Izbicki, C. Schneider, U. Schumacher, K. Witter, M. R. Speicher, K. Pantel, (2000) Malignant potential and cytogenetic char- acteristics of occult disseminated tumor cells in eso- phageal cancer, Cancer Res, 60(24), 6836-6840. [18] I. H. Wong, W. Y. Lau, T. Leung, W. Yeo, P. J. Johnson, (1999) Hematogenous dissemination of hepatocytes and tumor cells after surgical resection of hepatocellular carci- noma: a quantitative analysis, Clin Cancer Res, 5(12), 4021-4027. [19] K. Pantel, R. J. Cote, O. Fodstad, (1999) Detection and clinical importance of micrometastatic disease, J Natl Cancer Inst, 91(13), 1113-1124. [20] K. Peck, Y. P. Sher, J. Y. Shih, S. R. Roffler, C. W. Wu, P. C. Yang, (1998) Detection and quantitation of circulating cancer cells in the peripheral blood of lung cancer patients, Cancer Res, 58(13), 2761-2765. |