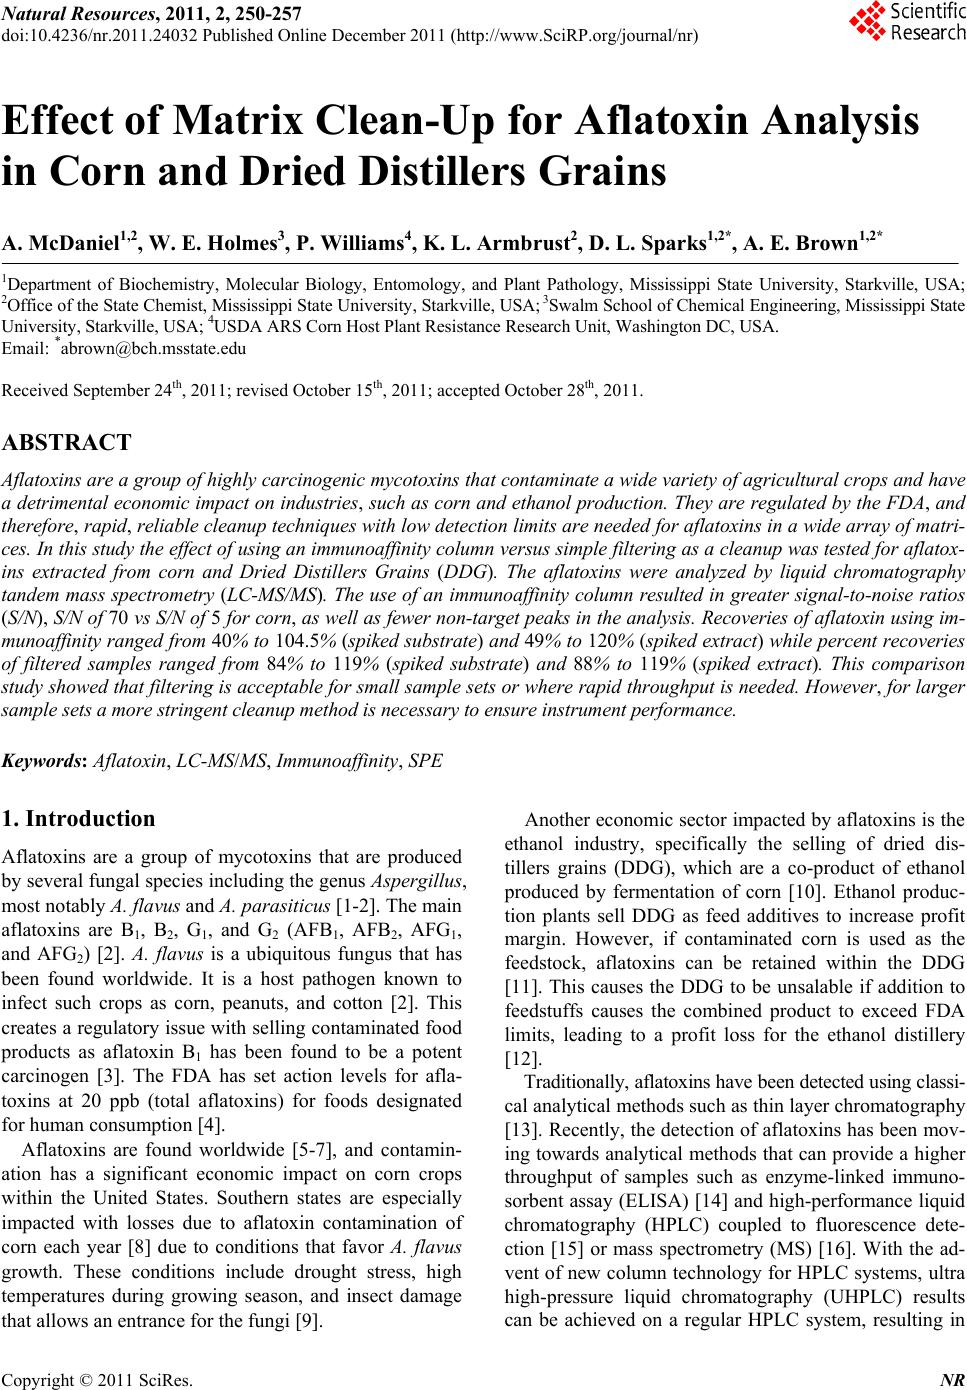
 Natural Resources, 2011, 2, 250-257 doi:10.4236/nr.2011.24032 Published Online December 2011 (http://www.SciRP.org/journal/nr) Copyright © 2011 SciRes. NR Effect of Matrix Clean-Up for Aflatoxin Analysis in Corn and Dried Distillers Grains A. McDaniel1,2, W. E. Holmes3, P. Williams4, K. L. Armbrust2, D. L. Sparks1,2*, A. E. Brown1,2* 1Department of Biochemistry, Molecular Biology, Entomology, and Plant Pathology, Mississippi State University, Starkville, USA; 2Office of the State Chemist, Mississippi State University, Starkville, USA; 3Swalm School of Chemical Engineering, Mississippi State University, Starkville, USA; 4USDA ARS Corn Host Plant Resistance Research Unit, Washington DC, USA. Email: *abrown@bch.msstate.edu Received September 24th, 2011; revised October 15th, 2011; accepted October 28th, 2011. ABSTRACT Aflatoxins are a group of highly carcinogenic mycotoxins that contaminate a wide variety of agricultural crops and have a detrimental econ omic impact on industries, such as corn and ethanol production. They are regulated by the FDA, and therefore, rapid, reliable cleanup techniques with lo w detection limits are need ed for aflato xins in a wide array of matri- ces. In this study the effect of usin g an immunoaffinity colu mn versus simp le filtering as a clea nup was tested for aflato x- ins extracted from corn and Dried Distillers Grains (DDG). The aflatoxins were analyzed by liquid chromatography tandem mass spectrometry (LC-MS/MS). The use of an immunoaffinity column resulted in greater signal-to-noise ratios (S/N), S/N of 70 vs S/N of 5 for corn, as well as fewer non-target peaks in the ana lysis. Recoveries of aflatoxin usin g im- munoaffinity ranged from 40% to 104.5% (spiked substrate) and 49% to 120% (spiked extract) while percent recoveries of filtered samples ranged from 84% to 119 % (spiked substrate) and 88% to 119% (spiked extract). This comparison study showed that filtering is acceptable for small sample sets or where rapid throughput is needed. However, for larger sample sets a more stringent cleanup method is necessary to ens ure instrument performance. Keywords: Aflatoxin, LC-MS/MS, Immunoaffinity, SPE 1. Introduction Aflatoxins are a group of mycotoxins that are produced by several fungal species including the genus Aspergillus, most notably A. flavus and A. parasiticus [1-2]. The main aflatoxins are B1, B2, G1, and G2 (AFB1, AFB2, AFG1, and AFG2) [2]. A. flavus is a ubiquitous fungus that has been found worldwide. It is a host pathogen known to infect such crops as corn, peanuts, and cotton [2]. This creates a regulatory issue with selling contaminated food products as aflatoxin B1 has been found to be a potent carcinogen [3]. The FDA has set action levels for afla- toxins at 20 ppb (total aflatoxins) for foods designated for human consumption [4]. Aflatoxins are found worldwide [5-7], and contamin- ation has a significant economic impact on corn crops within the United States. Southern states are especially impacted with losses due to aflatoxin contamination of corn each year [8] due to conditions that favor A. flavus growth. These conditions include drought stress, high temperatures during growing season, and insect damage that allows an entrance for the fungi [9]. Another economic sector impacted by aflatox ins is the ethanol industry, specifically the selling of dried dis- tillers grains (DDG), which are a co-product of ethanol produced by fermentation of corn [10]. Ethanol produc- tion plants sell DDG as feed additives to increase profit margin. However, if contaminated corn is used as the feedstock, aflatoxins can be retained within the DDG [11]. This causes the DDG to be unsalable if addition to feedstuffs causes the combined product to exceed FDA limits, leading to a profit loss for the ethanol distillery [12]. Traditionally, aflatoxins have been detected using classi- cal analytical methods such as thin layer chromatography [13]. Recently, the detection of aflatoxins has been mov- ing towards analytical methods that can provide a higher throughput of samples such as enzyme-linked immuno- sorbent assay (ELISA) [14] and high-performan ce liquid chromatography (HPLC) coupled to fluorescence dete- ction [15] or mass spectrometry (MS) [16]. With the ad- vent of new column technology for HPLC systems, ultra high-pressure liquid chromatography (UHPLC) results can be achieved on a regular HPLC system, resulting in  Effect of Matrix Clean-Up for Aflatoxin Analysis in Corn and Dried Distillers Grains251 faster analysis time. The use of these analytical methods, however, often requires sample cleanup. Immunoaffinity solid phase extraction (SPE) columns have become po- pular [17], as these columns are capable of greatly mini- mizing background detector noise while also reducing the chance of damaging a HPLC column. When coupled to LC-MS/MS, a sensitive and reliable detection method of aflatoxins is possible. The objective of this investi- gation was to compare the matrix removal capabilities of immunoaffinity SPE columns versus standard filter paper and determine when the use of each cleanup technique is appropriate. 2. Materials 2.1. Standards, Solvents, and Materials Aflatoxin standards (AFB1, AFB2, AFG1, AFG2 and afla- toxin M1 (AFM1); >98% purity) were purchased from Sigma-Aldrich (Saint Louis, MO). Aflatoxin-free corn was obtained from the Mississippi State Chemical Labo- ratory. AflaCLEAN Immunoaffinity SPE columns and PBS buffer were obtained from Pickering Laboratories (Mountain View, CA). Optima grade methanol, acetoni- trile, and water were purchased from Fisher Scientific (Fair Lawn, NJ). DDG were purchased from Sigma Al- drich (St. Louis, MO). Formic acid was purchased from Sigma Aldrich (St. Louis, MO). Whatman filter paper no. 1 was purchased from Fisher Scientific (Fair Lawn, NJ). BD 3 mL Luer-Lok Tip Syringes were purchased from Fisher Scientific (Fair Lawn, NJ). PTFE filters (0.45 m) were purchased from Fischer Scientific (Fair Lawn, NJ). 2.2. LC-MS An Agilent 1100 Liquid Chromatograph system (Santa Clara, CA) with a Phenomenex Kinetex Column (C18 150 4.6 mm i.d. wit h a particle size of 2.6 m and a pore size of 100 Å) was used. Additionally, a HPLC Krud- Katcher Ultra Column In-Line Filter (0.5 m Porosity 0.004 in. ID) purchased from Phenomenex (Torrance, CA) was installed for added system protection. The mass spectrometer used was a Bruker Esquire (Billerica, MA) with an electrospray ionization (ESI) interface and ion trap. 3. Methods 3.1. Stock Solution A stock solution of aflatoxins AFB1, AFB2, AFG1, and AFG2 was prepared at a concentration of 5 ppm and stored at 4˚C. A spiking solution was made from this stock solution by diluting an aliquot of the stock solution to 1 ppm. Spiked substrates were achieved by adding 1 mL of the spiking solution onto 5 g of corn/DDG and adjusting the extraction solvent to a final volume of 25 mL. Sp iked extract s amples were pr epared by addi ng 0.2 mL spiking solution to 4.8 mL extract. A stock internal standard solution of AFM1 was made by diluting an ali- quot of the purchased standard (10 ppm) to 1 ppm and stored at 4˚C. 3.2. Cleanup Techniques Spiked substrate samples (corn or DDG) were extracted using a modified method provided by Pickering Labora- tories, Inc. Ground corn provided by the Mississippi State Chemical Laboratory or DDG were weighed out (5 g) into a 50-mL Falcon centrifuge tube and mixed with 25 mL of the extraction solvent, 80:20 methanol:water (v:v). This mixture was shaken for 15 min before being centrifuged at 3000 RPMs for 10 minutes. Samples were cleaned by either AflaCLEAN SPE or Whatman filter paper. For the AflaCLEAN samples, the extracted super- natant (1.4 mL) was mixed with 8.6 mL of PBS Buffer and passed through the SPE column on a vacuum mani- fold at a flow rate of 1 - 2 drops per second. After col- umn loading, the immunoaffini ty SPE column was washed with 10 mL of water before being eluted with 2 1 mL of methanol. Spiked extract samples were obtained by spiking AFB1, AFB2, AFG1, and AFG2 into the extract of afla- toxin-free corn or DDG. The extracts were obtained ac- cording to the method described above, and collected after centrifugation. The spiked extract (1.4 mL) was mixed with 8.6 mL of PBS Buffer and passed through the AflaCLEAN column as described above. Whatman spiked extract and spiked substrate samples, were gravity filtered using Whatman filter paper # 1. All samples, whether cleaned via SPE or Whatman, were filtered with a 0.45 m PTFE filter prior to LC-MS/MS analysis. PTFE filtering showed no effective aflatoxin loss (data not shown). AFM1 was used as an internal standard at a concentration of 50 ppb. AFM1 was chos en as the internal standard as it is the metabolite of AFB1 found in milk thus, there should be no AFM1 found in these matrices [18]. 3.3. LC-MS/MS Protocol A solvent gradient program was used to maximize the signal-to-noise ratio (sensitivity). Th e solvents used were as follows: Solvent A-water, Solvent B-acetonitrile. Both solvents contained 0.1% formic acid by volume. The gra- dient used was: 0 min - 0.5 min—90% A, 0.51 min —50% A, 2.0 min - 9.0 min—20% A, 9.01 min -10 min —90% A. Mass Spectrometer settings were adjusted so that sensitivity was maximized. The conditions were as follows: Capillary: –4000 V, End Plate Offset: –500 V, Nebulizer: 30 p si, Dry G as: 12 L/min, Dry Temp: 300 ˚C, scan range: 200 - 360 m/z, averages: 3. MS/MS was used Copyright © 2011 SciRes. NR  Effect of Matrix Clean-Up for Aflatoxin Analysis in Corn and Dried Distillers Grains 252 for absolute identification of aflatoxins and to further in- crease sensitivity. This can be seen in Table 1. 3.4. Standard Curves In-matrix standard curves (corn Whatman, DDG What- man, corn SPE, and DDG SPE) were produced with con- centrations at 5, 25, 75, 250, and 500 ppb (3 replicates at each level). Each standard curve had AFM1 added to each point for a final concentration of 50 ppb. Before AFM1 was added, each point in each standard curve was filtered through a 0.45-m PTFE filter. 3.5. Data Analysis Limit of Detection (LOD) was determined by following the guidelines outlined in Code of Federal Regulations, Part 136, Appendix B [19]. LOD calculations were de- termined from a replicate set of n = 7 at a concentration of 5 ppb for each standard curve. Percent recoveries were calculated by dividing the amount of aflatoxin in each sample by aflatoxin amount calculated from spiked ma- trix. Signal-to-noise ratios were calculated by dividing the analyte signal by the background noise signal. Statis- tics were calculated for ANOVA Table ( = 0.05) and statistical difference was determined using least squares means analysis in Statistical Analysis Software (SAS) 9.2. 4. Results Figure 1 shows the chromatographic separation and ana- lysis of AFB1, AFB2, AFG1, and AFG2, and AFM1 (in- ternal standard) at a concentration of 75 ppb (50 ppb AFM1) by LC-MS/MS. While baseline separation was not achieved for the aflatoxins, this was not a concern since this method was designed to be a rapid detection method and each had unique precursor and daughter ions. The elution order for the aflatoxins is (Table 1): AFB1 (3.5 min), AFB2 (3.4 min), AFG1 (3.4 min), and AFG2 (3.2 min), and AFM1 (3.2 min). Limit of Detection (LOD) studies were performed for each of the four aflatoxins. These are instrument LODs and not method LODs. This can be seen in Table 2. LODs for Afla-CLEAN SPE columns (0.53 - 6.47 ppb for corn and 4.37 - 14.36 ppb for DDG) were generally lower than Whatman LODs (5.00 - 21.84 ppb for corn and 4.81 - 20.90 ppb for DDG). The pH was checked for each matrix extract (corn and DDG) and both were found to be in a range from 6.5 to 7.5. This is important because pH can play a role in ion enhancement or suppression in mass spec- trometry. Since the pH was essentially neutral, no ion enhancement or suppression was thought to have oc- curred. Method efficiencies (spiked substrate) were calculated Table 1. MS/MS results for aflatoxins B1, B2, G1, G2, and M1 (internal standard). Aflatoxin Time (min) Precursor m/z Product m/z B1 3.5 313 285.0, 298.0 B2 3.4 315 259.0, 287.0, 29 7.0 G1 3.4 329 243.0, 283.0, 30 1.0, 311.0 G2 3.2 331 285.1, 303.1, 313.1 M1 3.2 329 259.1, 273.1 Table 2. Percent Recoveries for Aflatoxins B1, B2, G1, and G2. B1 B2 G1 G2 Corn Whatman spiked extracta 102 ± 15.4994 ± 0.71 91 ± 7.07 101 ± 2.83 spiked substrateb 110 ± 0.0793 ± 18.38 99 ± 1 8.68 101 ± 2.4 LODc 8.08 21.84 10.56 5.00 DDG Whatman spiked extracta 119 ± 8.49105 ± 18.38 88 ± 43.72 108 ± 23.33 spiked substrateb 90 ± 1.41118 ± 14.14 84 ± 1.4 1 119 ± 10.61 LODc 10.62 20.90 4.81 16.19 Corn Afla-CLEAN spiked extracta 120 ± 21.7874 ± 9.07 108 ± 24.58 54 ± 6.11 spiked substrateb 104.5 ± 7.7867 ± 9.9 88.5 ± 2.12 63 ± 5.66 LODc 4.81 3.11 0.53 6.47 DDG Afla-CLEAN spiked extracta 75 ± 23.9749 ± 11.06 72 ± 27.07 54 ± 31.66 spiked substrateb 74 ± 10.0740 ± 5.86 57 ± 3.00 59 ± 20.22 LODc 7.98 14.36 9.93 4.37 aColumn efficiency, bMethod efficiency, cInstrument Limit of Detection in ppb [19]. from an n = 3 for each aflatoxin (AFB1, AFB2, AFG1, and AFG2) and can be seen in Table 2. These are a measure of how effective the method is from beginning to end of extracting aflatoxins from a particular matrix. They were from 84% to 119% (Whatman) and 40% to 104.5% (AflaCLEAN). Column efficiencies (spiked ex- tract) were calculated from an n = 3 for each aflatoxin and can be seen in Table 2. These are a measure of how effective the column is releasing the aflatoxin s during the elution step. They were from 88% to 119% (Whatman) Copyright © 2011 SciRes. NR  Effect of Matrix Clean-Up for Aflatoxin Analysis in Corn and Dried Distillers Grains Copyright © 2011 SciRes. NR 253 Figure 1. LC-MS/MS analysis of aflatoxin standard. Each aflatoxin (top to bottom: M1, G2, G1, B2, and B1) is at a concentra- tion of 75 ppb (M1 is at 50 ppb). The elution is as follows: M1-3.2 min, G2-3.2 min, G1-3.4 min, B2-3.4 min, B1-3.5 min Scales are different due to each aflatoxin has a different response factor. and 49% to 120% (AflaCLEAN). From the results, it can be seen that corn SPE (spiked extract and spiked sub- strate) have higher percent recoveries (54% to 120%) when compared to DDG SPE spiked extract and spiked substrate (40% to 75%). From the statistical analysis, it was shown that there was a significant difference ( = 0.05) in the percent recoveries (corn and DDG SPE) for AFB1 and AFB2 but not AFG1 and AFG2 for spiked ex- tract and spiked substrate. Statistical analysis for What- man samples (spiked extract and substrate) showed no significant difference for AFG1 and AFG2 and no clear significant difference for AFB1 and AFB2. AFB2 and AFG2 Whatman samples were all significantly different ( = 0.05) from the SPE samples. This comparative study was performed between the capabilities of Whatman filter paper and the AflaCLEAN immunoaffinity SPE column for cleanup of aflatoxins extracted from corn and DDG. Data for this can be seen in Figures 2 and 3. The corn matrix showed higher background noise (approximately 14-fold increase for AFB2) for the Whatman cleanup when compared to the immunoaffinity SPE cleanup. Additionally, for the DDG matrix, higher background noise (approximately 35-fold increase for AFG2) was seen for DDG cleaned with Whatman filter paper versus the immunoaffinity SPE column. Overall, samples cleaned with the immunoaffi- nity SPE column had a higher signal-to-noise ratio (S/N) over Whatman filter paper (S/N of 70 versus S/N of 5 for corn and S/N of 70 versus S/N of 2 for DDG, respec- tively). 5. Discussion While baseline sep aration of the aflatoxins was not ach i- eved, coelution of compounds is acceptable when using tandem mass spectrometry as this technique allows for definitive identification [20,21] and has been used in such fields as proteomics [22], pesticide analysis [23], and forensics [24]. Compounds are detected after being ionized and forming a specific mass-to-charge ratio (m/z). The mass spectrometer is capable of detecting multiple ions simultaneously, which are unique to each analyte. LOD were calculated for how low the instrument can 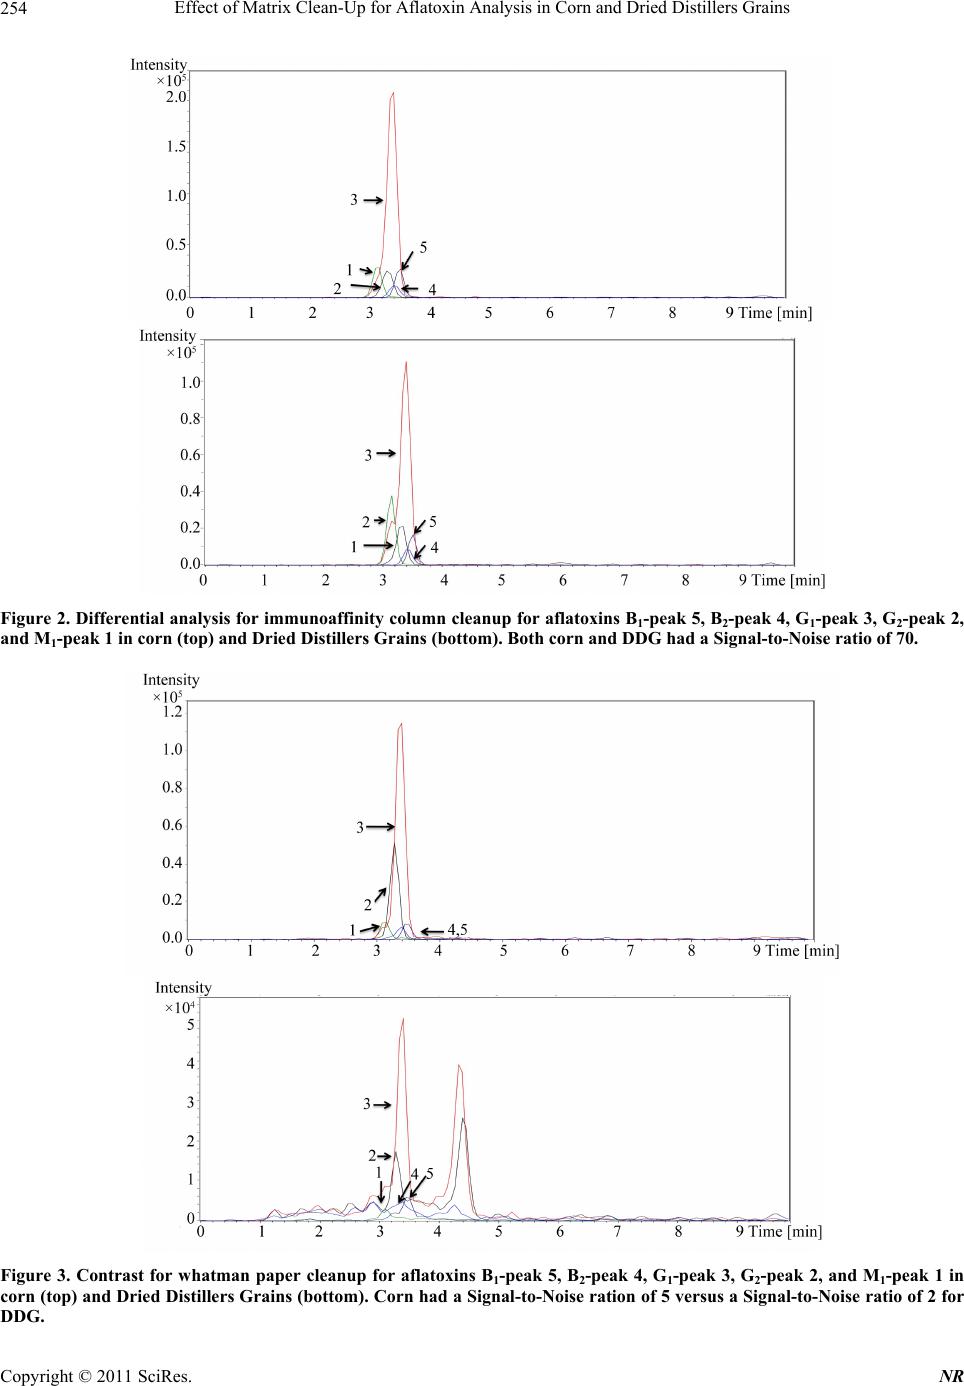 Effect of Matrix Clean-Up for Aflatoxin Analysis in Corn and Dried Distillers Grains 254 Figure 2. Differential analy sis for immunoaffinity column cleanup for aflatoxins B1-peak 5, B2-peak 4, G1-peak 3, G2-peak 2, and M1-peak 1 in corn (top) and Dried Distillers Grains (bottom). Both corn and DDG had a Signal-to-Noise ratio of 70. Figure 3. Contrast for whatman paper cleanup for aflatoxins B1-peak 5, B2-peak 4, G1-peak 3, G2-peak 2, and M1-peak 1 in corn (top) and Dried Distillers Grains (bottom). Corn had a Signal-to-Noise ration of 5 versus a Signal-to-Noise ratio of 2 for DDG. Copyright © 2011 SciRes. NR 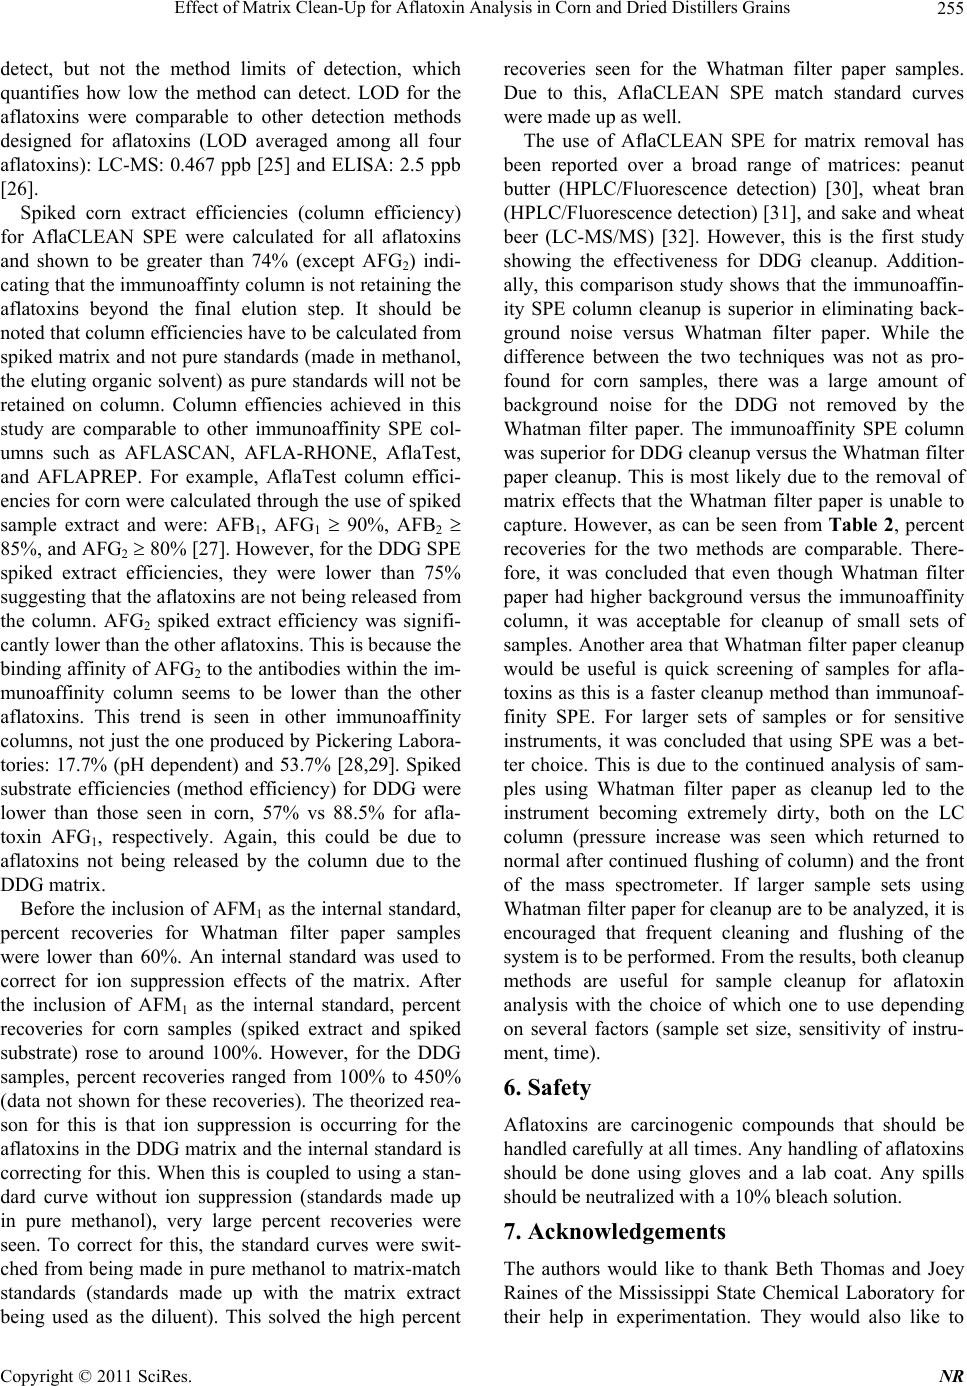 Effect of Matrix Clean-Up for Aflatoxin Analysis in Corn and Dried Distillers Grains255 detect, but not the method limits of detection, which quantifies how low the method can detect. LOD for the aflatoxins were comparable to other detection methods designed for aflatoxins (LOD averaged among all four aflatoxins): LC- MS: 0.467 ppb [25] and ELISA: 2 .5 ppb [26]. Spiked corn extract efficiencies (column efficiency) for AflaCLEAN SPE were calculated for all aflatoxins and shown to be greater than 74% (except AFG2) indi- cating that the immunoaffinty column is not retaining the aflatoxins beyond the final elution step. It should be noted that column efficiencies have to be calculated from spiked matrix and not pure standards (made in methano l, the eluting organic solvent) as p ure standards will not be retained on column. Column effiencies achieved in this study are comparable to other immunoaffinity SPE col- umns such as AFLASCAN, AFLA-RHONE, AflaTest, and AFLAPREP. For example, AflaTest column effici- encies for corn were calculated through the use of spiked sample extract and were: AFB1, AFG1 90%, AFB2 85%, and AFG2 80% [27]. However, for the DDG SPE spiked extract efficiencies, they were lower than 75% suggesting that the aflatoxins are not being released from the column. AFG2 spiked extract efficiency was signifi- cantly lower than the other aflatoxins. This is because the binding affinity of AFG2 to the antibodies within the im- munoaffinity column seems to be lower than the other aflatoxins. This trend is seen in other immunoaffinity columns, not just the one produced by Pickering Labora- tories: 17.7% (pH dependent) and 53.7% [28,29]. Spiked substrate efficiencies (method efficiency) for DDG were lower than those seen in corn, 57% vs 88.5% for afla- toxin AFG1, respectively. Again, this could be due to aflatoxins not being released by the column due to the DDG matrix. Before the inclusion of AFM1 as the internal standard, percent recoveries for Whatman filter paper samples were lower than 60%. An internal standard was used to correct for ion suppression effects of the matrix. After the inclusion of AFM1 as the internal standard, percent recoveries for corn samples (spiked extract and spiked substrate) rose to around 100%. However, for the DDG samples, percent recoveries ranged from 100% to 450% (data not shown for these recoveries). The theorized rea- son for this is that ion suppression is occurring for the aflatoxins in the DDG matrix and the intern al standard is correcting for this. When this is coupled to using a stan- dard curve without ion suppression (standards made up in pure methanol), very large percent recoveries were seen. To correct for this, the standard curves were swit- ched from being made in pure methanol to matrix-match standards (standards made up with the matrix extract being used as the diluent). This solved the high percent recoveries seen for the Whatman filter paper samples. Due to this, AflaCLEAN SPE match standard curves were made up as well. The use of AflaCLEAN SPE for matrix removal has been reported over a broad range of matrices: peanut butter (HPLC/Fluorescence detection) [30], wheat bran (HPLC/Fluorescence detection) [31], and sake and wheat beer (LC-MS/MS) [32]. However, this is the first study showing the effectiveness for DDG cleanup. Addition- ally, this comparison study shows that the immunoaffin- ity SPE column cleanup is superior in eliminating back- ground noise versus Whatman filter paper. While the difference between the two techniques was not as pro- found for corn samples, there was a large amount of background noise for the DDG not removed by the Whatman filter paper. The immunoaffinity SPE column was superior for DDG cleanup versus the Whatman filter paper cleanup. This is most likely due to the removal of matrix effects that the Whatman filter paper is unable to capture. However, as can be seen from Table 2, percent recoveries for the two methods are comparable. There- fore, it was concluded that even though Whatman filter paper had higher background versus the immunoaffinity column, it was acceptable for cleanup of small sets of samples. Another area that Whatman filter paper cleanup would be useful is quick screening of samples for afla- toxins as this is a faster cleanup method than immunoaf- finity SPE. For larger sets of samples or for sensitive instruments, it was concluded that using SPE was a bet- ter choice. This is due to the continued analysis of sam- ples using Whatman filter paper as cleanup led to the instrument becoming extremely dirty, both on the LC column (pressure increase was seen which returned to normal after continued flushing of column) and the front of the mass spectrometer. If larger sample sets using Whatman filter paper for cleanup are to be an alyzed, it is encouraged that frequent cleaning and flushing of the system is to be performed. Fro m the results, bo th cleanup methods are useful for sample cleanup for aflatoxin analysis with the choice of which one to use depending on several factors (sample set size, sensitivity of instru- ment, time). 6. Safety Aflatoxins are carcinogenic compounds that should be handled carefully at all times. Any hand ling of aflatoxins should be done using gloves and a lab coat. Any spills should be neutralized with a 10% bleach solution. 7. Acknowledgements The authors would like to thank Beth Thomas and Joey Raines of the Mississippi State Chemical Laboratory for their help in experimentation. They would also like to Copyright © 2011 SciRes. NR  Effect of Matrix Clean-Up for Aflatoxin Analysis in Corn and Dried Distillers Grains 256 thank the funding agencies that supported this research: USDA, Mississippi Corn Promotion Board, and the Mis- sissippi State Research Initiative. REFERENCES [1] M. A. Klich, “Aspergillus flavus: The Major Producer of Aflatoxin,” Molecular Plant Pathology, Vol. 8, No. 6, 2007, pp. 713-722. doi:10.1111/j.1364-3703.2007.00436.x [2] K. K. Maggon, L. Viswanathan and T. A. Venki-tasubra- manian, “The Chemistry of Aflatoxins,” The Journal of Scientific and Industrial Research, Vol. 29, 1970, pp. 8- 17. [3] K. A. Scheidegger and G. A. Payne, “Unlocking the Se- crets behind Secondary Metabolism: A Review of Asper- gillus flavus from Pathogenicity to Functional Genom- ics,” Journal of Toxicology, Vol. 22, No. 2-3, 2003, pp. 423-459. [4] F. Wu, “Mycotoxin Risk Assessment for the Purpose of Setting International Regulatory Standards,” Environ- mental Science and Technology, Vol. 38, No. 15, 2004, pp. 4049-4055. doi:10.1021/es035353n [5] L. Lewis, M. Onsongo, H. Njapau, H. Schurz-Rogers, G. Luber, S. Kieszak, J. Nyamongo, L. Backer, A. M. Da- hiye, A. Misore, K. DeCock and C. Rubin, “Kenya Afla- toxicosis Investigation Group. Aflatoxin Contamination of Commercial Maize Products during an Outbreak of Acute Aflatoxicosis in Eastern and Central Kenya,” En- vironmental Health Perspectives, Vol. 113, 2005, pp. 1763-1767. doi:10.1289/ehp.7998 [6] Z. Liu, Z. Gao and J. Yu, “Aflatoxins in Stored Maize and Rice Grains in Liaoning Province, China,” Journal of Stored Products Research, Vol. 42, No. 4, 2006, pp. 468- 479. doi:10.1016/j.jspr.2005.09.003 [7] F. Peers, X. Bosch, J. Kaidor, A. Linsell and M. Plujimen, “Aflatoxin Exposure, Hepatitis B Virus Infection and Liver Cancer in Swaziland,” International Journal of Cancer, Vol. 39, No. 5, 1987, pp. 545-553. doi:10.1002/ijc.2910390502 [8] G. Wood, “Mycotoxins in Foods and Feeds in the United States,” Journal of Animal Science, Vol. 70, No. 12, 1992, pp. 3941-3949. [9] M. A. Klich, “Environmental and Developmental Factors Influencing Aflatoxin Production for Aspergillus flavus and Aspergillus parasiticus,” Mycoscience, Vol. 48, No. 2, 2007, pp. 71-80. doi:10.1007/s10267-006-0336-2 [10] J. L. Firkins, L. L. Berger and G. C. Fahey, “Evaluation of Wet and Dry Distillers Grains and Wet and Dry Corn Gluten Feeds for Ruminants,” Journal of Animal Science, Vol. 60, No. 3, 1985, pp. 847-860. [11] E. B. Lillehoj, A. Lagoda and W. F. Maisch, “The Fate of Aflatoxins in Naturally Contaminated Corn during the Ethanol Fermentation,” Canadian Journal of Microbiol- ogy, Vol. 25, No. 8, 1979, pp. 911-914. doi:10.1139/m79-135 [12] K. A. Nelson, P. P. Motavalli and R. L. Smoot, “Utility of Dried Distillers Grains as a Fertilizer Source for Corn,” Journal of Agricultural Science, Vol. 1, No. 1, 2009, pp. 3-12. [13] P. M. Scott, J. W. Lawrence and W. Van Walbeek, “De- tection of Mycotoxins by Thin Layer Chromatography: Application to Screening of Fungal Extracts,” Applied Microbiology, Vol. 20, 1970, pp. 839-842. [14] N. A. Lee, S. W. Wang, R. D. Allan and I. R. Kennedy, “A Rapid Aflatoxin B1 ELISA: Development and Vali- dation with Reduced Matrix Effects for Peanuts, Corn, Pistachio, and Soybeans,” Journal of Agriculture and Food Chemistry, Vol. 52, No. 10, 2004, pp. 2746-2755. doi:10.1021/jf0354038 [15] J. Jaimex, C. A. Fente, B. I. Vazquez, A. Cepeda, G. Mahuzler and P. Prognon, “Application of the Assay of Aflatoxins by Liquid Chromatography with Fluorescence Detection in Food Analysis,” Journal of Chromatography A, Vol. 882, No. 1-2, 2000, pp. 1-10. doi:10.1016/S0021-9673(00)00212-0 [16] M. Vahl and M. Jorgenson, “Determination of Aflatoxins in Food using LC/MS/MS,” European Food Research and Technology, Vol. 206, No. 4, 1998, pp. 243-245. [17] J. Stroka, E. Anklam, U. Jörissen and J. Gilbert, “Immu- noaffinity Column Cleanup with Liquid Chromatography Using Post-Column Bromination for Determination of Aflatoxins in Peanut Butter, Pistachio Paste, Fig Paste, and Paprika Powder: Collaborative Study,” Journal of AOAC International, Vol. 83, No. 2, 2000, pp. 320-340. [18] F. Galvano, V. Galofaro and G. Galvano, “Occurrence and Stability of Aflatoxin M1 in Milk and Milk Products: A Worldwide Review,” Journal of Food Protection, Vol. 59, No. 10, 1996, pp. 1079-1090. [19] Code of Federal Regulations Title 40, Part 136, Appendix B, Guidelines Establishing Test Procedures for the Ana- lysis of Pollutants, U.S. Government Printing Office, Washington, DC, 2009. www.epa.gov/earth1r6/6pd/qa/qadevtools/mod4reference s/analytical_references/40cfr136_03.pdf [20] T. M. Annesley, “Ion Suppression in Mass Spectrome- try,” Clinical Chemistry, Vol. 49, No. 7, 2003, pp. 1041- 1044. doi:10.1373/49.7.1041 [21] K. Biemann, “Contributions of Mass Spectrometry to Peptide and Protein Structure,” Biological Mass Spec- trometry, Vol. 16, No. 1-12, 1988, pp. 99-111. doi:10.1002/bms.1200160119 [22] R. Aebersold and M. Mann, “Mass Spectrometry Based Proteomics,” Nature, Vol. 422, 2003, pp. 198-207. doi:10.1038/nature01511 [23] F. Hernandez, J. V. Sancho and O. J. Pozo, “Critical Re- view of the Application of Liquid Chromatography to the Determination of Pesticide Residues in Biological Sam- ples,” Analytical Bioanalytical Chemistry, Vol. 382, No. 4, 2005, pp. 934-946. doi:10.1007/s00216-005-3185-5 [24] H. H. Maurer, “Liquid Chromatography-Mass Spectro- metry in Forensic and Clinical Toxicology,” Journal of Chromatography B: Biomedical Sciences and Applica- tions, Vol. 713, No. 1, 1998, pp. 3-25. Copyright © 2011 SciRes. NR  Effect of Matrix Clean-Up for Aflatoxin Analysis in Corn and Dried Distillers Grains Copyright © 2011 SciRes. NR 257 doi:10.1016/S0378-4347(97)00514-8 [25] H. S. Chun, H. J. Kim, H. E. Ok, J. Hwang and D. Chung, “Determination of Aflatoxin Levels in Nuts and Their Products Consumed in South Korea,” Food Chemistry, Vol. 102, No. 1, 2007, pp. 385-391. doi:10.1016/j.foodchem.2006.05.031 [26] Z. Zheng, C. W. Humphrey, R. S. King and J. L. Richard, “Validation of an ELISA Test Kit for the Detection of Total Aflatoxins in Grain and Grain Products by Com- parison with HPLC,” Mycopathologia, Vol. 159, No. 2, 2005, pp. 255-263. doi:10.1007/s11046-004-8666-0 [27] H. Z. Senyuva and J. Gilbert, “Immunoaffinity Column Clean-Up Techniques in Food Analysis: A Review,” Journal of Chromatography B, Vol. 878, No. 2, 2010, pp. 115- 132. doi:10.1016/j.jchromb.2009.05.042 [28] S. Ip and C. Che, “Determination of Aflatoxins in Chi- nese Medicinal Herbs by High-Performance Liquid Chro- matography Using Immunoaffinity Column Cleanup: Im- provement of Recovery,” Journal of Chromatography A, Vol. 1135, No. 2, 2006, pp. 241-244. doi:10.1016/j.chroma.2006.10.025 [29] V. A. Vega, “Rapid Extraction of Aflatoxins from Crea- my and Crunchy Peanut Butter,” Journal of AOAC Inter- national, Vol. 88, 2005, pp. 1383-1386. [30] M. Ofitserova, “Analysis of Aflatoxins in Ground Pea- nuts and Peanut Butter by HPLC with Photochemical De- rivatization,” LC/GC North America Supplement, Vol. 46, 2010. [31] M. Muscarella, M. Iammarino, D. Nardiello, S.L. Magro and C. Palermo, “Validation of a Confirmatory Analytical Method for the Determination of Aflatoxins B1, B2, G1, and G2 in Foods and Feed Materials by HPLC with On-Line Photochemical Derivatization and Fluorescence Detection,” Food Addicitves & Contaminants: Part A, Vol. 26, No. 10, 2009, pp. 1402-1410. doi:10.1080/02652030903107906 [32] M. Rudranhatia, “A Rapid LC/MS/MS Method for the Analysis of Aflatoxins in Complex Matrixes with Immu- noaffinity Clean-Up,” Application Note 00927, Varian, Inc. Palo Alto.
|