 American Journal of Anal yt ical Chemistry, 2011, 2, 863-870 doi:10.4236/ajac.2011.28099 Published Online December 2011 (http://www.SciRP.org/journal/ajac) Copyright © 2011 SciRes. AJAC Optimization of Analytical Conditions to Determine Steroids and Pharmaceuticals Drugs in Water Samples Using Solid Phase-Extraction and HPLC Ramiro Vallejo-Rodríguez1, Alberto Lopez-Lopez1, Hugo Saldarriaga-Noreña2, Mario Murillo-Tovar1, Leonel Hernández-Mena1 1Centro de Investigación y Asistencia en Tecnología y Diseño del Estado de Jalisco (CIATEJ); Normalistas 800, Colinas de la Normal, Guadalajara, México 2Facultad de Ciencias Químicas, Universidad Autónoma de Coahuila, República Ote., Saltillo, México E-mail: alopez103@yahoo.com; allopez@ciatej.net.mx Received August 22, 2011; revised October 4, 2011; accepted October 18, 2011 Abstract Two reliable methods were optimized to determine two steroids (17 -Estradiol and 17 -Ethinylestradiol) and two pharmaceutical drugs (ibuprofen and naproxen) using Solid-Phase Extraction (SPE) for sample preparation and High Performance Liquid Chromatography (HPLC) for analysis. SPE (C18) conditions were evaluated varying elution solvent volume, pH conditions and sample mass in the cartridge and reduction techniques of the extract. The efficiency of the analytical methods was evaluated by spiking ultrapure water samples with compounds at three and four levels of concentration for steroids and pharmaceutical drugs, re- spectively. The recoveries were independent (P > 0.05) of added mass of target analytes with a repeatability lower than 6.5% for steroids and 12.1% for pharmaceutical compounds. The recovery factor (coefficient of variation, CV) was higher than 83% for steroids (CV < 3.8%) and >93% for pharmaceuticals (CV < 5.2%). The optimized analytical method was applied for the evaluation of a steroid degradation test using ozone, finding that the estimated limit of detection is sufficient to determine the residual mass (μg·L–1) of 17β-Estradiol after the experiment. Keywords: Steroids, Pharmaceuticals Drugs, Solid-Phase Extraction, HPLC-DAD 1. Introduction The ever increasing use of synthetic steroids and phar- maceutical products both in humans as well as in ani- mals is becoming a new environmental issue to such an extent that the interest in collecting information regarding the origin of these substances in the envi- ronment and their possible effects on humans and ecological systems has increased [1,2]. So far, the generalized use of oral contraceptives formulated with steroids capable of inducing estrogenic responses in fishes at low concentrations such as 1 μg·L–1 has raised concern among the scientific community due to the potentially dangerous conesquences on aquatic media [3,4]. The environment, specifically aquatic, presents di- verse pathways for contamination by pharmaceuticals and steroids. Such compounds enter the sewage sys- tem through urine and feces and finally end up in wastewater treatment plants (WWTPs) or are dis- charged directly into bodies of surface water. The uses of residual sludge from WWTPs that contain estrogens in agriculture are another source of contamination in surface waters through run-offs [5,6]. Also, the WWTPs’ effluents that originate from the pharmaceu- tical industry are an important source responsible for pharmaceuticals present in the environment [7]. The low efficiencies of the WWTPs to degrade two classes of compounds due to their persistence and also efflu- ents discharged from urban and industrial sources without any previous treatment result in the presence of natural and synthetic estrogens in bodies of sur- face water [6,8]. Pharmaceutical drugs occurring in wastewaters or  R. VALLEJO-RODRÍGUEZ ET AL. 864 WWTP effluents have been reported in several research papers in concentration levels of μg·L–1 for naproxen and ibuprofen [9,10]. For steroids, specifically natural ones and the synthetic steroids considered to be the most powerful estrogenic compounds, several studies have also reported very low environmental concentrations on the order of μg·L–1 [11-13]. Since these substances rep- resent a potential danger for human health and because of their environmental levels, it is important to monitor both pharmaceuticals as well as steroids in water. There- fore, robust and reliable analytical methods are required which will allow estimating the presence of such com- pounds in water samples [10,14,15]. Although several authors have determined steroid concentration in water by using gas chromatography coupled with mass spec- trometry (GC-MS), using solid-phase extraction as sam- ple preparation method [16,17], HPLC coupled to mass spectrometry (HPLC-MS) has also been used by other authors [11,18-20]. It is important to highlight that these techniques are robust, but at the same time costly, which does not allow many laboratories to acquire such infrastructure to develop similar methodologies. Con- sidering the fact that most of them have High-Perfor- mance Liquid Chromatographs with Diode-Array De- tection (HPLC-DAD), the implementation of analytical methods to determine pharmaceuticals and steroids in water by using this available analytical infrastructure is then justified. Before chromatography gas or liquid analysis, sample preparation techniques must be care- fully selected and optimized because the low concen- tration of steroids and pharmaceutical drugs [14] can make the detection difficult in environmental samples but the determination is becoming even more challeng- ing when target analytes are degraded and then their concentration are as low that analytical signal become undetectable reliably in treated effluent. The solid- phase extraction (SPE) is one of the alternatives more frequently used with this purpose [21], since it isolates the analytes from liquid sample and then these are con- centrated [28]. In spite of there are so many reports on the analysis of steroids and pharmaceutically drugs [7,10,11,14], these are more as a guide or alternative method, therefore their conditions still must be op- timized before be applied on samples and a step imple- mentation and evaluation of quality analytical parame- ters in laboratory is necessary. The objective of this work was the optimization of analytical conditions for the extraction and determination of two steroids and two pharmaceutical compounds by SPE and subsequent analysis by HPLC-DAD, in water ultrapure samples, with the aim to evaluate the efficiency of their chemical degradation by using ozone processes. 2. Material and Methods 2.1. Chemicals and Materials The compounds utilized in this work were selected ac- cording to their commercial demand, frequency of use, and presence in bodies of water. These were two ster- oids: one natural, 17β-Estradiol (E2), and one synthetic, 17α-Ethinylestradiol (EE2) [12,13]; and two anti-infla- mmatory pharmaceuticals, naproxen and ibuprofen [9, 10,15]. The standards of compounds (purity in paren- theses) of E2 (98%), EE2 (98%), naproxen and ibupro- fen (98%), were purchased as powders from Sigma- Aldrich (St. Louis, MO). The stock standard and further working solutions were prepared in methanol. The sol- vents, HPLC grade, were obtained as follows: acetoni- trile (ACN) was from Tedia (Fairfield, OH), methanol (MeOH) from J.T. Baker (Phillipsburg, NJ), ethyl ace- tate from Burdick & Jackson (Muskego, MI), and ul- trapure water was obtained directly in our laboratory from an ultrapure water system (Nanopure, Barnestead). The packed syringe barrel with 500 mg of C18 Strata (dp 55 μm) SPE was acquired from Phenomenex (Tor- rance, CA). The potassium phosphate monobasic (KH2PO4) with 99% purity was acquired from Sigma (St. Louis, MO). 2.2. Preparation of Samples and Standard Solution Stock The samples were prepared by spiking ultrapure water with a known amount of the selected compounds. The optimization and adjustment of conditions procedure were carried out at only one concentration level, while evaluation of method was done at different levels; three for steroids and four for pharmaceuticals compounds, which were based on the levels reported in the literature [14,15]. Although, only one type of stationary phase was used, the samples spiked with steroids and pharmaceuti- cals were processed separately because these compounds have different chemical properties. The standard stock solution of 17β-Estradiol (E2) and 17α-Ethinylestradiol (EE2) (2500 µg·mL–1) was prepared by dissolving 125 mg of both compounds in 50 mL of methanol in a volu- metric flask. The working standard solution (0.5 - 50 µg·mL–1) was prepared by diluting the stock solution with methanol. For naproxen and ibuprofen (500 µg·mL–1) the stock solution was prepared by dissolving 25 mg of both compounds. The working standard solu- tions for naproxen (0.1 - 5.0 µg·mL–1) and ibuprofen (1.0 - 250 µg·mL–1) were prepared from the stock solutions with methanol. Copyright © 2011 SciRes. AJAC  R. VALLEJO-RODRÍGUEZ ET AL.865 2.3. Optimization and Evaluation of Analytical Procedure 2.3.1. Conditioning of Solid Phase The C18 cartridges were conditioned before the extraction step using methanol, ethyl acetate, acetonitrile and water. For each kind of compound a different sequence was used. For steroids extraction, conditioning was done by passing 8 mL of acetonitrile through of the phase, then 7 mL of methanol and finally 5 mL of water. For the pharmaceuticals, 3 mL of ethyl acetate, and then 3 mL of methanol and 3 mL of water were used. Both sequence of solvents were based on previous work [14,15], respec- tively. 2.3.2. Efficiency of the Eluting and Volume Solvent The capacity and the effectiveness of elution solvent from the C18 cartridge were tested by using the selected solvents. In separate experiments, both solvents were spiked with known amounts of the compounds and were passed by gravity through a column that was precondi- tioned. Later, seven aliquots of 2 mL were collected and then analyzed separately to know total recovery and volume necessary for the elution step. For steroids a so- lution of 5 mg·L–1 was used and for pharmaceuticals so- lutions of 8.3 mg·L–1 (naproxen) and 83.3 mg·L–1 (ibu- profen) were used. The amounts of compounds that were selected were based on environmental levels previously reported [14,15]. 2.3.3. Solid Phase Extraction Conditions The spiked ultrapure water samples were passed through the conditioned cartridges placed in a Manifold Varian VAC ELUT-20, which was connected to a vacuum pump with a pressure and vacuum controller. For steroids the flow rate was 3.5 mL·min–1 and a vacuum pressure of 3 in Hg, while for the pharmaceuticals these were 4.2 mL·min–1 and 4.5 in Hg. Before the elution step, the car- tridges were dried under vacuum (5 in Hg) for approxi- mately twenty minutes to remove all water because these molecules could make the elution defaulted and yield low recoveries of compound from the stationary phase. The elution of the steroids was done with two aliquots (5 mL) of ACN and for pharmaceuticals it was carried out with three aliquots (1 mL) of ethyl acetate and combined in an amber bottle. 2.3.4. Effect of the pH on the Solid Phase Extraction of Pharmaceutical Compounds The efficiency of extraction for the pharmaceuticals was evaluated at neutral (pH = 7.0) and at acid conditions (pH = 4.5) with the objective to know the effect on re- covery. Both pH of the water sample and that used for conditioning of the stationary phase was fixed with a buffer solution (KH2PO4 50 mM). 2.3.5. Efficiency of the Reduction Technique Two different methods were used to evaluate the effi- ciency of the reduction technique. One method consisted of subjecting the extracts to a gentle stream of chroma- tographic nitrogen gas and for the other the extracts were reduced using a Büchi R-210 rotary evaporator (30 rpm) at 40˚C, with vacuum pressure (5 in Hg). All reduced extracts were adjusted to 1 mL. 2.4. Evaluation of the Optimized Analytical Con- ditions To check recoveries, linearity, precision and limit of de- tection (LOD) of the optimized methods, known amounts of each compound at three different concentration levels were added to ultrapure water (1 L). Therefore, three concentra- tions levels were used for both steroids (12.5, 25, 50 µg·mL–1), and fourth levels for naproxen (2.5, 6.25, 12.5, 25 µg·mL–1) and ibuprofen (25, 62.5, 125, 250 µg·mL–1). Each spiked level was assayed in duplicate using optimized con- ditions in each step of the analytical method. 2.5. Chromatography Analysis 2.5.1. Apparatus and Conditions The determination for all compounds was performed on HPLC-DAD Varian ProStar 7725 equipped with Varian ProStar 230 DAD detector. Varian (Galaxy 1.9.3.2) soft- ware was used to record the chromatograms and to cal- culate the chromatographic parameters. The mobile phase for steroids separation was prepared by mixing acetonitrile and ultrapure water in a gradient elution. For pharmaceuticals, this was prepared by mixing methanol and 50 mM potassium dihydrogen phosphate buffer. The mobile phases were filtered trough 0.45 µm nylon filters (Millipore) and degassed before use. The chroma- tographic separations were performed using LiChrospher 100 RP-18, 5 µm, 250 mm × 4.6 mm i.d. column (Agilent Technologies, Waldbronn, Germany) for all compounds, eluted with the mobile phase at the flow rate of 1.0 mL·min–1. The measurements were made with an injec- tion volume of 100 µL for steroids and 20 µL for phar- maceuticals. The detection was carried out with a Varian ProStar 230 (Walnut Creek, CA); diode-array detector (DAD); using the maximum wave-length (λmax) of 197 nm for steroids and 220 and 230 nm for ibuprofen and naproxen, respectively (Figure 1). 2.5.2. Linearity The linearity of the HPLC-DAD analysis was checked \ Copyright © 2011 SciRes. AJAC  R. VALLEJO-RODRÍGUEZ ET AL. Copyright © 2011 SciRes. AJAC 866 50454035302520151050 1,000 800 600 400 200 0 min mAU 17-Ethynilestradio l 17-Estradiol a) HO OH OH HO OH OH Elution gradient Time (min) % A% B 01090 50 100 0 52 100 0 (a) b) naproxeno ibuprofeno 454035302520151050 600 400 200 0 min mAU CH 3 O OH O CH 3 COOH CH 3 H 3 C Naproxene Ibuprophen Elutiongradient Time (min) % A% B% C 00 1585 4.50 1585 12.5 20080 18 25 075 27 45 055 45 45 055 b) Ibuprofen Naproxen (b) Figure 1. Chromatograms obtained by HPLC analysis of two standard mixtures of a) 50 μg·mL–1 of E2 and EE2 eluted with A: acetonitrile and B: ultrapure water (18 MΩ); and b) 25 μg·mL–1 of naproxen and 250 μg·mL–1of ibuprofen elute with A: acetonitrile, B: methanol and C: Buffer solution 50 mM KH2PO4. by analyzing seven solutions in the range of 1.0 - 50 µg·mL–1 for steroids and 0.5 - 50 µg·mL–1 and 0.5 - 250 µg·mL–1 for naproxen and ibuprofen, respectively. Each concentration was analyzed in triplicate. Calibration curves for each compound were generated by plotting the analyte peak area against theoretical concentration of the analytes. The linear regression coefficient (r) for each compound were higher than 0.999. 2.5.3. Limits of Detection and Quantification Limits of detection (LOD) and quantification (LOQ) were determined in accordance with Mitra [28]. The LODs were 0.65 μg·mL–1 and 0.57 μg·mL–1 for EE2 and E2, respectively, and LOQ values for EE2 and E2 were 2.16 µg·mL–1 and 1.89 µg·mL–1, respectively. Similarly, for pharmaceutical compounds the LODs were 0.20 μg·mL–1 (naproxen) and 0.89 μg·mL–1 (ibuprofen) and LOQs were 0.65 μg·mL–1 (naproxen) 2.97 μg·mL–1 (ibu- profen), respectively. 2.5.4. Specificity The specificity was evaluated for interference at the re- tention times of E2, EE2, naproxen and ibuprofen. Lack of interfering peaks in the spiked water sample with all compounds at the retention times of the four compounds was taken as an indication of the specificity of the meth- ods (Figure 1). 2.6. Application of Method The analytical method was applied to evaluate the effi- ciency of degradation of E2 by using ozone. The tests were carried out in batch reactors adapted with 100 mL flasks, in analyte concentrations prepared in ultrapure water of 0.7 μM with ozone doses of 1.3 μM from stock solutions. The assays were carried out in triplicate at pH = 6.0 and temperature (21˚C) [23]. The ozone was gener- ated by a Pacific Ozone G11 ozone generator (Benicia, California, USA) and ultrapure water saturation by bub- bling into a Pyrex glass reactor of 2 L per batch at 20˚C and pH = 6, obtaining stock solutions saturated with ozone, 10 mg·L–1 (0.20 mM). Ozone concentrations and residual ozone were measured using the indigo colori- metric method [24]. One aliquot from stock solution (500 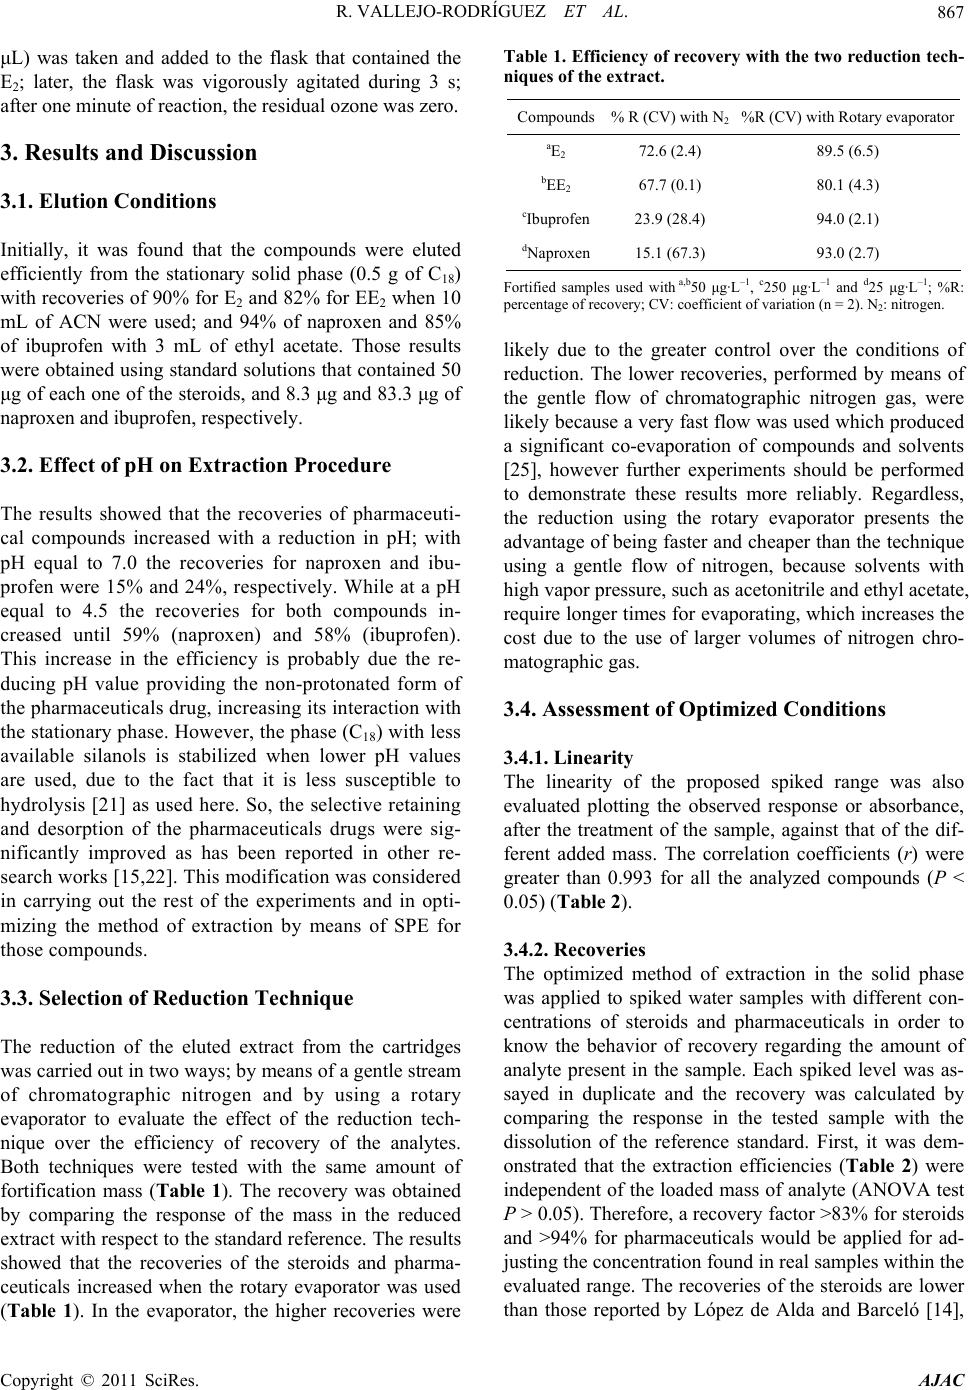 R. VALLEJO-RODRÍGUEZ ET AL.867 μL) was taken and added to the flask that contained the E2; later, the flask was vigorously agitated during 3 s; after one minute of reaction, the residual ozone was zero. 3. Results and Discussion 3.1. Elution Conditions Initially, it was found that the compounds were eluted efficiently from the stationary solid phase (0.5 g of C18) with recoveries of 90% for E2 and 82% for EE2 when 10 mL of ACN were used; and 94% of naproxen and 85% of ibuprofen with 3 mL of ethyl acetate. Those results were obtained using standard solutions that contained 50 μg of each one of the steroids, and 8.3 μg and 83.3 μg of naproxen and ibuprofen, respectively. 3.2. Effect of pH on Extraction Procedure The results showed that the recoveries of pharmaceuti- cal compounds increased with a reduction in pH; with pH equal to 7.0 the recoveries for naproxen and ibu- profen were 15% and 24%, respectively. While at a pH equal to 4.5 the recoveries for both compounds in- creased until 59% (naproxen) and 58% (ibuprofen). This increase in the efficiency is probably due the re- ducing pH value providing the non-protonated form of the pharmaceuticals drug, increasing its interaction with the stationary phase. However, the phase (C18) with less available silanols is stabilized when lower pH values are used, due to the fact that it is less susceptible to hydrolysis [21] as used here. So, the selective retaining and desorption of the pharmaceuticals drugs were sig- nificantly improved as has been reported in other re- search works [15,22]. This modification was considered in carrying out the rest of the experiments and in opti- mizing the method of extraction by means of SPE for those compounds. 3.3. Selection of Reduction Technique The reduction of the eluted extract from the cartridges was carried out in two ways; by means of a gentle stream of chromatographic nitrogen and by using a rotary evaporator to evaluate the effect of the reduction tech- nique over the efficiency of recovery of the analytes. Both techniques were tested with the same amount of fortification mass (Table 1). The recovery was obtained by comparing the response of the mass in the reduced extract with respect to the standard reference. The results showed that the recoveries of the steroids and pharma- ceuticals increased when the rotary evaporator was used (Table 1). In the evaporator, the higher recoveries were Table 1. Efficiency of recovery with the two reduction tech- niques of the extract. Compounds% R (CV) with N2 %R (CV) with Rotary evaporator aE2 72.6 (2.4) 89.5 (6.5) bEE2 67.7 (0.1) 80.1 (4.3) cIbuprofen23.9 (28.4) 94.0 (2.1) dNaproxen15.1 (67.3) 93.0 (2.7) Fortified samples used with a,b50 μg· L–1 , c250 μg·L–1 and d25 μg·L–1; %R: percentage of recovery; CV: coefficient of variation (n = 2). N2: nitrogen. likely due to the greater control over the conditions of reduction. The lower recoveries, performed by means of the gentle flow of chromatographic nitrogen gas, were likely because a very fast flow was used which produced a significant co-evaporation of compounds and solvents [25], however further experiments should be performed to demonstrate these results more reliably. Regardless, the reduction using the rotary evaporator presents the advantage of being faster and cheaper than the technique using a gentle flow of nitrogen, because solvents with high vapor pressure, such as acetonitrile and ethyl acetate, require longer times for evaporating, which increases the cost due to the use of larger volumes of nitrogen chro- matographic gas. 3.4. Assessment of Optimized Conditions 3.4.1. Linearity The linearity of the proposed spiked range was also evaluated plotting the observed response or absorbance, after the treatment of the sample, against that of the dif- ferent added mass. The correlation coefficients (r) were greater than 0.993 for all the analyzed compounds (P < 0.05) (Table 2). 3.4.2. Recoveries The optimized method of extraction in the solid phase was applied to spiked water samples with different con- centrations of steroids and pharmaceuticals in order to know the behavior of recovery regarding the amount of analyte present in the sample. Each spiked level was as- sayed in duplicate and the recovery was calculated by comparing the response in the tested sample with the dissolution of the reference standard. First, it was dem- onstrated that the extraction efficiencies (Table 2) were independent of the loaded mass of analyte (ANOVA test P > 0.05). Therefore, a recovery factor >83% for steroids and >94% for pharmaceuticals would be applied for ad- justing the concentration found in real samples within the evaluated range. The recoveries of the steroids are lower than those reported by López de Alda and Barceló [14], Copyright © 2011 SciRes. AJAC  R. VALLEJO-RODRÍGUEZ ET AL. Copyright © 2011 SciRes. AJAC 868 while for pharmaceuticals, they are in accordance with the average recoveries reported by Santos et al. [15] (98% naproxen and 89% ibuprofen). Both are satisfacy since the variations introduced by each one of the stages are considered during the treatment of the sample. 3.4.3. Precision This parameter for quality of the method was represented by the coefficient of variation (CV) and it was evaluated as repeatability for each level tested and as reproducibil- ity throughout the levels (n = 6 and 8). For steroids the reproducibility obtained was 3.8% (E2) and 3.3% (EE2), while for the pharmaceuticals the values were 5.2% (ibuprofen) and 3.2% (naproxen) (Table 2). 3.4.4. Limits of Detection and Quantification of Method Limits of detection (LOD) and quantification (LOQ) of method were determined in accordance with Mitra [28] and considering each step of samples preparation (ex- traction, elution, reduction). The LODs for steroids were 1.24 μg· L–1 (EE2) and 4.21 μg·L–1 (E2) and LOQS were 4.13 μg·L–1 (EE2) and 14.04 μg·L–1 (E2). Similarly, for pharmaceutical compounds the LODs were 18.6 μg·L–1 (naproxen) and 1.48 μg·L–1 (ibuprofen) and LOQs were 62.7 μg·L–1 (naproxen) 4.93 μg·L–1 (ibuprofen), respec- tively. 3.5. Degradation Efficiency of Steroid The residual concentration was compared to the initial one and it was used to determine the efficiency of deg- radation of the E2. The results (Table 3) indicate that the process degrades more than 98% of the steroid, which are similar results to those reported by Huber et al. [23], Deborde et al. [26], and Guedes-Maniero et al. [27]. Also, it was found that the determination of the residual mass (6.72 to 17.8 μg) of the steroid in the treated sam- ple (1 L) was favored by the application of the method under optimal conditions, due fundamentally to the fact that the extraction and concentration stages facilitated obtaining the compound at levels that are above the limit of detection method (1.24 μg·L–1), contrary to the case where it would have been directly injected. Besides, the high efficiency of the method of extraction and the cor- rection of the final result by the recovery of the method provide higher reliability for the determination, since in lower recoveries the probability of identifying and quan- tifying the compound could diminish especially if it is found in lower concentrations and in environmental samples, where there are more interferences. Table 2. Extraction efficiency of steroids and pharmaceuticals at different fortification levels under optimized conditions and linear regression obtained to estimate the recovery factors. Steroids Pharmaceuticals E 2 EE2 Ibuprofen Naproxen (μg·L–1) %R (CV) %R (CV) (μg·L–1) %R (CV) (μg·L–1) %R (CV) 12.5 82.0 (4.1) 90.1 (4.6) 25 88.0 (2.4) 2.5 72.9 (5.2) 25 89.1 (0.8) 91.2 (1.0) 62.5 95.3 (12.1) 6.25 102.3 (4.5) 50 89.5 (6.5) 80.1 (4.3) 125 85.0 (3.4) 12.5 82.4 (1.0) 250 94.0 (2.7) 25 93.0 (2.1) r 0.999 0.996 r 0.993 0.997 m ± sd 0.969 ± 0.010 0.832 ± 0.032 m ± sd 0.932 ± 0.042 0.938 ± 0.026 b ± sd –54.6 ± 7.7 22.2 ± 18.1 b –2.7 ± 4.5 –1.1 ± 1.4 %R: recovery percentage, CV: coefficient of variation (n=2), r: correlation coefficient, m: slope or recovery factor, sd: standard desviation, b:intercept. Table 3. Results of the degradation of steroid E2 to evaluate the recovery applying the analytical method. Experiment [E2]a, final (μg·L–1)b,c Degradation (%) CV (%) Total CV (%) 1 6.72 96.6 12.9 4.7 2 17.84 91.1 1.1 a[E 2] initial = 200 μg·L–1; bcorrected by recovery factor, 93%; and cconcentration factor, 10/1000.  R. VALLEJO-RODRÍGUEZ ET AL. Copyright © 2011 SciRes. AJAC 869 4. Conclusions Finally, two efficient and reliable methods were opti- mized and applied for the determination of two steroids and two pharmaceuticals in water samples by SPE and HPLC-DAD analysis. The recoveries obtained after sample treatment were 83 % (EE2) and 97 % (E2) for the steroids and 93 % (ibuprofen) and 94 % (naproxen) for pharmaceuticals. The estimated detection limits suggested that it is pos- sible to treat similar concentrations to that of environ- mental samples (μg·L–1), with recoveries that do not de- pend on the amount of compounds into the mass levels assayed. Therefore, the SPE procedure ensures that lower concentrations of steroids and pharmaceuticals are de- tected, which is important because it facilitates reaching the detection levels provided by the HPLC-DAD. These methods are presented as an accessible alternative, sim- ple and economic, since the cost of reactants and materi- als is lower than those of GCMS techniques and the availability of the chemical analysis systems is actually possible in most of the research laboratories. Addition- ally, the applicability of the analytical methods for the determination of residual mass of steroids after a degra- dation treatment with ozone was demonstrated. 5. Acknowledgements The authors would like to thank CONACYT (Consejo Nacional de Ciencia y Tecnología) for the financial aid granted during this research (Project: CONACYT- CB-84425). Thanks also to Sandra Bravo (CIATEJ) for the technical support. 6. References [1] EEA (European Environment Agency), “Pharmaceuticals in the Environment: Results of an EEA Workshop,” Technical Report No. 1/2010 ISSN 1725-2237, EEA, Copenhagen, 2010. [2] K. Kümmerer, “Pharmaceuticals in the Environment: Sources, Fate, Effects and Risks,” Environmental Science and Pollution Research, Vol. 17, No.2, 2010, pp. 519- 521. [3] K. Fent, A. A. Weston and D. Caminada, “Ecotoxicology of Human Pharmaceuticals,” Aquatic Toxicology, Vol. 76, No. 2, 2006, pp. 122-159. doi:10.1016/j.aquatox.2005.09.009 [4] A. M. Vajda, L. B. Barber, J. L. Gray, E. M. López, J. D. Woodling and D. O. Norris, “Reproductive Disruption in Fish Downstream from an Estrogenic Wastewater Efflu- ent,” Environmental Science & Technology, Vol. 42, No, 9, 2008, pp. 3407-3414. doi:10.1021/es0720661 [5] F. X. M. Casey, G. Larsen, H. Hakk and J. Simunek, “Fate and Transport of 17β-Estradiol in Soil-Water Sys- tems,” Environmental Science & Technology, Vol. 37, No, 11, 2003, pp. 2400-2409. doi:10.1021/es026153z [6] R. L. Gomes, M. D. Scrimshaw, E. Cartmell and J. N. Lester, “The Fate of Steroid Estrogens: Partitioning dur- ing Wastewater Treatment and onto River Sediments,” Environmental Monitoring and Assessment, Vol. 175, No. 1, 2011, pp. 431-441. [7] I. Rodríguez, J. B. Quintana, J. Carpinteiro, A. M. Carro, R. A. Lorenzo and R. Cela, “Determination of Acidic Drugs in Sewage Water by Gas Chromatography―Mass Spectrometry as Tert-Butyldimethylsilyl Derivatives,” Journal of Chromatography A, Vol. 985, No. 1-2, 2003, pp. 265-274. [8] X. Peng, Y. Yu, C. Tang, J. Tan, Q. Huang, Z. Wang, “Occurrence of Steroid Estrogens, Endocrine-Disrupting Phenols, and Acid Pharmaceutical Residues in Urban Riverine Water of the Pearl River Delta, South China,” Science of the Total Environment, Vol. 397, No. 1-3, 2008, pp. 158-166. doi:10.1016/j.scitotenv.2008.02.059 [9] J. Radjenović, M. Petrović and D. Barceló, “Fate and Distribution of Pharmaceuticals in Wastewater and Sew- age Sludge of the Conventional Activated Sludge (CAS) and Advanced Membrane Bioreactor (MBR) Treatment,” Water Research, Vol. 43, No. 3, 2009, pp. 831-841. doi:10.1016/j.watres.2008.11.043 [10] V. G. Samaras, N. S. Thomaidis, A. S. Stasinakis, G. Gatidou and T. D. Lekkas, “Determination of Selected Non-Steroidal Anti-Inflammatory Drugs in Wastewater by Gas Chromatography―Mass Spectrometry,” Interna- tional Journal of Environmental Analytical Chemistry, Vol. 90, No. 3-6, 2010, pp. 219-229. doi:10.1080/03067310903243936 [11] C. Y. Chen, T. Y. Wen, G. S. Wang, H. W. Cheng, Y. H. Lin and G. W. Lien, “Determining Estrogenic Steroids in Taipei Waters and Removal in Drinking Water Treatment Using High-Flow Solid-Phase Extraction and Liquid Chr- omatography/Tandem Mass Spectrometry,” Science of the Total Environment, Vol. 378, No. 3, 2007, pp. 352- 365. doi:10.1016/j.scitotenv.2007.02.038 [12] A. J. Jafari, R. Pourkabireh-Abasabad and A. Salehzadeh, “Endocrine Disrupting Contaminants in Water Resources and Sewage in Hamadan City of Iran, Iran,” Journal of Environmental Health Science & Engineering, Vol. 6, No. 2, 2009, pp. 89-96. [13] M. J. Benotti, B. D. Stanford and S. A. Snyder, “Impact of Drought on Wastewater Contaminants in an Urban Water Supply,” Journal of Environmental Quality, Vol. 39, No. 4, 2010, pp. 1196-1200. doi:10.2134/jeq2009.0072 [14] M. J. López de Alda and D. Barceló, “Determination of Steroid Sex Hormones and Related Synthetic Compounds Considered as Endocrine Disrupters in Water by Liquid Chromatography-Diode Array Detection―Mass Spec- trometry,” Journal of Chromatography A, Vol. 892, No. 1-2, 2000, pp. 391-406. [15] J. L. Santos, I. Aparicio, E. Alonso and M. Callejón, “Simultaneous Determination of Pharmaceutically Active Compounds in Wastewater Samples by Solid Phase Ex-  R. VALLEJO-RODRÍGUEZ ET AL. 870 traction and High-Performance Liquid Chromatography with Diode Array and Fluorescence Detectors,” Analytica Chimica Acta, Vol. 550, No. 1-2, 2005, pp. 116-122. doi:10.1016/j.aca.2005.06.064 [16] R. Gibson, E. Becerril-Bravo, V. Silva-Castro and B. Jiménez, “Determination of Acidic Pharmaceuticals and Potential Endocrine Disrupting Compounds in Wastewa- ters and Spring Waters by Selective Elution and Analysis by Gas Chromatography―Mass Spectrometry,” Journal of Chromatography A, Vol. 1169, No. 1-2, 2007, pp. 31- 39. doi:10.1016/j.chroma.2007.08.056 [17] Z. Liu, Y. Kanjo and S. Mizutani, “Removal Mecha- nisms for Endocrine Disrupting Compounds (EDCs) in Wastewater Treatment—Physical Means, Biodegradation, and Chemical Advanced Oxidation: A Review,” Science of the Total Environment, Vol. 407, No. 2, 2009, pp. 731-748. doi:10.1016/j.scitotenv.2008.08.039 [18] C. Almeida and J. M. F. Nogueira, “Determination of Steroid Sex Hormones in Water and Urine Matrices by Stir Bar Sorptive Extraction and Liquid Chromatography with Diode Array Detection,” Journal of Pharmaceutical and Biomedical Analysis, Vol. 41, No. 4, 2006, pp. 1303- 1311. doi:10.1016/j.jpba.2006.02.037 [19] Y. K. K. Koh, T. Y. Chiu, A. Boobis, E. Cartmell, J. N. Lester and M.D. Scrimshaw, “Determination of Steroid Estrogens in Wastewater by High Performance Liquid Chromatography-Tandem Mass Spectrometry,” Journal of Chromatography A, Vol. 1173, No. 1-2, 2007, pp. 81- 87. doi:10.1016/j.chroma.2007.09.074 [20] C. Miège, P. Bados, C. Brosse and M Coquery, “Method Validation for the Analysis of Estrogens Including Conju- gated Compounds) in Various Aqueous Matrices,” Trends in Analytical Chemistry, Vol. 28, No. 2, 2009, pp. 237-244. doi:10.1016/j.trac.2008.11.005 [21] E. M. Thurman and M. S. Mills, “Solid-Phase Extraction: Principles and Practice,” In: J. D. Winefordner, Ed., Chemical Analysis, A Series of Monographs on Analyti- cal and Its Applications, John Wiley & Sons, Inc., Ho- boken, 1998, pp. 1-339. [22] E. M. Costi, I. Goryachevab, M. D. Sicilia, S. Rubio and D. Pérez-Bendito, “Supramolecular Solid-Phase Extrac- tion of Ibuprofen and Naproxen from Sewage Based on the Formation of Mixed Supramolecular Aggregates Prior to Their Liquid Chromatographic/Photometric Determi- nation,” Journal of Chromatography A, Vol. 1210, No. 1, 2008, pp. 1-7. doi:10.1016/j.chroma.2008.09.024 [23] M. Huber, S. Canonica and G. Y. Park, “Oxidation of Pharmaceuticals during Ozonation and Advanced Oxida- tion Processes,” Environmental Science & Technology, Vol. 37, No. 5, 2003, pp. 1016-1024. doi:10.1021/es025896h [24] L. S. Clesceri, A. E. Greenberg and A. D. Eaton, “Stan- dard Methods for the Examination of Water and Waste- water,” APHA, AWWA and WEF, New York, 1998. [25] H. B. Jakobsen, M. R. Nørrelykkeb, L. P. Christensen and M. Edelenbos, “Comparison of Methods Used for Pre- concentrating Small Volumes of Organic Volatile Solu- tions,” Journal of Chromatography A, Vol. 1003, No. 1-2, 2003, pp. 1-10. doi:10.1016/S0021-9673(03)00847-1 [26] M. Deborde, S. Rabouan, J. P. Duguet and B Legube, “Kinetics of Aqueous Ozone-Induced Oxidation of Some Endocrine Disruptors,” Environmental Science & Tech- nology, Vol. 39, No. 16, 2005, pp. 6086-6092. doi:10.1021/es0501619 [27] M. Guedes-Maniero, D. B. Maia and M. Dezotti, “Deg- radation and Estrogenic Activity Removal of 17β-Estra- diol and 17α-Ethinylestradiol by Ozonation and O3/ H2O2,” Science of the Total Environment, Vol. 407, No. 1, 2009, pp. 731-748. [28] S. Mitra, “Sample Preparation Techniques in Analytical Chemistry,” Wiley Interscience Publication, 2003. doi:10.1002/0471457817 Copyright © 2011 SciRes. AJAC
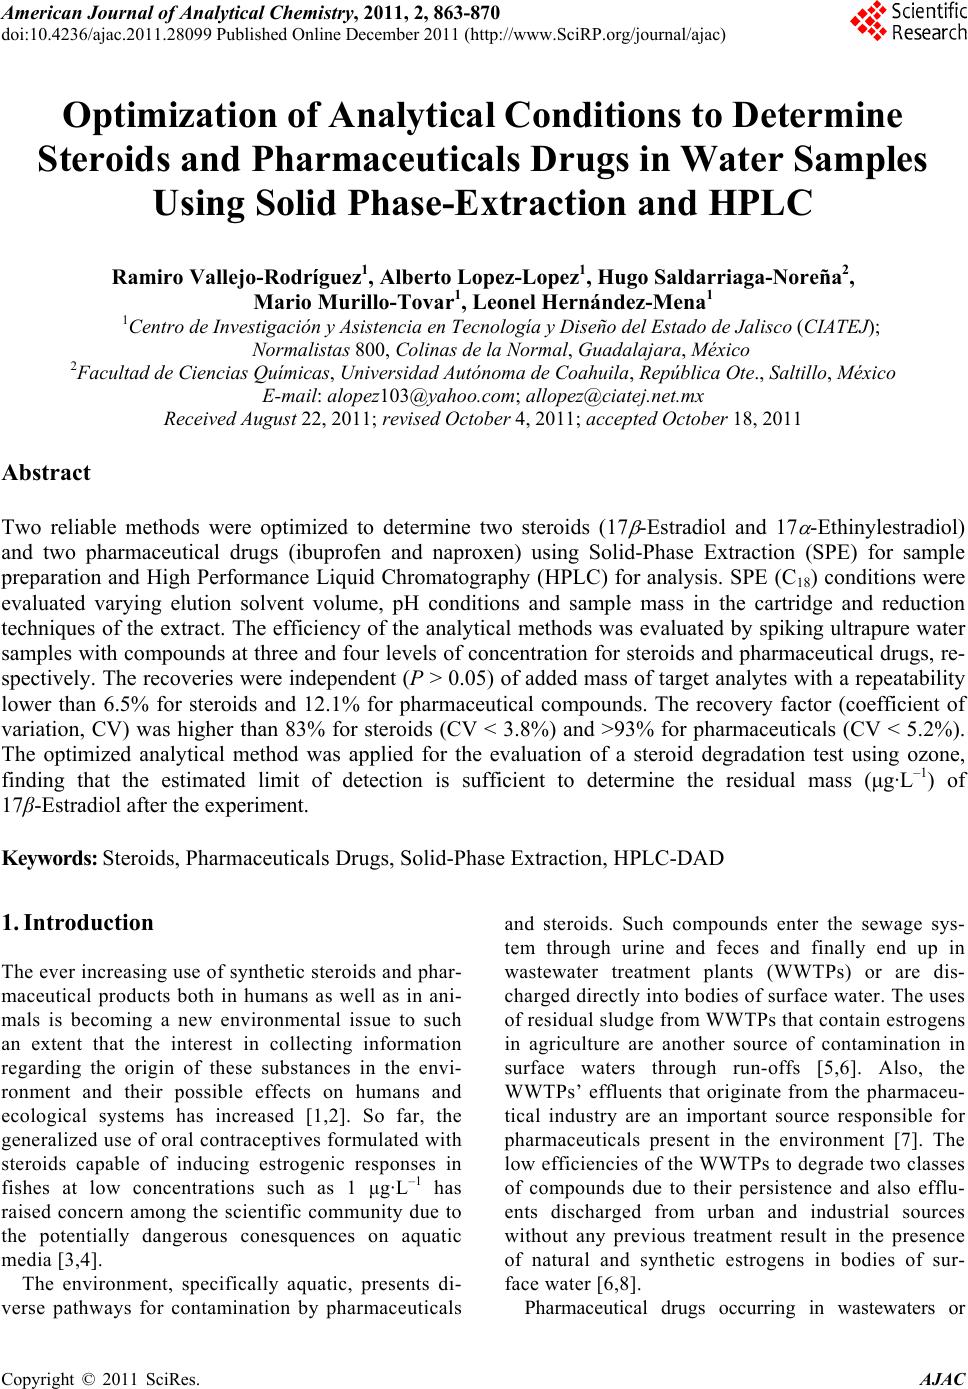
|