Paper Menu >>
Journal Menu >>
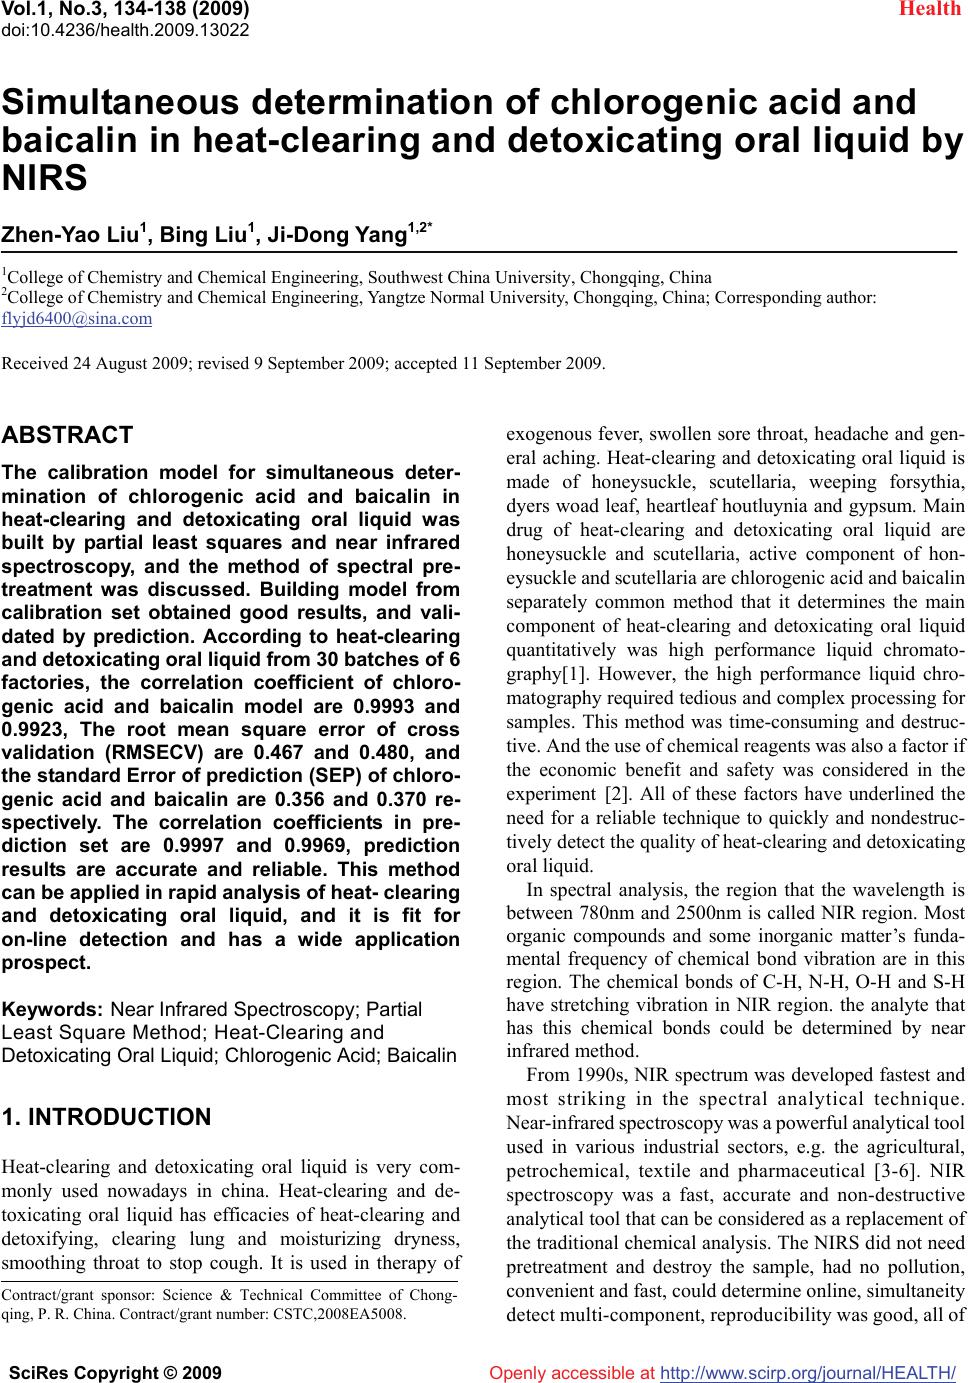 Vol.1, No.3, 134-138 (2009) doi:10.4236/health.2009.13022 SciRes Copyright © 2009 http://www.scirp.org/journal/HEALTH/ Health Openly accessible at Simultaneous determination of chlorogenic acid and baicalin in heat-clearing and detoxicating oral liquid by NIRS Zhen-Yao Liu1, Bing Liu1, Ji-Dong Yang1,2* 1College of Chemistry and Chemical Engineering, Southwest China University, Chongqing, China 2College of Chemistry and Chemical Engineering, Yangtze Normal University, Chongqing, China; Corresponding author: flyjd6400@sina.com Received 24 August 2009; revised 9 September 2009; accepted 11 September 2009. ABSTRACT The calibration model for simultaneous deter- mination of chlorogenic acid and baicalin in heat-clearing and detoxicating oral liquid was built by partial least squares and near infrared spectroscopy, and the method of spectral pre- treatment was discussed. Building model from calibration set obtained good results, and vali- dated by prediction. According to heat-clearing and detoxicating oral liquid from 30 batches of 6 factories, the correlation coefficient of chloro- genic acid and baicalin model are 0.9993 and 0.9923, The root mean square error of cross validation (RMSECV) are 0.467 and 0.480, and the standard Error of prediction (SEP) of chloro- genic acid and baicalin are 0.356 and 0.370 re- spectively. The correlation coefficients in pre- diction set are 0.9997 and 0.9969, prediction results are accurate and reliable. This method can be applied in rapid analysis of heat- clearing and detoxicating oral liquid, and it is fit for on-line detection and has a wide application prospect. Keywords: Near Infrared Spectroscopy; Partial Least Square Method; Heat-Clearing and Detoxicating Oral Liquid; Chlorogenic Acid; Baicalin 1. INTRODUCTION Heat-clearing and detoxicating oral liquid is very com- monly used nowadays in china. Heat-clearing and de- toxicating oral liquid has efficacies of heat-clearing and detoxifying, clearing lung and moisturizing dryness, smoothing throat to stop cough. It is used in therapy of exogenous fever, swollen sore throat, headache and gen- eral aching. Heat-clearing and detoxicating oral liquid is made of honeysuckle, scutellaria, weeping forsythia, dyers woad leaf, heartleaf houtluynia and gypsum. Main drug of heat-clearing and detoxicating oral liquid are honeysuckle and scutellaria, active component of hon- eysuckle and scutellaria are chlorogenic acid and baicalin separately common method that it determines the main component of heat-clearing and detoxicating oral liquid quantitatively was high performance liquid chromato- graphy[1]. However, the high performance liquid chro- matography required tedious and complex processing for samples. This method was time-consuming and destruc- tive. And the use of chemical reagents was also a factor if the economic benefit and safety was considered in the experiment [2]. All of these factors have underlined the need for a reliable technique to quickly and nondestruc- tively detect the quality of heat-clearing and detoxicating oral liquid. In spectral analysis, the region that the wavelength is between 780nm and 2500nm is called NIR region. Most organic compounds and some inorganic matter’s funda- mental frequency of chemical bond vibration are in this region. The chemical bonds of C-H, N-H, O-H and S-H have stretching vibration in NIR region. the analyte that has this chemical bonds could be determined by near infrared method. From 1990s, NIR spectrum was developed fastest and most striking in the spectral analytical technique. Near-infrared spectroscopy was a powerful analytical tool used in various industrial sectors, e.g. the agricultural, petrochemical, textile and pharmaceutical [3-6]. NIR spectroscopy was a fast, accurate and non-destructive analytical tool that can be considered as a replacement of the traditional chemical analysis. The NIRS did not need pretreatment and destroy the sample, had no pollution, convenient and fast, could determine online, simultaneity detect multi-component, reproducibility was good, all of Contract/grant sponsor: Science & Technical Committee of Chong- qing, P. R. China. Contract/grant number: CSTC,2008EA5008. 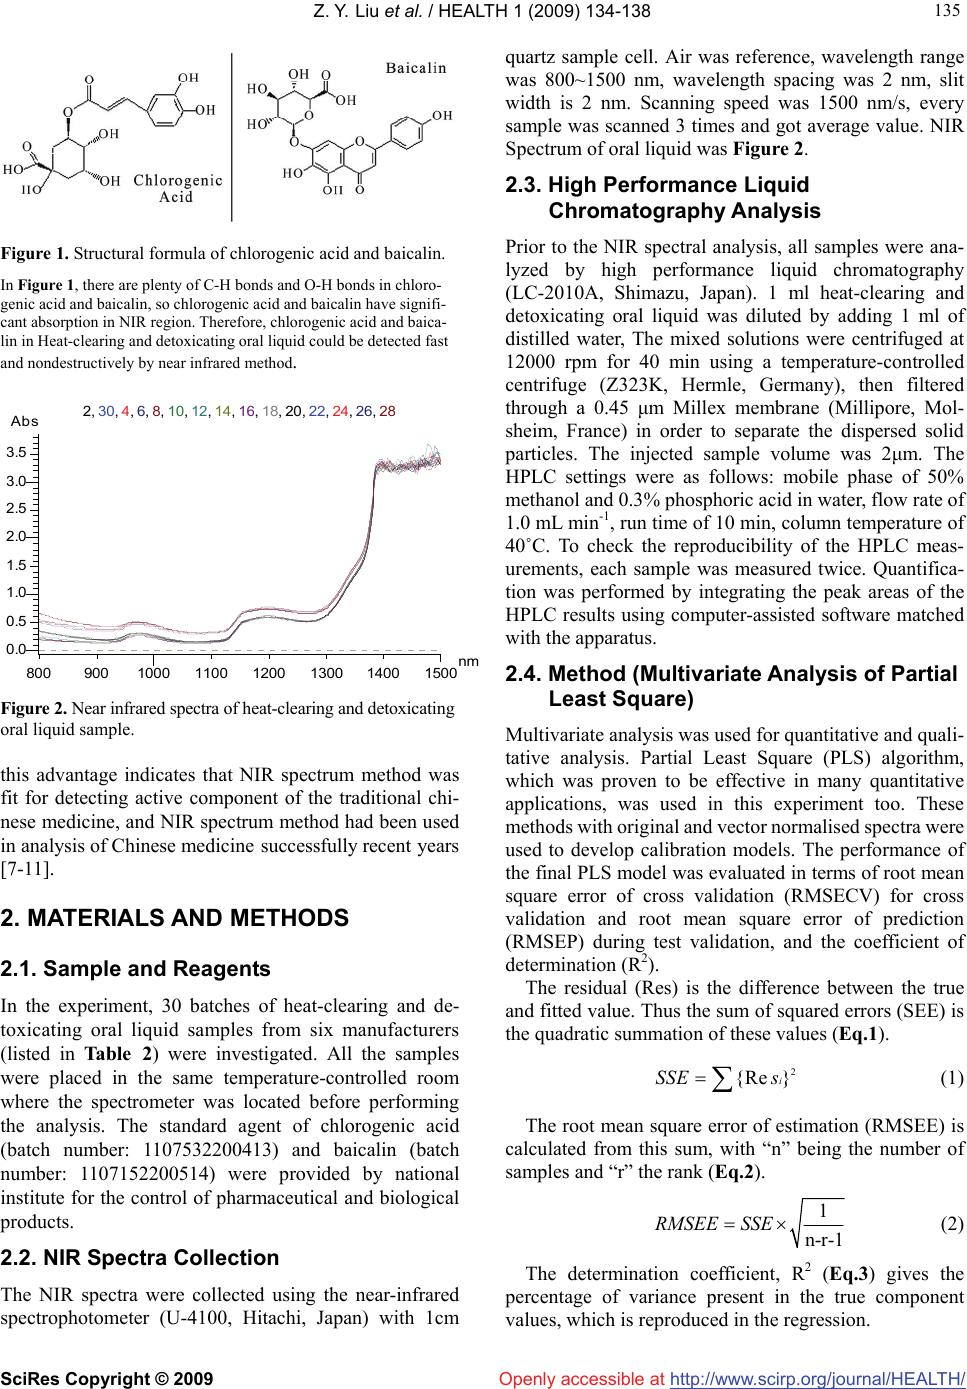 Z. Y. Liu et al. / HEALTH 1 (2009) 134-138 SciRes Copyright © 2009 http://www.scirp.org/journal/HEALTH/ 135 135 Openly accessible at Figure 1. Structural formula of chlorogenic acid and baicalin. In Figure 1, there are plenty of C-H bonds and O-H bonds in chloro- genic acid and baicalin, so chlorogenic acid and baicalin have signifi- cant absorption in NIR region. Therefore, chlorogenic acid and baica- lin in Heat-clearing and detoxicating oral liquid could be detected fast and nondestructively by near infrared method. 8009001000 110012001300 1400 1500nm 2 , 3 0 , 4 , 6 , 8 , 1 0 , 1 2 , 1 4 , 1 6 , 1 8 , 2 0 , 2 2 , 2 4 , 2 6 , 2 8 0.0 0.5 1.0 1.5 2.0 2.5 3.0 3.5 Abs Figure 2. Near infrared spectra of heat-clearing and detoxicating oral liquid sample. this advantage indicates that NIR spectrum method was fit for detecting active component of the traditional chi- nese medicine, and NIR spectrum method had been used in analysis of Chinese medicine successfully recent years [7-11]. 2. MATERIALS AND METHODS 2.1. Sample and Reagents In the experiment, 30 batches of heat-clearing and de- toxicating oral liquid samples from six manufacturers (listed in Table 2) were investigated. All the samples were placed in the same temperature-controlled room where the spectrometer was located before performing the analysis. The standard agent of chlorogenic acid (batch number: 1107532200413) and baicalin (batch number: 1107152200514) were provided by national institute for the control of pharmaceutical and biological products. 2.2. NIR Spectra Collection The NIR spectra were collected using the near-infrared spectrophotometer (U-4100, Hitachi, Japan) with 1cm quartz sample cell. Air was reference, wavelength range was 800~1500 nm, wavelength spacing was 2 nm, slit width is 2 nm. Scanning speed was 1500 nm/s, every sample was scanned 3 times and got average value. NIR Spectrum of oral liquid was Figure 2. 2.3. High Performance Liquid Chromatography Analysis Prior to the NIR spectral analysis, all samples were ana- lyzed by high performance liquid chromatography (LC-2010A, Shimazu, Japan). 1 ml heat-clearing and detoxicating oral liquid was diluted by adding 1 ml of distilled water, The mixed solutions were centrifuged at 12000 rpm for 40 min using a temperature-controlled centrifuge (Z323K, Hermle, Germany), then filtered through a 0.45 μm Millex membrane (Millipore, Mol- sheim, France) in order to separate the dispersed solid particles. The injected sample volume was 2μm. The HPLC settings were as follows: mobile phase of 50% methanol and 0.3% phosphoric acid in water, flow rate of 1.0 mL min-1, run time of 10 min, column temperature of 40˚C. To check the reproducibility of the HPLC meas- urements, each sample was measured twice. Quantifica- tion was performed by integrating the peak areas of the HPLC results using computer-assisted software matched with the apparatus. 2.4. Method (Multivariate Analysis of Partial Least Square) Multivariate analysis was used for quantitative and quali- tative analysis. Partial Least Square (PLS) algorithm, which was proven to be effective in many quantitative applications, was used in this experiment too. These methods with original and vector normalised spectra were used to develop calibration models. The performance of the final PLS model was evaluated in terms of root mean square error of cross validation (RMSECV) for cross validation and root mean square error of prediction (RMSEP) during test validation, and the coefficient of determination (R2). The residual (Res) is the difference between the true and fitted value. Thus the sum of squared errors (SEE) is the quadratic summation of these values (Eq. 1). 2 Re }{i s SSE (1) The root mean square error of estimation (RMSEE) is calculated from this sum, with “n” being the number of samples and “r” the rank (Eq.2). 1 n-r-1 RMSEE SSE (2) The determination coefficient, R2 (Eq.3) gives the percentage of variance present in the true component values, which is reproduced in the regression. 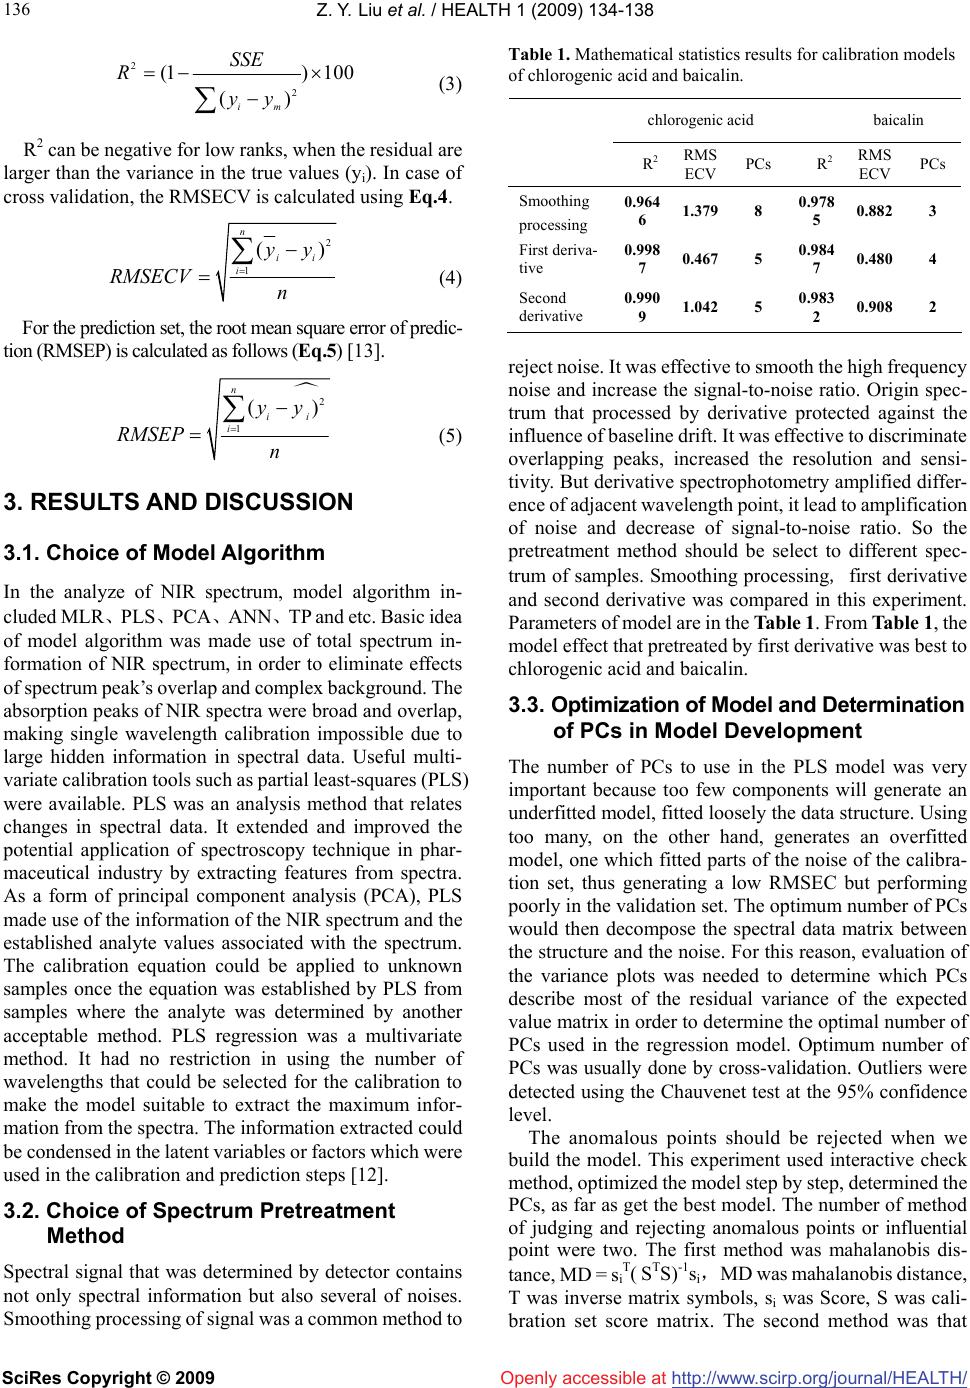 Z. Y. Liu et al. / HEALTH 1 (2009) 134-138 SciRes Copyright © 2009 http://www.scirp.org/journal/HEALTH/ 136 Openly accessible at 2 2 (1) 100 () im SSE R yy (3) R2 can be negative for low ranks, when the residual are larger than the variance in the true values (yi). In case of cross validation, the RMSECV is calculated using Eq.4. 2 1 () n ii i yy RMSECV n (4) For the prediction set, the root mean square error of predic- tion (RMSEP) is calculated as follows (Eq.5) [13]. 2 1 () n ii i yy RMSEP n (5) 3. RESULTS AND DISCUSSION 3.1. Choice of Model Algorithm In the analyze of NIR spectrum, model algorithm in- cluded MLR、PLS、PCA、AN N、TP and etc. Basic idea of model algorithm was made use of total spectrum in- formation of NIR spectrum, in order to eliminate effects of spectrum peak’s overlap and complex background. The absorption peaks of NIR spectra were broad and overlap, making single wavelength calibration impossible due to large hidden information in spectral data. Useful multi- variate calibration tools such as partial least-squares (PLS) were available. PLS was an analysis method that relates changes in spectral data. It extended and improved the potential application of spectroscopy technique in phar- maceutical industry by extracting features from spectra. As a form of principal component analysis (PCA), PLS made use of the information of the NIR spectrum and the established analyte values associated with the spectrum. The calibration equation could be applied to unknown samples once the equation was established by PLS from samples where the analyte was determined by another acceptable method. PLS regression was a multivariate method. It had no restriction in using the number of wavelengths that could be selected for the calibration to make the model suitable to extract the maximum infor- mation from the spectra. The information extracted could be condensed in the latent variables or factors which were used in the calibration and prediction steps [12]. 3.2. Choice of Spectrum Pretreatment Method Spectral signal that was determined by detector contains not only spectral information but also several of noises. Smoothing processing of signal was a common method to Table 1. Mathematical statistics results for calibration models of chlorogenic acid and baicalin. chlorogenic acid baicalin R2RMS ECV PCs R2 RMS ECV PCs Smoothing processing 0.964 6 1.3798 0.978 5 0.8823 First deriva- tive 0.998 7 0.4675 0.984 7 0.4804 Second derivative 0.990 9 1.0425 0.983 2 0.9082 reject noise. It was effective to smooth the high frequency noise and increase the signal-to-noise ratio. Origin spec- trum that processed by derivative protected against the influence of baseline drift. It was effective to discriminate overlapping peaks, increased the resolution and sensi- tivity. But derivative spectrophotometry amplified differ- ence of adjacent wavelength point, it lead to amplification of noise and decrease of signal-to-noise ratio. So the pretreatment method should be select to different spec- trum of samples. Smoothing processing, first derivative and second derivative was compared in this experiment. Parameters of model are in the Table 1. From Table 1, the model effect that pretreated by first derivative was best to chlorogenic acid and baicalin. 3.3. Optimization of Model and Determination of PCs in Model Development The number of PCs to use in the PLS model was very important because too few components will generate an underfitted model, fitted loosely the data structure. Using too many, on the other hand, generates an overfitted model, one which fitted parts of the noise of the calibra- tion set, thus generating a low RMSEC but performing poorly in the validation set. The optimum number of PCs would then decompose the spectral data matrix between the structure and the noise. For this reason, evaluation of the variance plots was needed to determine which PCs describe most of the residual variance of the expected value matrix in order to determine the optimal number of PCs used in the regression model. Optimum number of PCs was usually done by cross-validation. Outliers were detected using the Chauvenet test at the 95% confidence level. The anomalous points should be rejected when we build the model. This experiment used interactive check method, optimized the model step by step, determined the PCs, as far as get the best model. The number of method of judging and rejecting anomalous points or influential point were two. The first method was mahalanobis dis- tance, MD = si T( STS)-1si, MD was mahalanobis distance, T was inverse matrix symbols, si was Score, S was cali- bration set score matrix. The second method was that 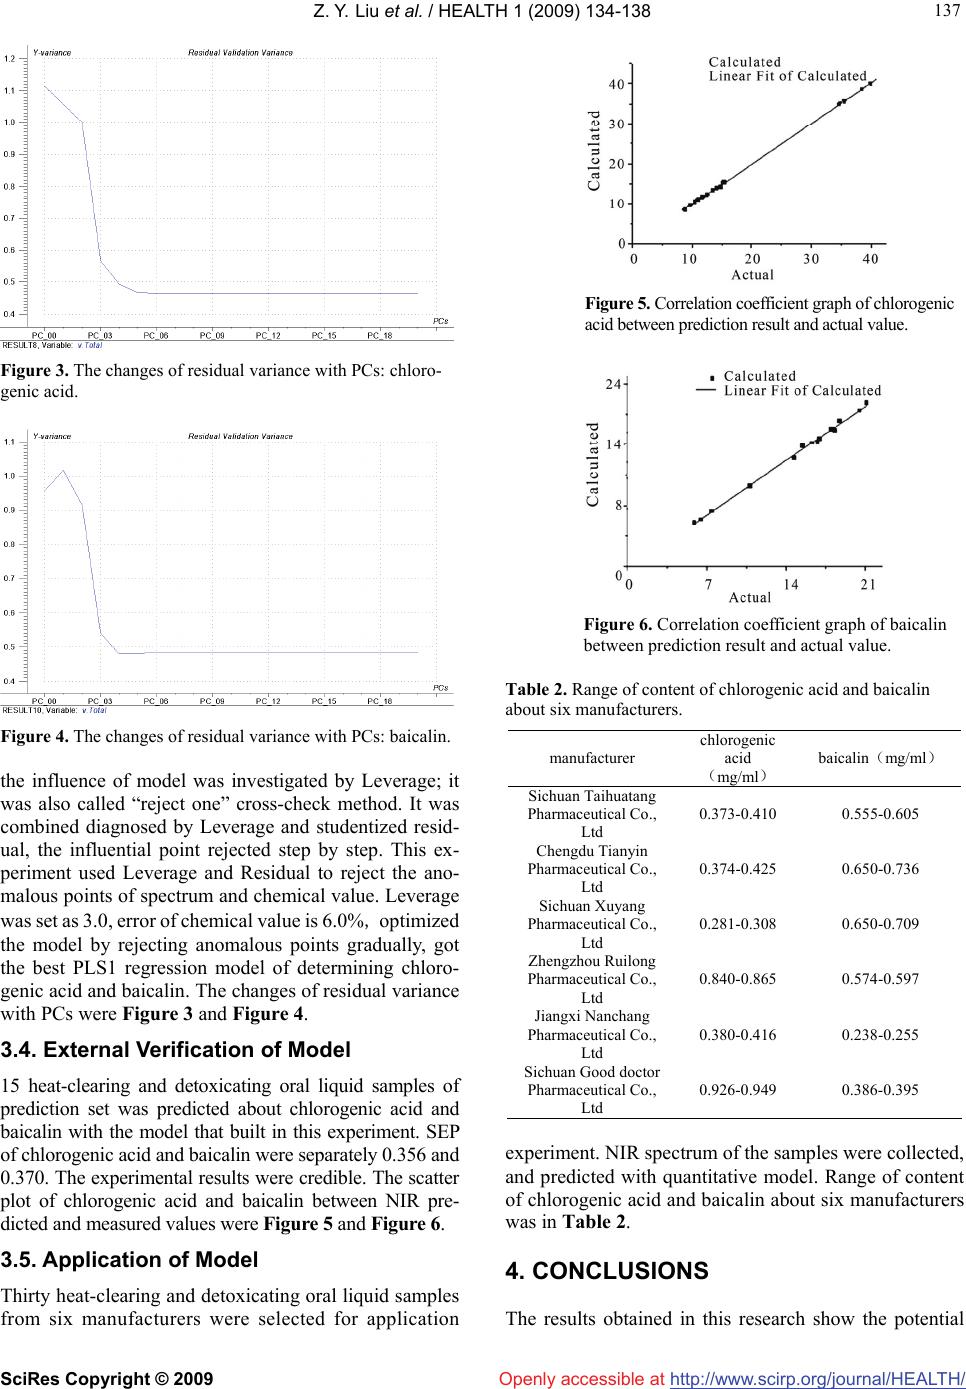 Z. Y. Liu et al. / HEALTH 1 (2009) 134-138 SciRes Copyright © 2009 http://www.scirp.org/journal/HEALTH/ 137 137 Openly accessible at Figure 3. The changes of residual variance with PCs: chloro- genic acid. Figure 4. The changes of residual variance with PCs: baicalin. the influence of model was investigated by Leverage; it was also called “reject one” cross-check method. It was combined diagnosed by Leverage and studentized resid- ual, the influential point rejected step by step. This ex- periment used Leverage and Residual to reject the ano- malous points of spectrum and chemical value. Leverage was set as 3.0, error of chemical value is 6.0%, optimized the model by rejecting anomalous points gradually, got the best PLS1 regression model of determining chloro- genic acid and baicalin. The changes of residual variance with PCs were Figure 3 and Figure 4. 3.4. External Verification of Model 15 heat-clearing and detoxicating oral liquid samples of prediction set was predicted about chlorogenic acid and baicalin with the model that built in this experiment. SEP of chlorogenic acid and baicalin were separately 0.356 and 0.370. The experimental results were credible. The scatter plot of chlorogenic acid and baicalin between NIR pre- dicted and measured values were Figure 5 and Figure 6. 3.5. Application of Model Thirty heat-clearing and detoxicating oral liquid samples from six manufacturers were selected for application Figure 5. Correlation coefficient graph of chlorogenic acid between prediction result and actual value. Figure 6. Correlation coefficient graph of baicalin between prediction result and actual value. Table 2. Range of content of chlorogenic acid and baicalin about six manufacturers. manufacturer chlorogenic acid () mg/ml baicalin() mg/ml Sichuan Taihuatang Pharmaceutical Co., Ltd 0.373-0.410 0.555-0.605 Chengdu Tianyin Pharmaceutical Co., Ltd 0.374-0.425 0.650-0.736 Sichuan Xuyang Pharmaceutical Co., Ltd 0.281-0.308 0.650-0.709 Zhengzhou Ruilong Pharmaceutical Co., Ltd 0.840-0.865 0.574-0.597 Jiangxi Nanchang Pharmaceutical Co., Ltd 0.380-0.416 0.238-0.255 Sichuan Good doctor Pharmaceutical Co., Ltd 0.926-0.949 0.386-0.395 experiment. NIR spectrum of the samples were collected, and predicted with quantitative model. Range of content of chlorogenic acid and baicalin about six manufacturers was in Table 2. 4. CONCLUSIONS The results obtained in this research show the potential  Z. Y. Liu et al. / HEALTH 1 (2009) 134-138 SciRes Copyright © 2009 http://www.scirp.org/journal/HEALTH/ 138 superiority of NIR spectroscopy to detect chlorogenic acid and baicalin simultaneously in heat-clearing and de- toxicating oral liquid with the reference method of HPLC. The combination of NIR spectroscopy and PLS methods had been found to be a convenient, versatile method. It had the ability to dramatically reduce consuming time and cost of monitoring without using any chemical reagent, it was fit for on-line detection in pharmaceutical companies. Openly accessible at REFERENCES [1] Chinese pharmacopoeia, (2005) Edition, Beijing publica- tion. [2] Q. S. Chen, J. Zhao, H. Lin, (2009) Study on discrimina- tion of roast green tea (Camellia sinensis L.) according to geographical origin by FT-NIR spectroscopy and super- vised pattern recognition, Spectro-Chimica Acta Part A, 72(5), 845-850. [3] S. Macho, M. S. Larrechi, (2002) Near-infrared spec- troscopy and multivariate calibration for the quantitative determination of certain properties in the petrochemical industry, Trends in Analytical Chemistry, 21(12), 799- 806. [4] M. E. Lafargue, M. H. Feinberg, J. J. Daudin, and D. N. Rutledge, (2003) Homogeneity check of agricultural and Anal. Bioanal. Chem, 375(4), 496-504. [5] P. M. Lucy, E. H. Stephen, I. David, V. V. Frank and L. Susan, (2007) At-Line near-infrared spectroscopy for prediction of the solid fat content of milk fat from New Zealand butter, Agriculture and Food Chemistry, 55(6), 2791-2796. [6] Y. B. Wang, H. F. Yuan, Lu W. Z. zhen. (2000) Applica- tion of artificial neural network for the determination of diesel fuel flash point by near-infrared spectroscopy. Chinese Journal of Analytieal. Chemistry, 9(4), 1070- 1077. [7] C. Zhao, H. B. Qu, Y. Y. Cheng, (2004) A new approach to the fast measurement of content of amino acids in cordy- ceps sinensis by ANN-NIR, Spectroscopy and Spectral Analysis, 24(3), 50-56. [8] X. Y. Gu, Y. Wang, K. X. Xu, L. Li, N. S. Ling, (2004) Measurement of borneol based on near infrared spec- troscopy, Spectroscopy and Spectral Analysis, 24(3), 155-162. [9] H. B. Qu, X. X. Liu, Y . Y. Cheng, (2004) A Method for analysis of extracting solution of panax notoginseng using near-infrared spectroscopy and support vector regression, Chemical Journal of Chinese Universities, 25(4), 39-45. [10] S. K. Yan, G. A. Luo, Y. M. Wang, (2006) Study on real-time control of extraction procedure of furitus gar- denia by near infrared spectroscopy.spectroscopy and spectral analysis, 26(2), 1026-1031. [11] L. Ai, Q. L. Liang, G. A. Luo, (2008) Application of NIR spectrum in Asia-Pacific traditional medicine, 6(1), 52-57. [12] L. A. Xie, X. Q. Ye, D. H. Liu, Y. B. Yine, (2009) Quan- tification of glucose, fructose and sucrose in bayberry juice by NIR and PLS Food Chemistry, 114(6), 1135- 1141. [13] V . R. Sinija, H. N. Mishra, (2009) FT-NIR spectroscopy for caffeine estimation in instant green tea powder and granules, LWT-Food Science and Technology, 42(5), 998-1002. |