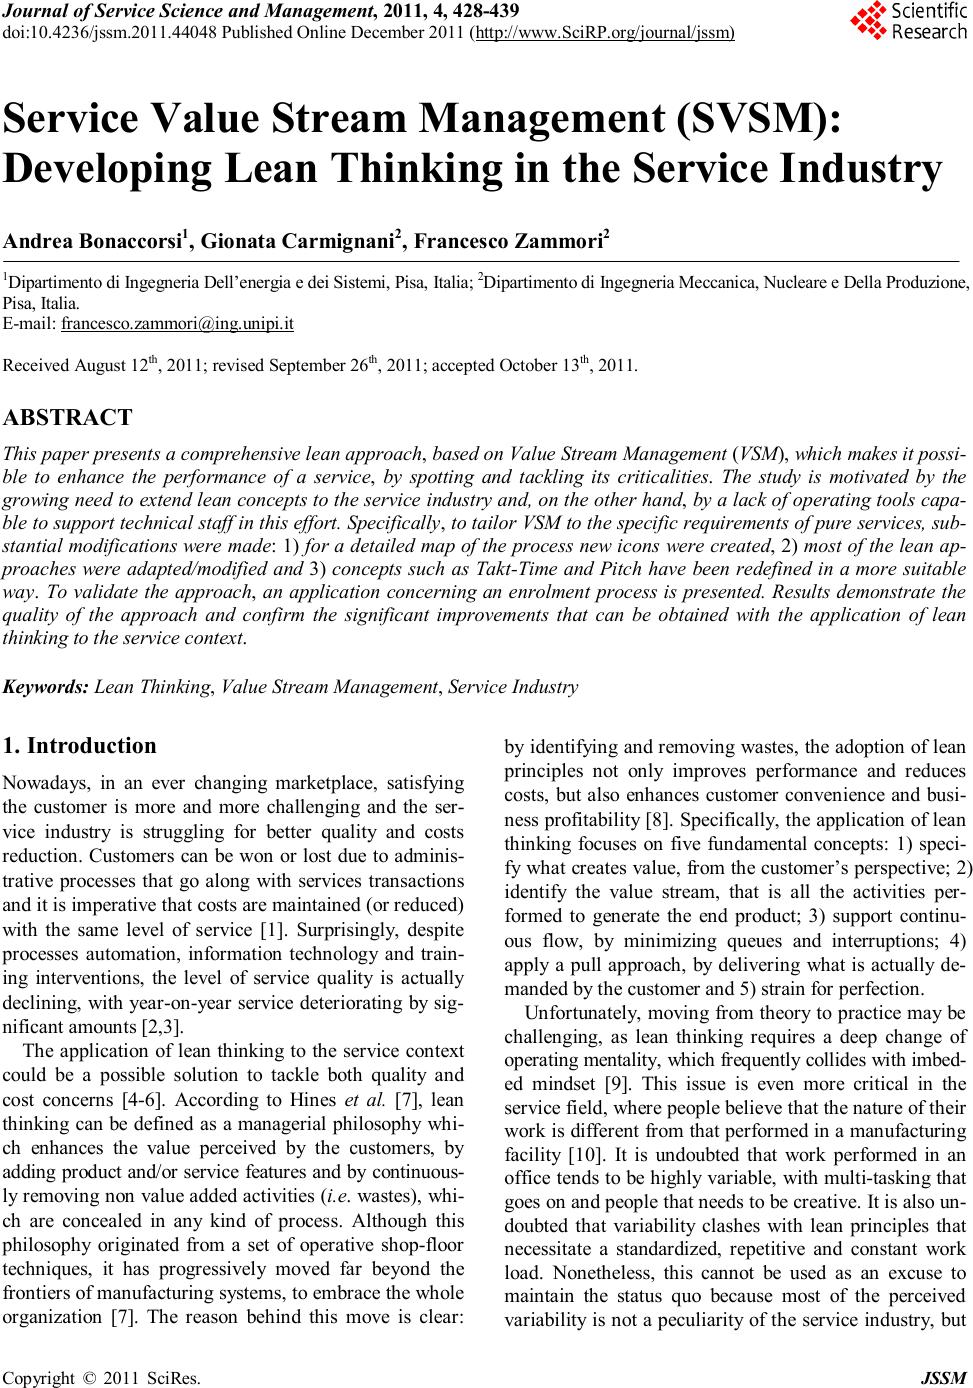
 Journal of Service Science and Management, 2011, 4, 428-439 doi:10.4236/jssm.2011.44048 Published Online December 2011 (http://www.SciRP.org/journal/jssm) Copyright © 2011 SciRes. JSSM Service Value Stream Management (SVSM): Developing Lean Thinking in the Service Industry Andrea Bonaccorsi1, Gionata Carmignani2, Francesco Zammori2 1Dipartimento di Ingegneria Dell’energia e dei Sistemi, Pisa, Italia; 2Dipartimento di Ingegneria Meccanica, Nucleare e Della Produzione, Pisa, Italia. E-mail: francesco.zammori@ing.unipi.it Received August 12th, 2011; revised September 26th, 2011; accepted October 13th, 2011. ABSTRACT This paper presents a comprehensive lean approach, based on Value Stream Management (VSM), which makes it possi- ble to enhance the performance of a service, by spotting and tackling its criticalities. The study is motivated by the growing need to extend lean concepts to the service industry and, on the other hand, by a lack of operating tools capa- ble to support technical staff in this effort. Specifically, to tailor VSM to the specific requirements of pure services, sub- stantial modifications were made: 1) for a detailed map of the process new icons were created, 2) most of the lean ap- proaches were adapted/modified and 3) concepts such as Takt-Time and Pitch have been redefined in a more suitable way. To validate the approach, an application concerning an enrolment process is presented. Results demonstrate the quality of the approach and confirm the significant improvements that can be obtained with the application of lean thinking to the service context. Keywords: Lean Thinking, Value Stream Management, Service Industry 1. Introduction Nowadays, in an ever changing marketplace, satisfying the customer is more and more challenging and the ser- vice industry is struggling for better quality and costs reduction. Customers can be won or lost due to adminis- trative processes that go along with services transactions and it is imperative that costs are maintained (or reduced) with the same level of service [1]. Surprisingly, despite processes automation, information technology and train- ing interventions, the level of service quality is actually declining, with year-on-year service deteriorating by sig- nificant amounts [2,3]. The application of lean thinking to the service context could be a possible solution to tackle both quality and cost concerns [4-6]. According to Hines et al. [7], lean thinking can be defined as a managerial philosophy whi- ch enhances the value perceived by the customers, by adding product and/or service features and by continuous- ly removing non value added activities (i.e. wastes), whi- ch are concealed in any kind of process. Although this philosophy originated from a set of operative shop-floor techniques, it has progressively moved far beyond the frontiers of manufacturing systems, to embrace the whole organization [7]. The reason behind this move is clear: by identifying and removing wastes, the adoption of lean principles not only improves performance and reduces costs, but also enhances customer convenience and busi- ness profitability [8]. Specifically, the application of lean thinking focuses on five fundamental concepts: 1) speci- fy what creates value, from the customer’s perspective; 2) identify the value stream, that is all the activities per- formed to generate the end product; 3) support continu- ous flow, by minimizing queues and interruptions; 4) apply a pull approach, by delivering what is actually de- manded by the customer and 5) strain for perfection. Unfortunately, moving from theory to practice may be challenging, as lean thinking requires a deep change of operating mentality, which frequently collides with imbed- ed mindset [9]. This issue is even more critical in the service field, where people believe that the nature of their work is different from that performed in a manufacturing facility [10]. It is undoubted that work performed in an office tends to be highly variable, with multi-tasking that goes on and people that needs to be creative. It is also un- doubted that variability clashes with lean principles that necessitate a standardized, repetitive and constant work load. Nonetheless, this cannot be used as an excuse to maintain the status quo because most of the perceived variability is not a peculiarity of the service industry, but 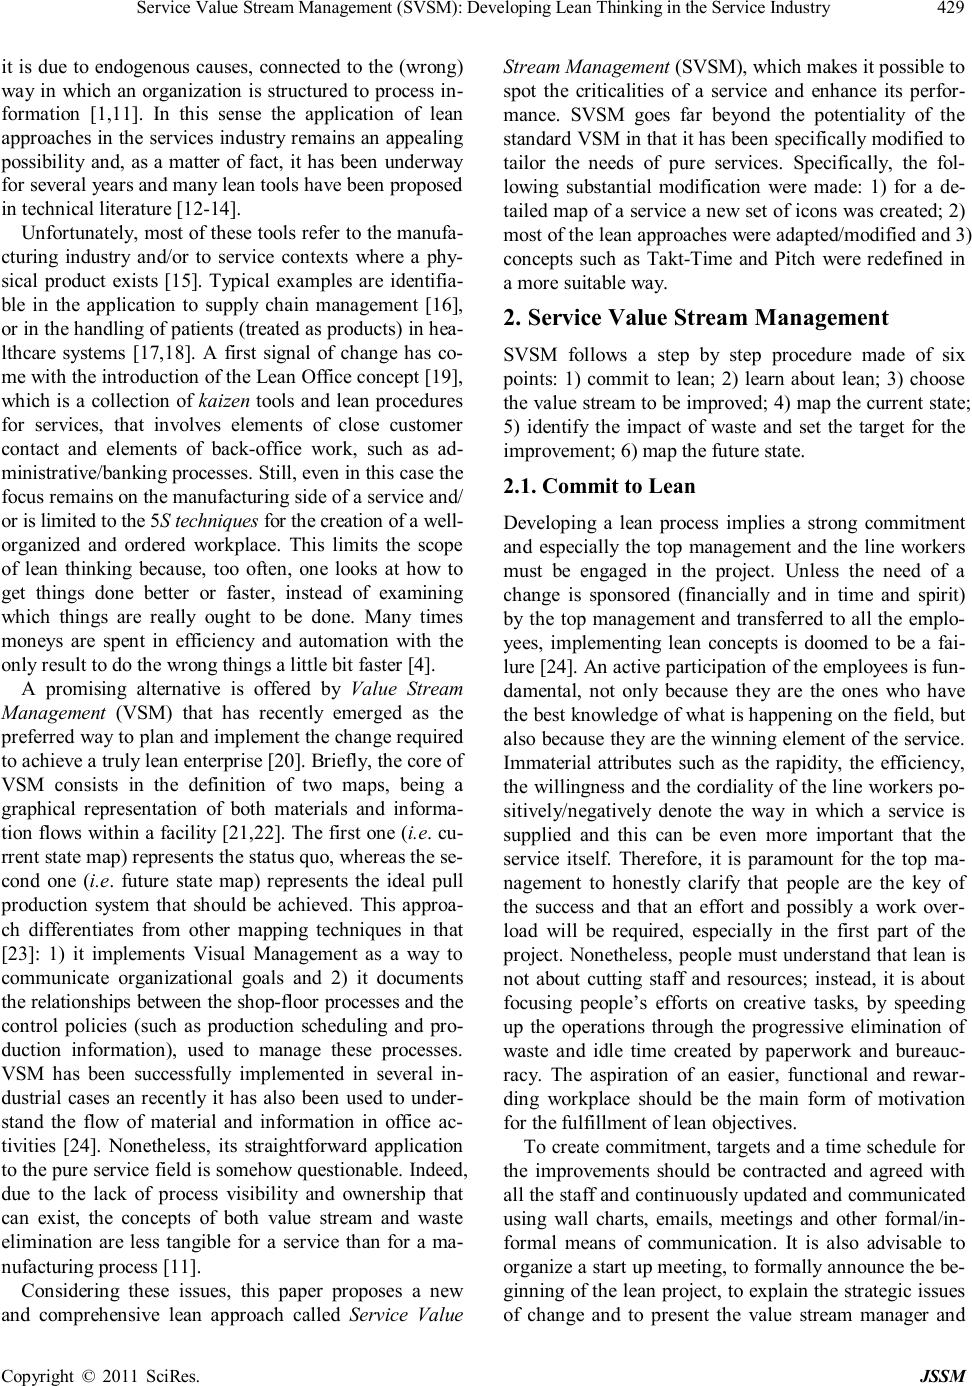 Service Value Stream Management (SVSM): Developing Lean Thinking in the Service Industry Copyright © 2011 SciRes. JSSM 429 it is due to endogenous causes, connected to the (wrong) way in which an organization is structured to process in- formation [1,11]. In this sense the application of lean approaches in the services industry remains an appealing possibility and, as a matter of fact, it has been underway for several years and many lean tools have been proposed in technical literature [12-14]. Unfortunately, most of these tools refer to the manufa- cturing industry and/or to service contexts where a phy- sical product exists [15]. Typical examples are identifia- ble in the application to supply chain management [16], or in the handling of patients (treated as products) in hea- lthcare systems [17,18]. A first signal of change has co- me with the introduction of the Lean Office concept [19], which is a collection of kaizen tools and lean procedures for services, that involves elements of close customer contact and elements of back-office work, such as ad- ministrative/banking processes. Still, even in this case the focus remains on the manufacturing side of a service and/ or is limited to the 5S techniques for the creation of a well- organized and ordered workplace. This limits the scope of lean thinking because, too often, one looks at how to get things done better or faster, instead of examining which things are really ought to be done. Many times moneys are spent in efficiency and automation with the only result to do the wrong things a little bit faster [4]. A promising alternative is offered by Value Stream Management (VSM) that has recently emerged as the preferred way to plan and implement the change required to achieve a truly lean enterprise [20]. Briefly, the core of VSM consists in the definition of two maps, being a graphical representation of both materials and informa- tion flows within a facility [21,22]. The first one (i.e. cu- rrent state map) represents the status quo, whereas the se- cond one (i.e. future state map) represents the ideal pull production system that should be achieved. This approa- ch differentiates from other mapping techniques in that [23]: 1) it implements Visual Management as a way to communicate organizational goals and 2) it documents the relationships between the shop-floor processes and the control policies (such as production scheduling and pro- duction information), used to manage these processes. VSM has been successfully implemented in several in- dustrial cases an recently it has also been used to under- stand the flow of material and information in office ac- tivities [24]. Nonetheless, its straightforward application to the pure service field is somehow questionable. Indeed, due to the lack of process visibility and ownership that can exist, the concepts of both value stream and waste elimination are less tangible for a service than for a ma- nufacturing process [11]. Considering these issues, this paper proposes a new and comprehensive lean approach called Service Value Stream Management (SVSM), which makes it possible to spot the criticalities of a service and enhance its perfor- mance. SVSM goes far beyond the potentiality of the standard VSM in that it has been specifically modified to tailor the needs of pure services. Specifically, the fol- lowing substantial modification were made: 1) for a de- tailed map of a service a new set of icons was created; 2) most of the lean approaches were adapted/modified and 3) concepts such as Takt-Time and Pitch were redefined in a more suitable way. 2. Service Value Stream Management SVSM follows a step by step procedure made of six points: 1) commit to lean; 2) learn about lean; 3) choose the value stream to be improved; 4) map the current state; 5) identify the impact of waste and set the target for the improvement; 6) map the future state. 2.1. Commit to Lean Developing a lean process implies a strong commitment and especially the top management and the line workers must be engaged in the project. Unless the need of a change is sponsored (financially and in time and spirit) by the top management and transferred to all the emplo- yees, implementing lean concepts is doomed to be a fai- lure [24]. An active participation of the employees is fun- damental, not only because they are the ones who have the best knowledge of what is happening on the field, but also because they are the winning element of the service. Immaterial attributes such as the rapidity, the efficiency, the willingness and the cordiality of the line workers po- sitively/negatively denote the way in which a service is supplied and this can be even more important that the service itself. Therefore, it is paramount for the top ma- nagement to honestly clarify that people are the key of the success and that an effort and possibly a work over- load will be required, especially in the first part of the project. Nonetheless, people must understand that lean is not about cutting staff and resources; instead, it is about focusing people’s efforts on creative tasks, by speeding up the operations through the progressive elimination of waste and idle time created by paperwork and bureauc- racy. The aspiration of an easier, functional and rewar- ding workplace should be the main form of motivation for the fulfillment of lean objectives. To create commitment, targets and a time schedule for the improvements should be contracted and agreed with all the staff and continuously updated and communicated using wall charts, emails, meetings and other formal/in- formal means of communication. It is also advisable to organize a start up meeting, to formally announce the be- ginning of the lean project, to explain the strategic issues of change and to present the value stream manager and  Service Value Stream Management (SVSM): Developing Lean Thinking in the Service Industry Copyright © 2011 SciRes. JSSM 430 his team. Since the value stream manager has the respon- sibility for the attainment of the lean objectives, he must be granted both a sufficient budget and authority level. Furthermore, to facilitate his acceptance, he should be an influential person with an outstanding background. For the same reason, the team should include people taken from all the areas affected by the lean project. Typical examples are: customer service manager, documents flo- w manager, lean processes specialists, financial specia- lists and a selected number of office employees and key users. 2.2. Learn about Lean The second step consists in the organization of learning/ training sessions on lean concepts. This has the objective to increase commitment and to develop the skills to iden- tify/resolve operational weaknesses hindering organiza- tional effectiveness and efficiency [25,26]. All the people involved in the project should participate to these ses- sions, but the level of involvement should be tailored on their specific needs. For instance, everybody should have basic notions on lean and should be acquainted with the ten deadly wastes of the service industry [17] shown in Table 1. Conversely, only the team members and the key users should receive deeper notions on specific topics such as Just in Time, 5S techniques, visual control, auto- nomous maintenance and quick change-over. 2.3. Choose the Value Stream The value stream can be easily selected making a Service- Quantity (SQ) analysis and organizing data in the form of a Pareto Chart. Services that are asked more frequently (or the ones generating the greatest share of the total revenue) should be chosen for the analysis. If the distinction between the critical few and the trivial many is not clear, services should be grouped into homogeneous families. This can be done following either an operating or a strategically oriented approach. In the first case services that share a similar process route (i.e. service routing ana- lysis) are grouped together; in the second case data min- ing techniques may be used to identify those services that are conjointly required. A more customer oriented selection can be done using the number of defects (of a service) as the discriminating variable of the SQ analysis. To this aim the team should define specific defects categories such as: delays, data errors, excessive bureaucracy, problems with call centers, duplication/loss of documents, uneasy filing, lack of pre- liminary information given to the customers (i.e. where to go, at what time, with which documents), etc. Next, the team will gather as much information as possible from the external and internal customers, by means of question- naires, interviews, customers meetings and panel groups. Collected data should be sufficient to 1) clarify the needs of the customers; 2) ascertain the correctness of the de- fect categories; 3) give an importance weight to each defect and 4) classify and rank each service in terms of criticality. 2.4. Map the Current State The team is now ready to proceed with the construction of the current value stream map. This is a basic step of the lean project, as it defines the project’s baseline and forces the team to get acquainted with the process and to investigate and question how and why it is performed in a certain way. 2.4.1. Mapping Icons The map is built using a set of standard icons (Figure 1), which has been extended to meet the different necessities of the service industry. The process box icon is used to represent a single step of the process. However, for a service a single step could be made by a sequence of sub-tasks performed by the sa- me employee. In addition, the entity and even the order of each sub task could vary over time, as in the case of a loan approval process that requires different procedures, Table 1. The ten wastes of the service industry. Defects Data entry errors; Lost files; Lost or damages goods; Duplication Data re-entering; Multiple signatures; Unnecessary reporting; Multiple queries; Incorrect Inventory Stock out; Wasting time finding what was needed; Unnecessary copies; Lack of customer’s focus Unfriendliness; Rudeness; Poor attention to the customer; Overproduction Reports no ones will ever read; Processing paperwork before time; Unclear communication Incorrect information; Lack of standard data format; Unclear work flow; Motion/Transportation Poor layout; Ineffective filing; Poor ergonomic; Underutilized Employees Inadequate tools; Excessive bureaucracy; Limited authority; Variation Lack of procedures; Lack of standard formats; Standard time not defined; Waiting/Delay Waiting for approvals; Downtime; Waiting for supplies;  Service Value Stream Management (SVSM): Developing Lean Thinking in the Service Industry Copyright © 2011 SciRes. JSSM 431 depending on the risk level of the loan. In these circum- stances, a single icon may not be sufficient to give a clear description of the task. Therefore an inspection lens should be appended to the process box to indicate the availabili- ty of additional information, in the form of ASME pro- cess charts, flow diagrams and/or procedures. The presence of customer icon is another important element, as it allows visualizing all the steps requiring the physical presence of the customer, during the ongo- ing activities of the service. The team should place a par- ticular care in the identification/analysis of these contact points since it is here that customers can be won or lost, depending on the first impression of the service level that they get. Material and data suppliers icons have also been add- ed to better specify the nature of the first tier supplier(s). Whereas materials and subassemblies are the main inputs of a manufacturing firm, to correctly operate a manufac- turing firm, to correctly operate a service also requires up to date information. Specifically, most of the times both materials and information are required (as for an airline or a logistic/freight company), but some business (such as banks, insurance companies, public offices, etc.) may only necessitate forecasts, concerning market trend, cus- tomers needs and behavioral patterns. Finally, it is worth noting that the inventory icon may have a different meaning in a service value stream, as it can represent materials, documents or both. Sometimes it may even be useless; for instance, in services where lines are a matter of fact (as in a front office), inventories can be substituted by the presence-of-customer icon with the indication of the average queuing time. 2.4.2. Data Gathering and Mapping Procedure Data gathering should follow the same approach recom- mended by Braglia et al. [16]. The team walks through the process steps, following the route of a typical service. In doing so the team maps the process as it actually ope- rates, specifying value from the standpoint of the (inter- nal/external) customer, as well as waste in each step or between steps. To collect valuable information it is ad- visable to use an Attribute Collection Checklist (ACC) as the one in Figure 2. The entries of the ACC are case de- pendent, but should include, at least: 1) a brief descrip- tion of the tasks (possibly in the form of flow diagrams); 2) a list of the tools (i.e. procedures, software, informa- tion systems, etc.) used by the employees; 3) operating data and 4) waste types of the analyzed tasks. Figure 1. SVSM icons. Figure 2. Data collection checklist.  Service Value Stream Management (SVSM): Developing Lean Thinking in the Service Industry Copyright © 2011 SciRes. JSSM 432 Obtained data can be organized in the current state map; it is recommended to place the icons representing the customer, the provision control and the supplier on the top of the map and the ones representing the steps of the service in the bottom. The representation is comple- ted by adding process attributes, queues and buffers and by connecting the icons by means of communication and/ or material flow arrows. 2.5. Set the Target for the Improvement Each activity must be classified as: 1) value added; 2) non value added but necessary and 3) waste. Attention must be placed in this analysis because it could be cum- bersome [15]. Think for example to a family doctor who chats with his patients at the end of an examination. From a manufacturing point of view chatting is a waste, since it reduces productivity and interrupts the flow. Conversely, in a service context, chatting can be consi- dered as a value added activity, since it contributes to create trustiness between the doctor and his patients. For this reason it is advisable to classify activities fo- llowing two complementary points of view: a process and a customer oriented perspective, respectively. In case of mis- match, the customer oriented perspective should be pre- ferred, but the team should take advantage from the process oriented perspective, too. For instance, in order to assure productivity, chatting should not be forbidden, but the leng- th of a visit should be restrained to a maximum value. The objective of the classification is to remove waste and to improve all the other activities in terms of both e- fficiency and efficacy. To this aim the team should apply problem solving techniques to identify the root causes of the main problems and envisage efficient corrective ac- tions as the ones suggested in Table 2. Finally, the team has to define a set of lean metrics that will be used to measure the status quo, to establish targets for the improvement and to assess obtained results. The service Cycle Efficiency is the main lean metric and is defined as the proportion of time spent by a task (1) or by the whole process (2) in value added activities. Value Added Time Task Efficiency Cycle Time = (1) Total Value Added Time Service Efficiency Lead Time = (2) Ideally this metric should be one, but this target is un- realistic and, for most of the services, a cycle efficiency greater than 20% can be considered sufficient. Other lean metrics can also be useful to guide the im- provement and to assess the obtained results. Typical exa- mples are: 1) % of invoicing errors; 2) % of customer complaints; 3) throughput; 4) customer retention rate; 5) average waiting time, etc. 2.6. Map the Future State Future state mapping can be summarized in the four main steps described below. 2.6.1. Focus on Demand To define a lean, customer oriented process, one should truly understand customer’s demand and assess whether or not it can be met with the current staff/equipment. The easier way to do so is to evaluate the Takt Time (TT), being the rate (time) at which a product/person/document/ action should be served or completed to meet demand. et Available Time Takt Time Customer Demand = (3) Specifically, TT is used as the drumbeat of a lean pro- cess: if every step produces to the drumbeat, there will be no overproduction and work will not pile up. This value, in conjunction with the current production/service rates, can be used to analyze process loads, bottleneck and ex- cess capacity. The study will indicate which operations are ahead of demand rate and which ones are not, both indicating opportunities for improvement. Table 2. Wastes and corrective actions. Actions Main wastes tackled Other wastes 5 S Defects Inventory, Waiting Planned Break Motion, Defect Waiting Standardization Defects, Motion, Duplication Overproduction, Underutilized employees, Communication Visual Control Inventory, Overproduction Waiting Layout/Work Cells Motion, Transportation Waiting, Underutilized employees Continuous Flow Waiting, Inventory Overproduction Balancing Waiting Variation, Overproduction Levelling Overproduction, Variation Inventory Quick changeover Waiting Overproduction  Service Value Stream Management (SVSM): Developing Lean Thinking in the Service Industry Copyright © 2011 SciRes. JSSM 433 Quite surprisingly many people think that TT does not properly work in the service industry, because this is a medium-low volume, high variety environment. This is just a misbelieve since, de facto, the concept of TT was introduced by Toyota as a tool to deal with fluctuating volumes and variety [27]. As a matter of fact, the fluctua- tions in demand can be dampened out by taking a longer time period to base the calculations and/or conducting a service family analysis to define separate value streams. Evidently, the situation gets more complicated when, wi- thin the same family, there are huge variations in com- plexity and/or duration. Even in this case one can add a screening step to divert highly complex requests to a de- dicated value stream, or can compose packages of multi- ple transactions that, on average, will be processed at rou- ghly the same rate (as long as they are randomly com- posed). In the latter case, making a parallel with manu- facturing, these activities packages can be seen as the analogous of the pack out quantity and can be used to de- fine the true rhythm with which items will be moved a- long the value stream. This time, which is an integer mu- ltiple of the Takt is referred as Pitch and is computed as follows: ap PitchTTN=⋅ (4) where N ap is the practical number of multiple transact- tions included in an activity package. Applying TT is straightforward for those services (such as processing mortgage/loan applications, patent filings) that mimic production/assembly lines. In these cases, each line consists of people with computers or other tools to do the work, organized as workstations. Therefore, given the TT, one can easily determine the minimal num- ber of workstations (Wmin) needed to fulfil customer’s demand. This can be done by taking the sum of the cycle times of each step (CT i ) and dividing this quantity by the TT: I i i1 min CT WTT = =∑. (5) Furthermore, to account for time losses that could re- duce the ideal capacity of the workstations, another met- ric called Idle Time (IT) can be computed: I mini i1 ITWTTCT = =⋅− ∑ (6) where Wact is the actual number of work stations. However, TT may be of use also for those services that cannot be organized in the form of a line. Let us consider a call centre: this can be considered as a natural pull process because, due to a direct interaction between the customer and the provider, a drumbeat is not needed to synchronize production to the demand rate. Nonetheless, TT remains a useful tool to assure customer ’s satisfaction. It is easy to see that, besides the willingness and the cor- diality of the employees, the average waiting time is a good proxy of the customer satisfaction. Therefore, to please the customers, one could use as many employees as many simultaneous calls can be received; but this would inevitably lead to an unacceptable under-utiliza- tion of the workforce. A smarter way to please the cu- stomer assuring at the same time an evenly distributed workload is that to have the workers perform smaller tasks, but more often. Indeed, by dividing the process in- to smaller tasks with interim responses and lag time be- tween steps, one provides interaction with the customer and assures a sufficient utilization of the workforce. In the case of a call centre the research, the resolution and the response steps could be broken apart and handled by separate workers; an automated system could also be used to pre-process demand and to sort requests by skill required. It is here that TT comes into play, for it can be used to define the maximal duration of each task, to evaluate the number of workers (and/or the use of extra pooled resources for peak hours) and to categorize work- ers by length of time they can perform specific task types. For the business where lines are matter of facts, addi- tional metrics, other than TT, may be of use to fully un- derstand customer’s demand and to balance workloads in a proper way. Important attributes may be: 1) the avera- ge number of customers in the system; 2) the average waiting time in the line and 3) the queuing probability. As well known, these quantities can be easily obtained using discrete event simulation or queuing theory, pro- vided that the arrival rate [customers/hour] and the ser- vice rate [customer/hours] are known. 2.6.2. Focus on Flow At this point the team must analyze the wastes listed in the ACC and define suitable corrective actions. The goal should be that to re-configure the process in order to de- velop a continuous flow, free of errors and interruptions. Unfortunately, most of the times, service companies do not consider flow as a valid alternative and assume batch processing as the normal practice for an office [25]. Piles of work are sent to the downstream step creating long lead times and increasing the variability of the process. Although one-piece-flow is not always possible, the team should strain to identify the appropriate way to create flow by: Ÿ calculating the correct Tack and the right dimension of the activity packages (i.e. Pitch); Ÿ establishing multifunctional administrative teams orga- nized in production-like cells; Ÿ balancing workloads within the value stream; Ÿ assessing whether buffer inventories are needed; Ÿ specifying how to synchronize the flow.  Service Value Stream Management (SVSM): Developing Lean Thinking in the Service Industry Copyright © 2011 SciRes. JSSM 434 Note that sometimes buffers may be useful to increase flexibility and to reduce service time. Specifically, to generate an efficient service, both material and resource buffers should be considered as feasible options. If a company, such as a travel agency, provides standard ser- vices, then a certain amount of standard documents can be stocked (on the desk/shelves) to quickly respond to an increase of demand. On the other hand, if the service is highly personalized and necessitates the presence of the customer, as for an out-patient department, then the fluc- tuation of demand can be covered distributing extra per- sonnel where and when needed (i.e. using pool resour- ces), because, in these circumstances, staff skills and fle- xibility are the real buffer inventory. It is also worth noting how, assuring flow synchroni- zation may not be a major concern for many services. Indeed, most of the times services are pull in nature and customers are served with a Just in Time approach. In these cases the use of FIFO lanes (i.e. items are consu- med by the consuming process on a first-in first-out basis and the supplying process can produce only if authorized by the downstream process) is generally sufficient to coo- rdinate the flow. Kanban, electronic kanban or electronic workflow management systems can also be used to con- trol production at each step of the process. 2.6.3. Focus on Levelling Levelling production means designing a system in which information flow regarding customer demand is smoothly integrated with the flow of material through the value stream [22]. In the manufacturing industry, the basic idea is to produce intermediate goods at a constant rate to allow further processing to be carried out at a constant and predictable rate. Therefore, the main concept is to be able to assure the availability of a certain product at a certain time. The concept of levelling maintains the same meaning in those services that operate without the physical pre- sence of the customers, where a Heijunka system is gene- rally sufficient to respect/maintain the service mix re- quired (on average) by the end customer. Conversely, when the presence of the customer is needed, the situa- tion is more challenging. In this case, the concept of le- velling corresponds to the capability to assure a precise time for the issuing of the service and an efficient level- ling action can be obtained using appointments to sche- dule activities. If this is not possible, the team should devise, at least, a way to give to the customer precise and reliable information concerning the expected waiting time. Examples may be the use of queue barriers with ropes/straps of different colours (such as green, yellow and red) for different waiting times, or the use of queue ticket dispensers and electronic displays showing the main statistics of the queue. 3. Enrolment Centre Case Study Nowadays, concurrency among universities is getting stronger and stronger and teaching and research levels are not enough to attract new students. Consequently, the enrolment/orientation centre has become a strategic ele- ment, since it is paramount to transmit and idea of high efficiency and quality, as soon as prospective students visit the campus for the very first time. Owing to this issue, we decided to apply VSMS to im- prove the performance of the enrolment centre of an Ita- lian University. 3.1. Description of the Enrolment Process During the last term of the year, high school students are asked to express (with an on line form) their preferences, concerning the BSc courses they would like to attend. Although this step is optional, collected information ma- ke it possible to forecast the number of first year stu- dents and to dimension the enrolment centre. The main process starts with the compilation of an a- cceptance form, where prospective students specify their personal data and the selected BSc course. Next, an ope- rator checks the correctness of the data and makes sure that the candidates have all the required qualifications. In case of compliance, the operator stamps an acceptance form and students can proceed with the payment of the yearly fee. At the end of the transaction students are regi- stered in the university informative system and they re- ceive an identification number and the credentials for the access to the university network. Finally, after a period of three-five days, students can go to the delivery office where they collect their academic booklet, a magnetic card and a guide concerning the organization of the campus. 3.2. Team Formation and Current State Mapping A comprehensive team reflecting the needs of the mana- gement, of the employees and of the end customers, was recruited: 1) office manager as team leader; 2) didactic manager as value stream champion, 3) office employee and two BSc students as team members. After a three days seminar on lean techniques, organi- zed in partnership with the University, the team is ready to analyze the process and to identify any form of waste. To this aim the functioning of the enrolment centre had been monitored for two weeks in the middle of Septem- ber, when, due to a high rate of incoming demands (380 per days), the percentage of unsatisfied students com- plaining for a long waiting time, is maximal. Collected data are synthesized in the map of Figure 3, which shows: 1) Available Time (AvT); 2) Time Losses (TL); 3) Up Time (UT); 4) Cycle Time (CT); 5) Average Queuing Time (AQT); 6) Maximal Queuing Time (MQT) and 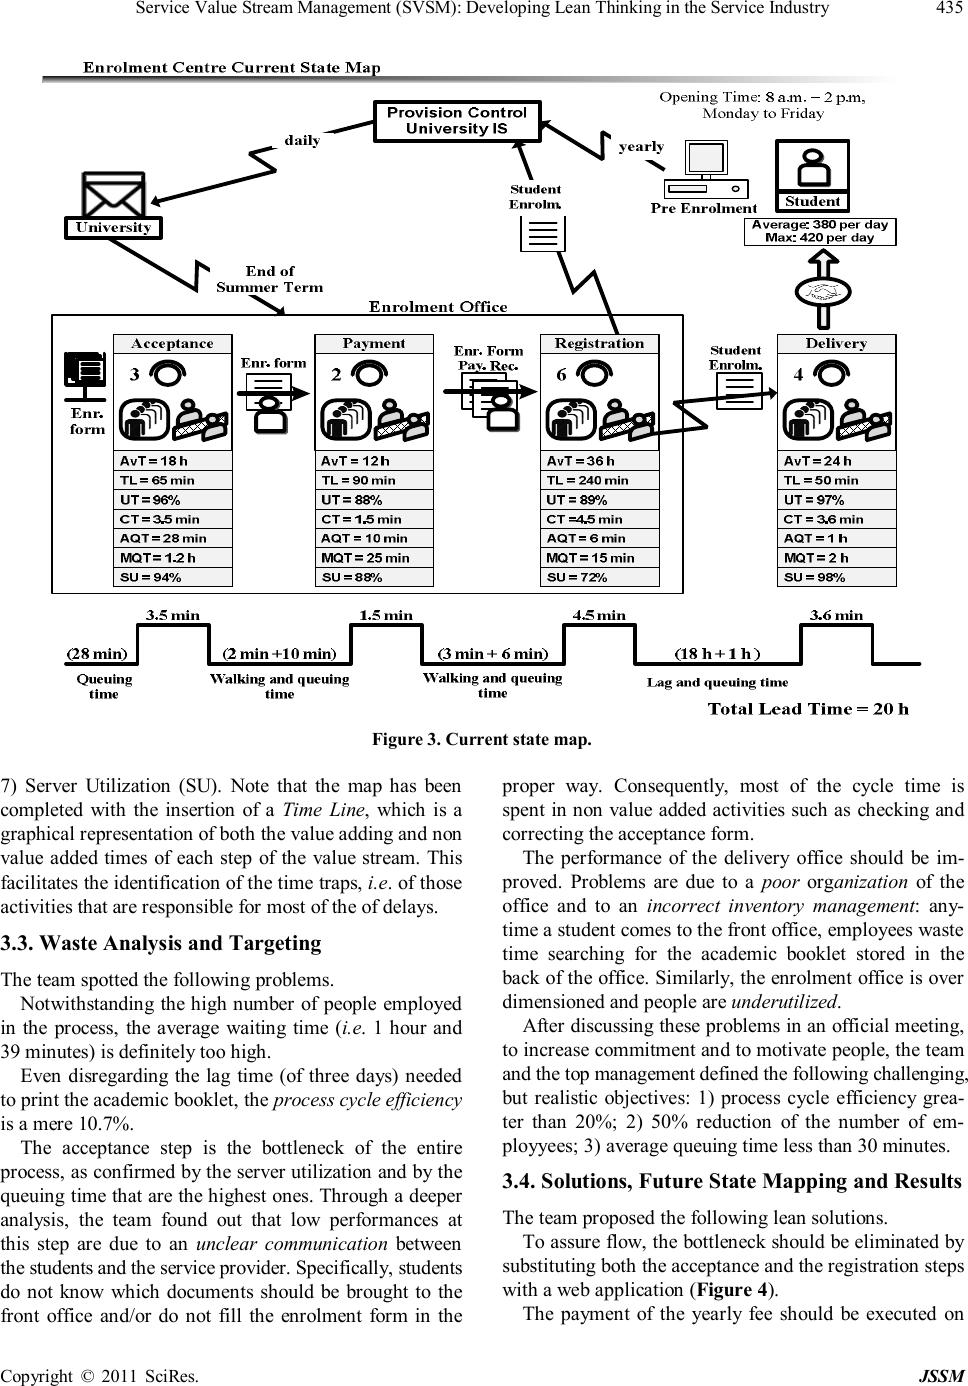 Service Value Stream Management (SVSM): Developing Lean Thinking in the Service Industry Copyright © 2011 SciRes. JSSM 435 Figure 3. Current state map. 7) Server Utilization (SU). Note that the map has been completed with the insertion of a Time Line, which is a graphical representation of both the value adding and non value added times of each step of the value stream. This facilitates the identification of the time traps, i.e. of those activities that are responsible for most of the of delays. 3.3. Waste Analysis and Targeting The team spotted the following problems. Notwithstanding the high number of people employed in the process, the average waiting time (i.e. 1 hour and 39 minutes) is definitely too high. Even disregarding the lag time (of three days) needed to print the academic booklet, the process cycle efficiency is a mere 10.7%. The acceptance step is the bottleneck of the entire process, as confirmed by the server utilization and by the queuing time that are the highest ones. Through a deeper analysis, the team found out that low performances at this step are due to an unclear communication between the students and the service provider. Specifically, students do not know which documents should be brought to the front office and/or do not fill the enrolment form in the proper way. Consequently, most of the cycle time is spent in non value added activities such as checking and correcting the acceptance form. The performance of the delivery office should be im- proved. Problems are due to a poor organization of the office and to an incorrect inventory management: any- time a student comes to the front office, employees waste time searching for the academic booklet stored in the back of the office. Similarly, the enrolment office is over dimensioned and people are underutilized. After discussing these problems in an official meeting, to increase commitment and to motivate people, the team and the top management defined the following challenging, but realistic objectives: 1) process cycle efficiency grea- ter than 20%; 2) 50% reduction of the number of em- ployyees; 3) average queuing time less than 30 minutes. 3.4. Solutions, Future State Mapping and Results The team proposed the following lean solutions. To assure flow, the bottleneck should be eliminated by substituting both the acceptance and the registration steps with a web application (Figure 4). The payment of the yearly fee should be executed on 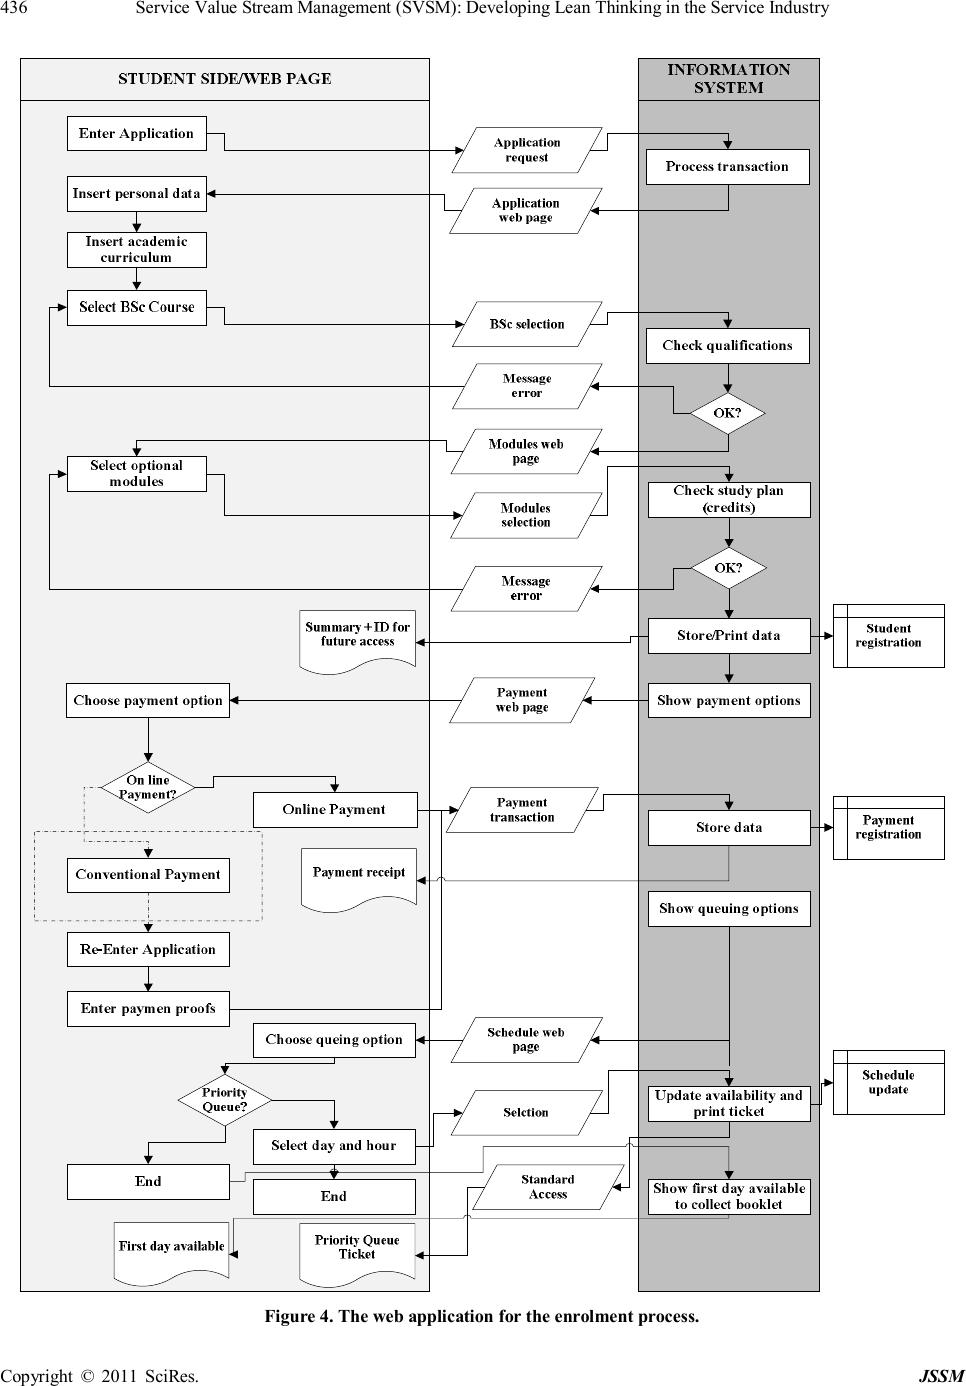 Service Value Stream Management (SVSM): Developing Lean Thinking in the Service Industry Copyright © 2011 SciRes. JSSM 436 Figure 4. The web application for the enrolment process. 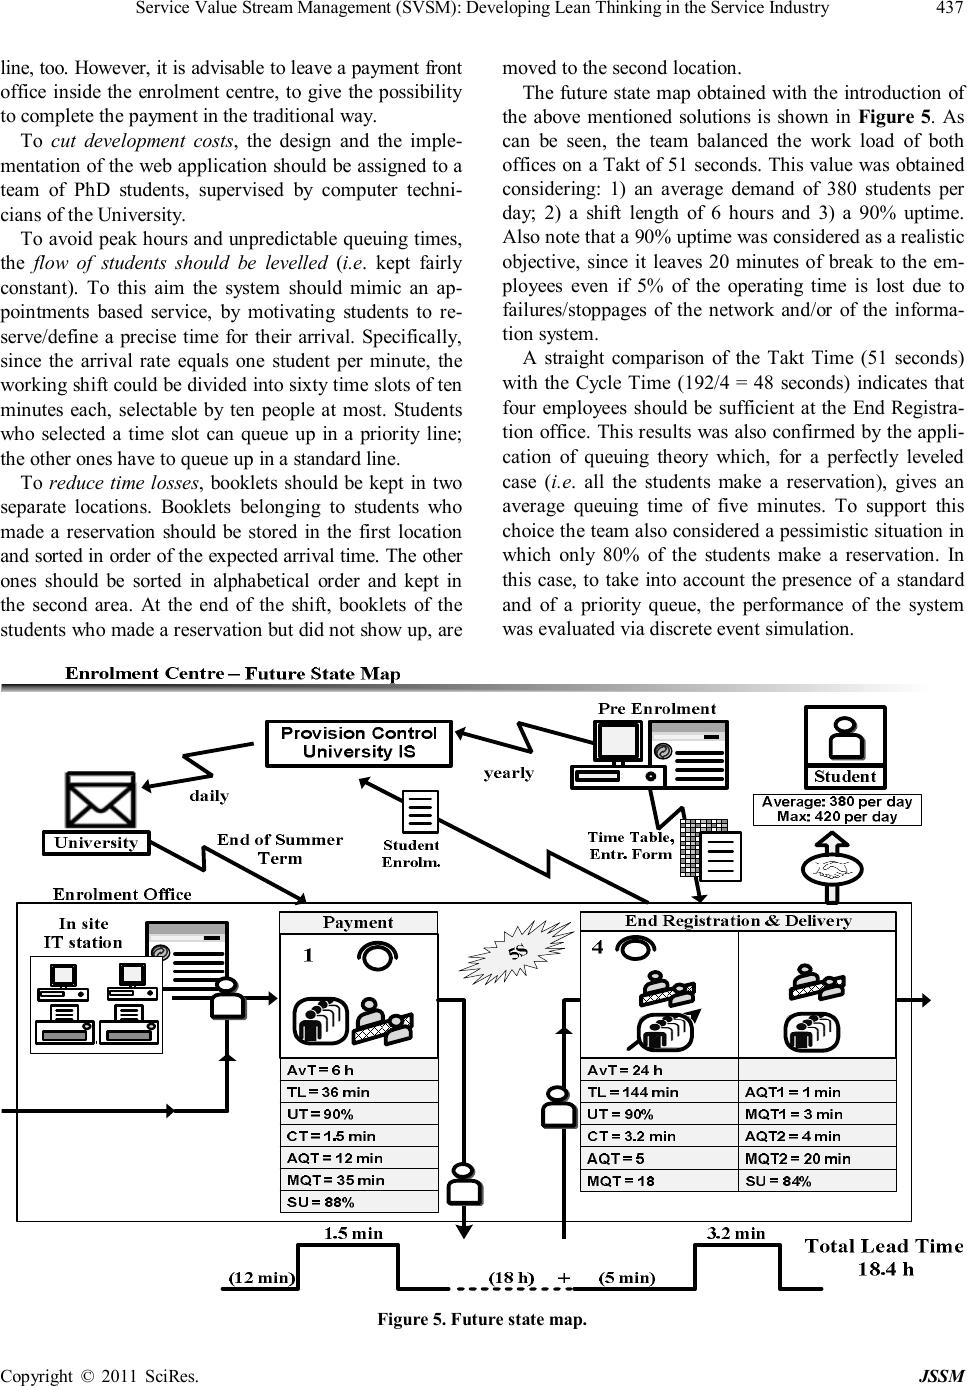 Service Value Stream Management (SVSM): Developing Lean Thinking in the Service Industry Copyright © 2011 SciRes. JSSM 437 line, too. However, it is advisable to leave a payment front office inside the enrolment centre, to give the possibility to complete the payment in the traditional way. To cut development costs, the design and the imple- mentation of the web application should be assigned to a team of PhD students, supervised by computer techni- cians of the University. To avoid peak hours and unpredictable queuing times, the flow of students should be levelled (i.e. kept fairly constant). To this aim the system should mimic an ap- pointments based service, by motivating students to re- serve/define a precise time for their arrival. Specifically, since the arrival rate equals one student per minute, the working shift could be divided into sixty time slots of ten minutes each, selectable by ten people at most. Students who selected a time slot can queue up in a priority line; the other ones have to queue up in a standard line. To reduce time losses, booklets should be kept in two separate locations. Booklets belonging to students who made a reservation should be stored in the first location and sorted in order of the expected arrival time. The other ones should be sorted in alphabetical order and kept in the second area. At the end of the shift, booklets of the students who made a reservation but did not show up, are moved to the second location. The future state map obtained with the introduction of the above mentioned solutions is shown in Figure 5. As can be seen, the team balanced the work load of both offices on a Takt of 51 seconds. This value was obtained considering: 1) an average demand of 380 students per day; 2) a shift length of 6 hours and 3) a 90% uptime. Also note that a 90% uptime was considered as a realistic objective, since it leaves 20 minutes of break to the em- ployees even if 5% of the operating time is lost due to failures/stoppages of the network and/or of the informa- tion system. A straight comparison of the Takt Time (51 seconds) with the Cycle Time (192/4 = 48 seconds) indicates that four employees should be sufficient at the End Registra- tion office. This results was also confirmed by the appli- cation of queuing theory which, for a perfectly leveled case (i.e. all the students make a reservation), gives an average queuing time of five minutes. To support this choice the team also considered a pessimistic situation in which only 80% of the students make a reservation. In this case, to take into account the presence of a standard and of a priority queue, the performance of the system was evaluated via discrete event simulation. Figure 5. Future state map.  Service Value Stream Management (SVSM): Developing Lean Thinking in the Service Industry Copyright © 2011 SciRes. JSSM 438 Average and a maximal values of 1 and 3 minutes and of 4 and 20 minutes for the priority and for the standard queue were found, respectively. By operating in a similar way, a single employee was considered enough to mana- ge the payment front office. Indeed, by assuming that more than 50% of the students will opt for the on-line payment, the cycle time of the payment office (i.e. 90 seconds) remains lower than the corrected Takt Time (i.e. 51/0.5 = 102) even in the worst case. Also this value was validated applying both queuing theory and discrete event simulation. This also permitted to obtain estimations of the average and of the maximum queuing time of 12 and 35 minutes, respectively. As clearly demonstrated by the future state map, all the targets for the improvement can be achieved by means of the above mentioned lean so- lutions. Indeed: 1) the whole process can be managed by 5 employees only; 2) the average queuing time has been reduced to 17 minutes (or 5 minutes, if the payment is made on line); 3) the process cycle efficiency is equal to 4.7/21.7 = 21.6% (or 3.2/8.2 = 39%, if the payment is made on line). 4. Conclusions and Future Works This paper has demonstrated that lean thinking has the potentialities to be implemented in the service industry as an effective way to cut costs and to increase customer ’s satisfaction. Clearly, due to the consistent differences between the manufacturing and the service industry, applying lean to services is challenging and lean concepts must be often reinterpreted and/or redefined in a proper way. To solve these problems, a new approach called Service Value Stream Management (SVSM) has been developed. The approach is flexible in nature and can be applied to a wide range of different cases, from quasi manufacturing to pure service processes. This, which is certainly an advantage of the method, could also be considered as one of its limits. Indeed, due to the variety of the processes and of the problems that can be encountered in the service industry, it was not possible to include in the approach a collection of opera- ting and readily applicable (lean) solutions. Instead, SVMS is based on a set of conceptual and generic principles organized in a structured framework, which can be used as a roadmap to develop a true lean service. Considering these issues, at the expense of a loss of flexibility, it could be interesting to increase the practicality of the approach by tailoring it to the requirements of specific sectors such as the healthcare or the banking services. In this way it would be possible to extend the level of detail and to associate to each (lean) principle of the framework a collection of best practice solutions that could be rea- dily implemented in practical settings. REFERENCES [1] D. Tapping, “The Lean Office Pocket Guide: Tools for the Elimination of Waste in Administrative Areas,” MCS Media, Inc., 2005. [2] H. Acland, “Disaffected Nation,” Marketing, Vol. 8, 2005, pp. 32-35. [3] D. Dickson, R. Ford and B. Laval, “Top Ten Excuses for Bad Service,” Organisational Dynamics, Vol. 34, No. 2, 2005, pp. 168-204. doi:10.1016/j.orgdyn.2005.03.001 [4] J. Maleyeff, “Exploration of Internal Service Systems Us- ing Lean Principles,” Management Decision, Vol. 44, No. 5, 2006, pp. 674-689. doi:10.1108/00251740610668914 [5] F. Abdi, S. Shavarini and S. Hoseini, “Glean Lean: How to Use Lean Approach in Services Industries?” Journal of Services Research, Vol. 6, Special Issue, 2006, pp. 191- 206. [6] B. Ehrlich, “Service with a Smile: Lean Solutions Extend Beyond the Factory Floor,” Industrial Engineer, Vol. 38, No. 8, 2006, pp. 40-44. [7] P. Hines, M. Holweg and N. Rich, “Learning to Evolve: A Review of Contemporary Lean Thinking,” International Journal of Operations & Production Management, Vol. 24, No. 10, 2004, pp. 994-1011. doi:10.1108/01443570410558049 [8] S. Bashin and P. Burcher, “Lean Viewed as a Philoso- phy,” Journal of Manufacturing technology Management, Vol. 17, No. 1, 2006, pp. 56-72. doi:10.1108/17410380610639506 [9] Y. C. Wu, “Lean Manufacturing: A Perspective of Lean Suppliers, ” International Journal of Operations & Produ- ction Management, Vol. 23, No. 11, 2003, pp. 1349-1376. doi:10.1108/01443570310501880 [10] P. Hines, A. L. Martins and J. Beale, “Testing the Boundaries of Lean Thinking: Observation from the Le- gal Service Sector,” Public money & management, Vol. 28, No. 1, 2008, pp. 35-40. [11] K. Juroff, “Lean it’s not Just for the Shop Floor Any- more,” Automotive Industries , Vol. 183, No. 12, 2003, p. 45. [12] P. Hines and N. Rich, “The Seven Value Stream Mapping Tools,” International Journal of Operations & Produc- tion Management, Vol. 17, No. 1, 1997, pp. 46-64. doi:10.1108/01443579710157989 [13] M. Emiliani, “Cracking the Code of Business,” Manage- ment Decision, Vol. 38, 2000, pp. 60-79. doi:10.1108/00251740010317423 [14] N. Piercy and N. Rich, “Lean Transformation in the Pure Service Environment: The Case of the Call Service Cen- ter,” International Journal of Operations & Production Management, Vol. 29, No. 1, 2009, pp. 54-76. doi:10.1108/01443570910925361 [15] M. Braglia, G. Carmignani and F. Zammori, “A New Va- lue Stream Mapping Approach for Complex Production Systems,” International Journal of Production Research, Vol. 44, No. 18-19, 2006, pp. 3929-3952.  Service Value Stream Management (SVSM): Developing Lean Thinking in the Service Industry Copyright © 2011 SciRes. JSSM 439 doi:10.1080/00207540600690545 [16] J. Bicheno and M. Holweg, “The Lean Toolbox: The Essen- tial Guide to Lean Transformation,” Picsie Books, Buc- kingham, 2009. [17] B. Kollberg, J. Dahlgaard and P. Brehmer, “Measuring Lean Initiatives in Health Care Services: Issues and Find- ings,” International Journal of Productivity and Perfor- mance Management, Vol. 56, No. 1, 2007, pp. 7-24. doi:10.1108/17410400710717064 [18] D. Sarkar, “Lean for Service Organizations and Offices: A Holistic Approach for Achieving Operational Excel- lence and Improvements,” Quality Press, Milwaukee, 2007. [19] I. Serrano, C. Ochoa and R. De Castro, “An Evaluation of the Value Stream Mapping Tool,” Business Process Ma- nagement Journal, Vol. 14, No. 1, 2008, pp. 39-52. doi:10.1108/14637150810849391 [20] B. Singh, S. K. Garg and S. K. Sharma, “Value Stream Mapping: Literature Review and Implications for Indian Industry,” The international Journal of Advanced Manu- facturing Technology, Vol. 53, No. 5-8, 2010, pp. 799- 809. doi:10.1007/s00170-010-2860-7 [21] P. Hines, N. Rich, J. Bicheno, D. Brunt, D. Taylor, C. Butterworth and J. Sullivan, “Value Stream Manage- ment,” The International Journal of Logistic Management, Vol. 9, No. 1, 1998, pp. 25-42. doi:10.1108/09574099810805726 [22] M. Braglia, M. Frosolini and F. Zammori, “Uncertainty in Value Stream Mapping Analysis,” International Journal of Logistic: Research and Application, Vol. 12, No. 6, 2009, pp. 435-453. doi:10.1080/13675560802601559 [23] M. L. Emiliani and D. J. Stec, “Using Value-Stream Maps to Improve Leadership,” The leadership & Or- ganization Development Journal, Vol. 25, No. 8, 2004, pp. 622-645. doi:10.1108/01437730410564979 [24] F. Holmes, “Is Your Office as Lean as Your Production Line?” Manufacturing Engineering, Vol. 139, No. 3, 2007, pp. 20-21. [25] C. Canel, D. Rosen and E. A. Ancerson, “Just-in-Time is not just for Manufacturing: A Service Perspective,” In- dustrial Management & Data Systems, Vol. 100, No. 2, 2000, pp. 51-60. [26] Y. Monden, “Toyota Production System: An Integrated Approach to Just-in-Time,” 2nd Edition, Industrial Engi- neering and Management Press, Norcross, 1993.
|