Paper Menu >>
Journal Menu >>
 Construction and control of genetic regulatory networks:a multivariate Markov chain approach Construction and control of genetic regulatory networks:a multivariate Markov chain approach 1223 4 Shu-Qin Zhang, Wai-Ki Ching, Yue Jiao, Ling-Yun Wu &Raymond H. Chan 1 2 School of Mathematical Sciences, Fudan University, Shanghai, 200433, China. Advanced Modeling and Applied Computing Laboratory, 3 Department of Mathematics, The University of Hong Kong, Pokfulam Road, Hong Kong.Institute of Applied Mathematics, Academy of 4 Mathematics and System Sciences, Chinese Academy of Sciences.Department of Mathematics, the Chinese University of Hong Kong, Shatin, N.T., Hong Kong. * Correspondence should be addressed to Shu-Qin Zhang (zhangs@fudan.edu.cn). [1,2,4,11,15,16,17,21] have been proposed. Among ABSTRACT all the models, BNs and PBNs have received much attention. The approach is to model the genetic regu- In the post-genomic era, the construction and latory system by a Boolean network and infer the net- control of genetic regulatory networks using work structure from real gene expression data. Then gene expression data is a hot research topic.by using the inferred network model, the underlying Boolean networks (BNs) and its extensiongene regulatory mechanisms can be uncovered. This Probabilistic Boolean Networks (PBNs) have is particularly useful as it helps to make useful pre- been served as an effective tool for this pur-dictions by computer simulations. We refer readers to pose. However, PBNs are difficult to be used the survey paper by Shmulevich et al. [18, 19] and the in practice when the number of genes is large book by Shmulevich and Dougherty [20]. because of the huge computational cost.In thisThe BN model was first introduced by Kauffman paper, we propose a simplified multivariate Markov [12, 13, 14]. The advantages of this model can be model for approximating a PBN. The new modelfound in Akutsuet al. [1], Kauffman [14] and can preserve the strength of PBNs, the abilitytoShmulevich et al. [17]. Since genes exhibit switching capture the inter-dependence of the genes in thebehavior [10], BN models have received much atten- network, and at the same time reduce the com-tion. In a BN, each gene is regarded as a vertex of the plexity of the network and therefore the compu-network and is quantized into two levels only (ex- tational cost. We then present an optimal con-pressed (1) or unexpressed (0)). We remark that the trol model with hard constraints for the purposeidea and the model can be extended easily to the case of control/intervention of a genetic regulatoryof more than two states. The target gene is predicted network. Numerical experimental examples based by several genes called its input genes through a on the yeast data are given to demonstrate the Boolean function. If the input genes and the Boolean effectiveness of our proposed model and control functions are given, a BN is defined. The only ran- policy. domness involved here is the initial system state. However, the biological system has its stochastic nature and the microarray data sets used to infer the network structure are usually not accurate because of the experimental noise in the complex measurement process. Thus stochastic models are more reasonable 1. INTRODUCTIONchoices. To overcome the deterministic nature of a An important issue in systems biology is to under-BN, Akutsuet al. [1] proposed the noisy Boolean net- stand the mechanism in which cells execute and con-works together with an identification algorithm. In trol a huge number of operations for normal functions, their model, they relax the requirement of consis- and also the way in which the cellular systems fail in tency imposed by the Boolean functions. Regarding disease, eventually to design some control strategy to the effectiveness of a Boolean formalism, Shmulevich avoid the undesirable state/situation. Many mathe-et al. [17] proposed a PBN that can share the appeal- matical models such as neural networks, linear model, ing rule-based properties of Boolean networks and it Bayesian networks, non-linear ordinary differentialis robust in the presence of uncertainty. The model equations, Petri nets, Boolean Networks (BNs) andparameters can be estimated by using Coefficient of its generalization Probabilistic Boolean Networks Determination (COD) [8]. (PBNs), multivariate Markov chain model etc. Keywords: Gene expression sequences; Multivariate Markov chain; Optimal control policy; Probabilistic Boolean networks J. Biomedical Science and Engineering, 2008, 1, 15-21Scientific Research Publishing JBiSE Published Online May 2008 in SciRes.http://www.srpublishing.org/journal/jbise SciRes Copyright ©2008  (ij) The dynamics of the PBN can be studied in the con-Gene i. The matrixP is a transition probability text of standard Markov chain [17, 18, 19]. Thismatrix for the transitions of states in Sequence j to makes the analysis of the network easy. However, thestates in Sequencei in one step, see for instance [3]. number of parameters (state of the system) grows In matrix form we have exponentially with respect to the number of genes n. Therefore it is natural to develop heuristic methods for model training or to consider other approximate model. Here we propose a simplified multivariate Markov model, which can capture both the intra- and inter-associations (transition probabilities) among the gene expression sequences. The number of 2 parameters in the model is onlyO(n) wheren is thewhere number of genes in a captured network. We remark that this order is already minimal. We then develop efficient model parameters estimation methods based on linear programming. We further propose an opti- mal control formulation for regulating the network so as to avoid some undesirable states which may corre- spond to some disease like cancer. The rest of the paper is structured as follows. In section 2, we present the simplified multivariate We note that the column sum ofQ is not equal to one Markov model. In section 3, the estimation method(ij) (the column sum of each P is equal to one). The fol- for model parameters is given. In section 4, an opti- lowings are two propositions [3] related to some prop- mal control formulation is proposed. In section 5, we erties of the model. apply the proposed model and method to some syn- Proposition 2.1 If 0 for 1i,jn , then the matrix thetic examples and also the gene expression dataset ij of yeast. Concluding remarks are then given to Q has an eigenvalue equal to 1 and the eigenvalues ofQ address further research issues in section 6. have modulus less than or equal to 1. (ij) Proposition 2.2 Suppose that P (1i,jn ) are 2. THE MULTIVARIATE MARKOV irreducible and0 for 1i,jn . Then there is ij CHAIN MODELa vector In this section, we first review a multivariate Markov chain model proposed in Ching, et al. [3] for model- ing categorical time series data. We remark that the model has been first applied to predicting demand of inventory of correlated products. Later the model such that was applied to the building of genetic regulatory net- works [4] from gene expression data. However, the number of parameters is still large and further reduc- tion of the model parameters is necessary and a sim-and plified model was proposed in [5]. In the remainder of this section, we present the simplified multivariate Markov chain model. Givenn categorical time sequences, we assume they share the same state spaceM. We denote the where m is the number of states. (ij) state probability distribution of Sequence j at timetIn Proposition 2.2, we require allP are irreduc- (j) byV,j=1,2, ,n . In Ching, et al. [3], the following ible. But actually, if Q is irreducible, we can get the t same conclusion. If the model is applied to gene first-order model was proposed to model the relation- expression data sequences, one may takeM={0,1} ships among the sequences: (i) and V to be the expression level of the i-th gene at t the time t. From (1), the expression probability distri- bution of the i-th gene at time (t+1) depends on the (ij)(j) weighted average of PV. We remark that this is a Where t first-order model and actually give the weighting ij of how much Geneidepends on Gene j. In Ching, et al. [4], this model has been used to find cell cycles. The most proper parent genes for the i-th gene Here is the non-negative weighting of Genej to (i) ij (i.e.,V) can be retrieved from the corresponding t+1 (1) (2) SciRes JBiSECopyright © 2008 16S.Q. Zhanget al./J. Biomedical Science and Engineering 1 (2008) 15-21  . The higher the value of , the stronger the par- ijij rence of each gene and we denote it by ent and child relationship between i-th andj-th gene will be. When this process is repeated for each j, the whole genetic network can be constructed. Given a We therefore expect that set of genes If for any gene in this set, the rest genes are the only candidates being a corresponding parent gene, then this set of genes forms a cycle. A simplified model was proposed in Chinget al. [5] by assuming From the above equation, it suggests one possible V way to estimate the parameters ={ } as follows: ij The simplified model has smaller number of parameters and it has been shown to be statistically better in terms of BIC, see for instance [5]. Moreover, Propositions 1 and 2 still hold for the simplified model. subject to 3. ESTIMATION OF MODEL PARAME- TERS (ij) In this section, we present methods to estimate P and . We estimate the transition probability matrix ij We note that the following formulation ofn linear (ij)programming problems can give the necessary solu- P by the following method. First we count the tran-tions of Problem (4). For eachi: sition frequency of the states in the i-th sequence. After making a normalization, we obtain an estimate of the transition probability matrix. We have to esti- mate n such m-by-mtransition probability matrices to Subject to (ij) get the estimate forP as follows: Where (ij)(ij) From F, one can obtain the estimate for P as follows: and V Hereis thei-th row of . ij We remark that the estimation method can be applied to the simplified model (3). We remark that .. Where other vector norms such as and can also be 1 2 used but they have different characteristics. The for- mer will result in a quadratic programming problem while will still result in a linear programming problem. The main computation cost comes from solv- ing the linear programming problem. In the estima- tion of , it involves only counting frequencies of transitions and therefore the cost is minimal. Once Besides , we need to estimate the parameters . ij the model parameters are available, one can then con- It can be shown that the multivariate Markov model struct the underlying genetic network easily. We will has a “stationary vector”V in Proposition 2. The vec-demonstrate this in the section of numerical exam- torV can be estimated from the gene expression ples. The model can also be further modified to sequences by computing the proportion of the occur-include extra conditions such as someare known ij SciRes JBiSECopyright © 2008 17 S.Q. Zhanget al./J. Biomedical Science and Engineering 1 (2008) 15-21 (3) (5) (4)  where v(iiirepresents all the possible net- to be zero. Such information can be included by add-tt-11 ing the constraints=0 . Furthermore, for large net-work state probability distribution vectors up to time ij t. We define work, it is known that the in-degree follows the Pois- son distribution while the out-degree follows the power-law, i.e., the number of out-degree to some negative power. These important properties can also be easily included in our proposed model [24]. 4. THE OPTIMAL CONTROL FORMU-to be the set which contains all the possible state prob- LATION ability vectors up to time t. We note that one can con- In this section, we present the optimal control prob-duct a forward calculation to compute allthe possible lem based on the simplified multivariate Markov statevectorsinthe setsU(1),U(2), U(T) recursively. model (3) and formulate it based on the principle ofHere the main computational cost is the matrix- 2 dynamic programming. In the simplified model (3) vector multiplication and the cost isO((2n) ) wheren we proposed above, the matrix Q can be regarded as a is the number of genes in the network. We note that “transition probability matrix” for the multivariatesome state probability distribution actually does not Markov chain in certain sense, andV can be regarded texist because the maximum number of controls is K, as a joint state distribution vector. We then present athe total number of vectors involved is only control model based on the paper by Ching,et al.[6]. Beginning with an initial joint probability distribu- tion V the gene regulatory network (or the multivariate 0 Markov chain) evolves according to two possible tran-For example ifK=1, the complexity of the above algo- sition probability matricesQ and Q. Without any 2 01 rithm is O(T(2n)). external control, we assume that the multivariate Returning to our original problem, our purpose is Markov chain evolves according to a fixed transitionto make the system go to the desirable states. The probability matrix Q (Q). When a control is 0objective here is to minimize the overall average of applied to the network at one time step, the Markovthe distances of the state vectorsv(ii) (t=1,2, ,T) t1 chain will evolve according to another transition to the target vectorz, i.e., probability Q (with more favorable steady states or a 1 more favorable state distribution). It will then return back to Q again if there is no control. We note that 0 one can have more than one type of controls, i.e., To solve (6), we have to define the following cost more than one transition probability matrixQ to 1function choose in each time step. For instance, in order to sup- press the expression of a particular gene, one can directly toggle off this gene. One may achieve the goal indirectly by means of controlling its parent as the minimum total distance to the terminal state genes which have a primary impact on its expression at timeT when beginning with state distribution vec- too. But for the simplicity of discussion, we assume torv(w) at timet and that the number of controls that there is only one direct possible control here. Wet then suppose that the maximum number of controls used is k. HereW is a Boolean string of lengtht. t that can be applied to the network during a finite Given the initial state of the system, the optimization investigation periodT(finite-horizon) is K where problem can be formulated as: KT. The objective here is to find an optimal control policy such that the state of the network is close to a target state vector Z. Without loss of generality, here we focus on the first gene among all the genes. (1) subject to: Accordingly, we remark that the sub-vector Z denotes the vector containing the first two entries in Z. It can be a unit vector (a desirable state) or a prob- ability distribution (a weighted average of desirable states). The control system is modeled as: To solve the optimization problem, one may con- sider the following dynamic programming formula- tion: SciRes JBiSE Copyright © 2008 18 S.Q. Zhanget al./J. Biomedical Science and Engineering 1 (2008) 15-21 (7) (6) 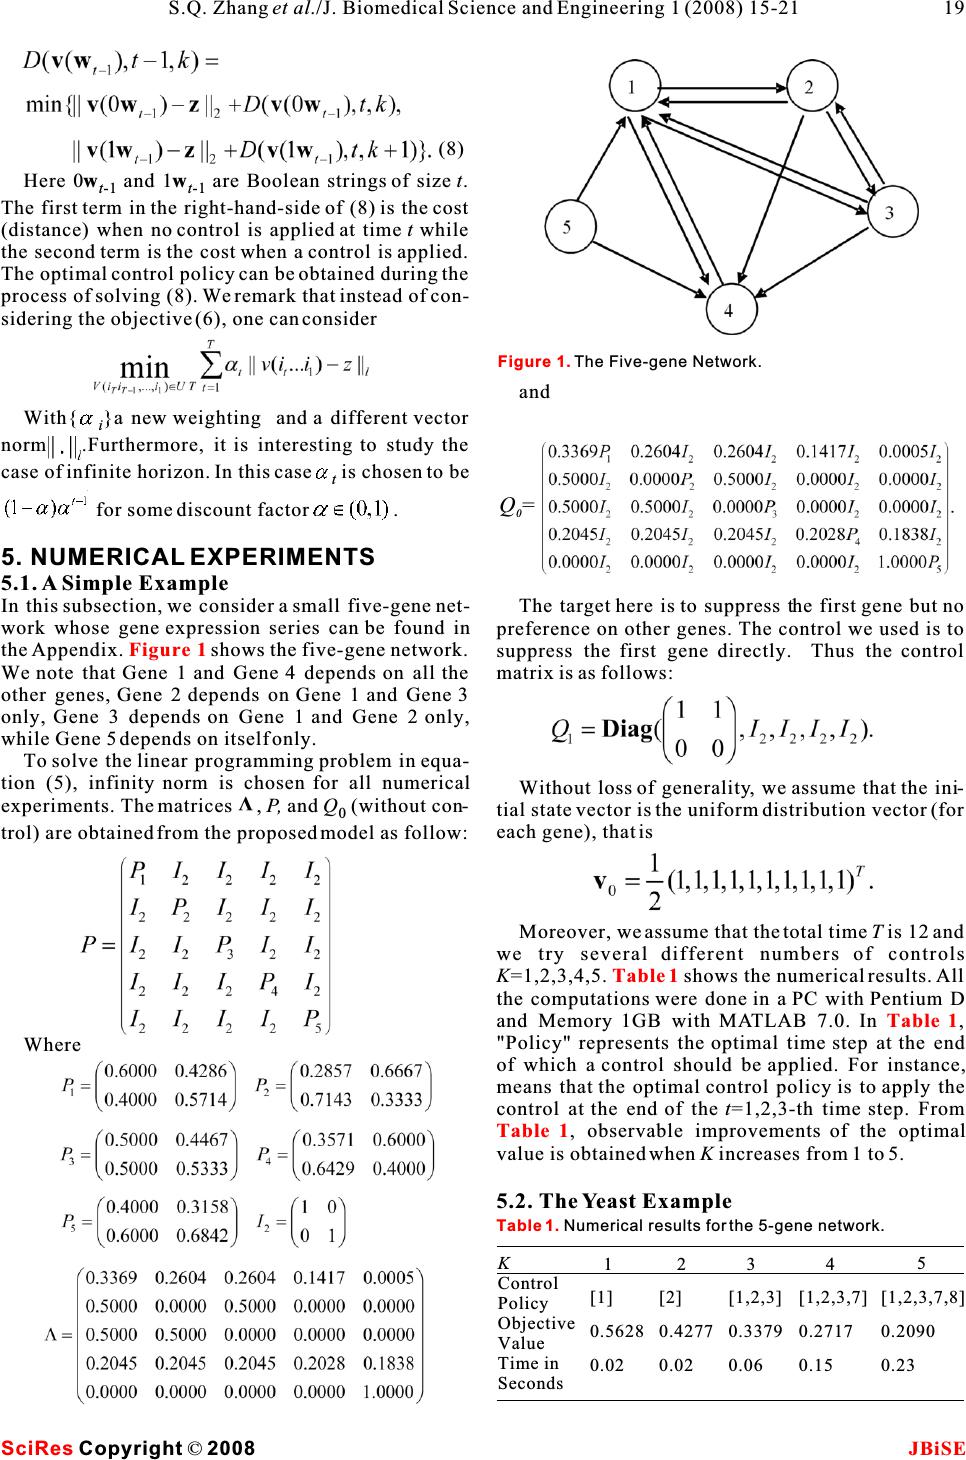 Here 0w and 1w are Boolean strings of size t. t-1 t-1 The first term in the right-hand-side of (8) is the cost (distance) when no control is applied at timet while the second term is the cost when a control is applied. The optimal control policy can be obtained during the process of solving (8). We remark that instead of con- sidering the objective (6), one can consider and With{}a new weighting and a different vector i . norm .Furthermore, it is interesting to study the l case of infinite horizon. In this caseis chosen to be t t-1 (1-) for some discount factor(0,1). 5. NUMERICAL EXPERIMENTS 5.1.A Simple Example In this subsection, we consider a small five-gene net-The target here is to suppress the first gene but no work whose gene expression series can be found inpreference on other genes. The control we used is to the Appendix.showsthefive-gene network.suppress the first gene directly. Thus the control We note that Gene 1 and Gene 4 depends on all the matrix is as follows: other genes, Gene 2 depends on Gene 1 and Gene 3 only, Gene 3 depends on Gene 1 and Gene 2 only, while Gene 5 depends on itself only. To solve the linear programming problem in equa- tion (5), infinity norm is chosen for all numericalWithout loss of generality, we assume that the ini- V experiments. The matrices , P, and Q (without con-tial state vector is the uniform distribution vector (for 0 trol) are obtained from the proposed model as follow:each gene), that is Moreover, we assume that the total time T is 12 and we try several different numbers of controls K=1,2,3,4,5.shows the numerical results. All the computations were done in a PC with Pentium D and Memory 1GB with MATLAB 7.0. In , "Policy" represents the optimal time step at the end Where of which a control should be applied. For instance, means that the optimal control policy is to apply the control at the end of thet=1,2,3-th time step. From , observable improvements of the optimal value is obtained when K increases from 1 to 5. 5.2. The Yeast Example Figure 1 Table 1 Table 1 Table 1 Figure 1. The Five-gene Network. Table 1.Numerical results for the 5-gene network. K Control Policy Objective Value Time in Seconds 1 [1] 0.5628 0.02 2 [2] 0.4277 0.02 3 [1,2,3] 0.3379 0.06 4 [1,2,3,7] 0.2717 0.15 5 [1,2,3,7,8] 0.2090 0.23 SciRes JBiSE Copyright © 2008 19 S.Q. Zhanget al./J. Biomedical Science and Engineering 1 (2008) 15-21 (8) Q= 0  In this subsection, we apply our proposed simplified first gene in the first 4 steps, and will not control it in multivariate Markov models to the yeast data other steps.These experiments show that even the sequences [23]. Genome transcriptional analysis is number of genes (384 genes in this data set) is com- animportant analysis in medicine, etiology andparatively large, the method still can find the control bioinformatics. One of the applications of genome policies fast. transcriptional analysis is used for eukaryotic cell cycle in yeast. The fundamental periodicity in 6. CONCLUDING REMARKS eukaryotic cell cycle includes the events of DNA rep-In this paper, we proposed a simplified multivariate lication, chromosome segregation and mitosis. It is Markov model for approximating PBNs. Efficient suggested that improper cell cycle regulation leads to estimation methods based on linear programming genomic instability, especially in the etiology of both method are presented to obtain the model parameters. hereditary and spontaneous cancers [9, 22]. Eventu-Methods for recovering the structure and rules of a ally, it is believed to play one of the important roles PBN are also illustrated in details. We then give an in the etiology of both hereditary and spontaneousoptimal control formulation for control the network. cancers. The dataset used in our study is the selected Numerical experiments on synthetic data and gene set from Yeung and Ruzzo (2001) [23]. In the expression data of yeast are given to demonstrate the discretization, if an expression level is above (below)effectiveness of our proposed model and formulation. a certain standard deviation from the average expres-For future research, we will extend the control sion of the gene, it is over-expressed (under-problem to the case of having multiple control policy. expressed) and the corresponding state is 1 (0) [4]. We will develop efficient heuristic methods for solv- To solve the linear programming problem in (5), ing the control problem and genetic algorithm is a infinity norm is chosen for all numerical experiments. V possible approach [7]. Extension of the study to the The matrices ,P ,andQ (without control) are 0case of infinite horizon is also interesting. Finally, obtained from the proposed model. The initial statewe will also apply our model to more real world vector is assumed to be the uniform distribution (for datasets. each gene) vector APPENDIX The five gene expression sequences. In addition, we assume that the total time T is 12 and several different maximum numbers of controls K=1,2,3,4,5 are tried in our numerical experiments. The target is to suppress the first gene but no prefer- (1) ence on other genes. That is the target state vectorZ T is (1,0) . The control we used is to suppress the first gene directly. Thus the control matrixQ takes the 1 same form as the following: ACKNOWLEDGEMENTS Research supported in part by RGC Grants 7017/07P and HKU CRCG Grants. The preliminary version of the paper has been pub- lished in the proceedings of the 2nd International Conference on Bioinformatics and Biomedical Engineering, Shanghai, China, It means that we want to control the first gene such 2008. that it will be unexpressed with more probabilities. The transitions of all the other genes will not beREFERENENCE changed.reports the numerical results and [1]T.Akutsu, S. Miyano & S. Kuhara. Inferring Qualitative Rela- the computational time for different numbers of con-tions in Genetic Networks and Metabolic Arrays. Bioinformatics 2000, 16: 727-734. trolsK. From, observable improvements of[2]J. Bower.Computational Modeling of Genetic and Biochemical the optimal value is obtained whenK increases fromNetworks.MIT Press, Cambridge 2001, M.A. 1 to 5. For example, if we will conduct 4 controls [3]Ching, W., E. Fung & M. Ng. A multivariate Markov Chain totally in the 12 time steps, we need to suppress theModel for Categorical Data Sequences and Its Applications in Demand Predictions. IMA Journal of Management Mathemat- ics 2002, 13: 187-199. [4]Ching, W., E. Fung, M. Ng & T. Akutsu. On Construction of Sto- chastic Genetic Networks Based on Gene Expression Sequences.International Journal of Neural Systems 2005, 15: 297-310. [5]Ching, W., Zhang, S., & M. Ng. On Multi-dimensional Markov Chain Models. Pacific Journal of Optimization 2007, 3: 235- 243. [6]Ching, W., Zhang, S., Jiao, Y., T. Akutsu & Wong, A.Optimal Finite-Horizon Control for Probabilistic Boolean Networks Table 2 Table 2 SciRes JBiSE Copyright © 2008 Table 2. Numerical results for the yeast data set. K Control Policy Objective Value Time in Seconds 1 [1] 0.6430 4.00 2 [2] 0.5751 20.60 3 [1,2,3] 0.5165 67.90 4 [1,2,3,4] 0.4582 152.88 5 [1,2,3,4,5] 0.4000 245.95 20S.Q. Zhanget al./J. Biomedical Science and Engineering 1 (2008) 15-21  with Hard Constraints.The International Symposium on Opti- mization and Systems Biology 2007. [7]Ching, W., H. Leung, Tsing, N. & Zhang, S. Optimal Control for Probabilistic Boolean Networks : Genetic Algorithm Approach, 2008. [8]E. Dougherty, S. Kim & Chen, Y. Coefficient of Determination in Nonlinear Signal Processing. Signal Processing2000, 80: 2219-2235. [9]M. Hall, & G. Peters. Genetic Alterations of Cyclins, Cyclin- dependent Kinases, and Cdk Inhibitors in Human Cancer.Adv. Cancer Res. 1996, 68: 67-108. [10]Huang, S. & D.E. Ingber. Shape-dependent Control of Cell Growth, Differentiation, and Apoptosis: Switching Between [16]F. Nir, L. Michal, N. Iftach & P. Dana. Using Bayesian Networks to Analyze Expression Data. Journal of Computational Biology 2000, 7(3-4): 601-620. [17]I. Shmulevich, E. Dougherty, S. Kim & W. Zhang. Probabilis- tic Boolean Networks: A Rule-based Uncertainty Model for Gene Regulatory Networks.Bioinformatics 2002, 18: 261-274. [18]I. Shmulevich, E. Dougherty, S. Kim & Zhang, W. Control of Stationary Behavior in Probabilistic Boolean Networks by Means of Structural Intervention. Journal of Biological Sys- tems 2002, 10: 431-445. [19]I. Shmulevich, E. Dougherty, S. Kim & W. Zhang. From Boolean to Probabilistic Boolean Networks as Models of Genetic Regulatory Networks.Proceedings of the IEEE 2002, Attractors in Cell Regulatory Networks. Exp. Cell Res.2000,90: 1778-1792. 261:91-103.[20]I. Shmulevich & E. Dougherty.Genomic Signal Processing, [11]H. de Jong. Modeling and Simulation of Genetic Regulatory PrincetonUniversityPress,USA,2007. Systems: A Literature Review.J. Comput. Biol.2002,9: 69-[21]P. Smolen, D. Baxter & J. Byrne. Mathematical Modeling of 103.Gene Network. Neuron 2002, 26: 567-580. [12]S. Kauffman. Metabolic Stability and Epigenesis in Randomly[22]Wang, T. C., R.D. Cardiff, L. Zukerberg, E. Lees, A. Amold & Constructed Gene Nets.J. Theoret. Biol. 1969,22:437-467.E.V. Schmidt. Mammary Hyerplasia and Carcinoma in [13]S. Kauffman. Homeostasis and Differentiation in Random MMTV-cyclinD1TransgenicMice.Nature 1994, 369: 669- Genetic Control Networks.Nature 1969, 224: 177-178.671. [14]S. Kauffman. The Origin of Orders, Oxford University Press,[23]K. Yeung & W. Ruzzo. An Empirical Study on Principal Com- NewYork,1993.ponent Analysis for Clustering Gene Expression Data. [15]S. Kim, S. Imoto & S. Miyano. Dynamic Bayesian Network Bioinformatics 2001, 17: 763-774. andNonparametricRegressionforNonlinearModelingof[24]Zhang, S., Ching, W., Tsing, N., H. Leung & Guo, D. A. Multi- Gene Networks from time Series Gene Expression Data. Proc.ple Regression Approach for Building Genetic Networks.The 1st Computational Methods in Systems Biology, Lecture Note Proceedings of the International Conference on BioMedical in Computer Science2003, 2602: 104-113.Engineering and Informatics 2008, Sanya, China. SciRes JBiSE Copyright © 2008 21 S.Q. Zhanget al./J. Biomedical Science and Engineering 1 (2008) 15-21 |