Int'l J. of Communications, Network and System Sciences
Vol.2 No.5(2009), Article ID:602,7 pages DOI:10.4236/ijcns.2009.25043
Research on Financial Distress Prediction with Adaptive Genetic Fuzzy Neural Networks on Listed Corporations of China
School of Mathematical Sciences, South China Normal University, Guangzhou, China
Email: zxiong3@gmail.com
Received March 27, 2009; revised May 10, 2009; accepted June 28, 2009
Keywords: Multi-Population Adaptive Genetic BP Algorithm, Fuzzy Neural Network, Cross Validation,Financial Distress
ABSTRACT
To design a multi-population adaptive genetic BP algorithm, crossover probability and mutation probability are self-adjusted according to the standard deviation of population fitness in this paper. Then a hybrid model combining Fuzzy Neural Network and multi-population adaptive genetic BP algorithm—Adaptive Genetic Fuzzy Neural Network (AGFNN) is proposed to overcome Neural Network’s drawbacks. Furthermore, the new model has been applied to financial distress prediction and the effectiveness of the proposed model is performed on the data collected from a set of Chinese listed corporations using cross validation approach. A comparative result indicates that the performance of AGFNN model is much better than the ones of other neural network models.
1. Introduction
In recent years, neural networks (NNs), especially backpropagation NNs (BPNN), are developed and applied quickly to financial distress prediction because of their excellent performances of treating non-linear data with learning capability [1-2]. However, the shortcoming of neural networks is also significant due to a “black box” syndrome and the difficulty in dealing with qualitative information, which limited its applications in practice [3]. Besides, the common NNs also suffer from relatively slow convergence speed and occasionally involve in a local optimal solution.
On the other hand, fuzzy logic as a rule-based development in artificial intelligence can not only tolerate imprecise information, but also make a framework of approximate reasoning. Thus, a number of fuzzy neural networks have been developed to overcome the “black box” syndrome [4-5]. By the same token, genetic algorithm as an effective non-linear modeling system in artificial intelligence not only searches optima speedily but also searches optima globally [6-9]. Therefore, it is possible that combining neural networks with fuzzy logic and genetic algorithm could merge their advantages and meanwhile overcome the disadvantages mentioned above.
In this study, a new genetic algorithm combined with neural network, named as Adaptive Genetic Fuzzy Neural Network (AGFNN), is presented to predict financial distress on the data collected from a set of Chinese listed corporations, and the results indicate that the performance of AGFNN model is much better than the ones of other NN models.
The rest of this paper is organized as follows. Section 2 introduces the structure of the AGFNN model and associated algorithm. Section 3 describes the data source and methodology. In Section 4, the proposed model is predicted financial distress using the data from Chinese listed corporations, and its performances are compared with the other NN models. Finally, some concluding remarks are drawn from Section 5.
2. Architecture of AGFNN and Its Algorithm
2.1. Architecture of AGFNN
In this study, the proposed AGFNN model is based on the fuzzy neural networks [6]. A fuzzy neural network consists of a set of fuzzy if-then rules that describe the input-output mapping relationship of the network. The antecedents of fuzzy rules partition the input space into a number of linguistic term sets while the consequent constituent can be chosen as a fuzzy membership function (Mamdani model), a singleton value, or a function of a linear combination of input variables (TSK model).
For simplicity, the singleton consequent of fuzzy rules is adopted in this paper. The fuzzy rule with singleton consequent can be given in the following form:
Rule k: if x1 is A and x2 is A
 … and xn is A
 , then
 (1)
(1)
where is the input variable, y is the output variable, A
![]() is the linguistic term of the precondition part,
is the linguistic term of the precondition part, ![]() is the constant consequent part, and n is the number of input variables.
is the constant consequent part, and n is the number of input variables.
The structure of a fuzzy neural network is shown in Figure 1, where n and m are the number of input variables and the number of fuzzy sets respectively. It is a four layer network structure. We use ,
, ,
,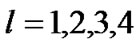 denote the input and output of the ith node in layer L respectively. The functions of the nodes in each layer are described as follows:
Layer 1: The number of nodes is n in this layer. The nodes only transmit input values to layer 2:
 ; (2)
; (2)
Layer 2: Nodes in this layer correspond to one linguistic label of the input variables in layer 1; that is, the membership value specifying the degree to which an input value belongs to a fuzzy set is calculated in this layer.
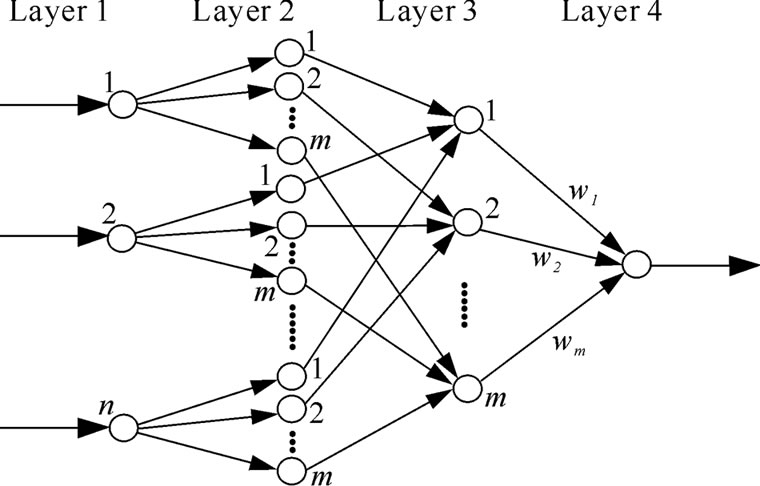
Figure 1. Structure of AGFNN.
The input and output in this layer are formulated as follows:
 (3)
(3)
where is fuzzy membership function,
  and
and are, respectively, the center and the width of the Gaussian membership function
 .
.
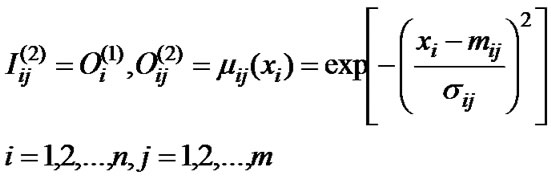
Layer 3: There are m nodes in this layer. The output of each node in this layer is determined by the fuzzy AND operation. Here, the product operation is utilized to determine the firing strength of each rule. The input and output in this layer are formulated as follows:
 (4)
(4)
Layer 4: The single node in this layer computes the overall output as the sum of all incoming signals. The input and output in this layer are formulated as follows:
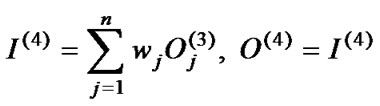 (5)
(5)
where the is the weight associated the j-th node in layer 3 with the single node in layer 4 (output layer).
2.2. Algorithm of AGFNN
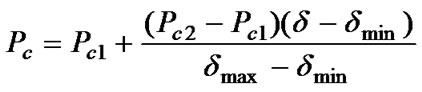
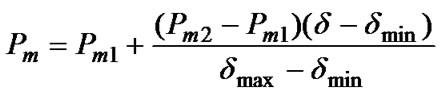
In this study, a modified algorithm, multi-population adaptive genetic BP algorithm (MAGBPA), is proposed to optimize the parameters of this model included the weight, the center and the width of the membership function. In order to improve the performance of evolutionary algorithm, First, this paper employs a multi-population genetic algorithm where a large population is divided into smaller subpopulations and subpopulations cooperate and compete with each other. Secondly, a adaptive genetic algorithm where crossover probability pc and mutation probability pm are self-adjusted according to the standard deviation of population fitness. pc and pm are defined as follows:
 (6)
(6)
 (7)
(7)
where  and
and are the minimum and maximum value of crossover probability set in advance respectively.
  and
and are the maximum and minimum value of mutation probability set in advance respectively.
  and
and are the maximum and minimum value of standard deviation of population fitness set in advance respectively.
 ![]() is value of standard deviation of currently population fitness.
is value of standard deviation of currently population fitness.
However, while GA is very effective at global search can quickly isolate global minimum, it may be inefficient at actually finding that minimum. Therefore, backpropagation (BP) operator is introduced into GA. That is, BP is used for the fine-tuned search when the GA is used to isolate the global minimum. The detailed procedure of algorithm consists of the following steps:
Step 1: Let t = 0 and randomly produce an initial population P(t) which divided into N (N > 1) subpopulation averagely. In this study, the size of population is selected from 30-100.
Step 2: Use real numbers to code values of the model’s parameters. The values of w are limited in the interval of [-100, 100]. The values of m and the values of σ are limited in the interval of [-2, 2] and interval of (0, 2] respectively. The initial parameter values are given randomly in terns of distribution of .
.
Step 3: Calculate the value of fitness for each individual of each subpopulation. We use the reciprocal of SSE as the function of evaluation, that is: f = 1/ .at same time, calculate
  (the value of standard deviation of initial population fitness) and we can regard
  as the initial values of
  and
and .
.
Step 4: Execute Step 5 and Step 6 in each subpopulation independently.
Step 5: In each subpopulation, genetic operators are executed. Roulette-wheel is used in the selection and adaptive strategies are used in crossover and mutation. The selection of each individual depends on the probability that is proportional to its degree of fitness. Self-adjusted crossover probability pc and a seif-adjusted mutation probability pm are used in this study according to the Equation (6) and the Equation (7).
Step 6: A number of individuals are distributed among subpopulations by means of migration operator after the subpopulations evolve independently for a certain number of generations (isolation time). A fixed migration rate pmr is employed, and the selection of individuals for migration is based on the value of fitness. The migration of topology is neighborhood topology that migration is made only between nearest neighbors. These exchanged individuals participate in the evolution process and produce new subpopulations.
Step 7: Calculate the value of  when the new population is produced. If
 ![]() >
> , then
  =
=![]() ; if
; if ![]() <
< , then
  =
=![]() .
.
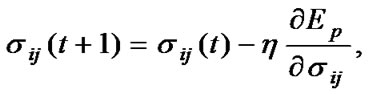
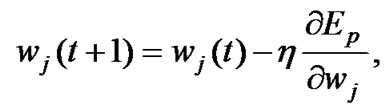
Step 8: Once the new subpopulations are produced, use BP algorithm to make each individual learn from the data sample. Update the parameter values by using the follow formulas:
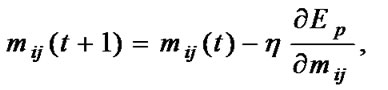 (8)
(8)
 (9)
(9)
 (10)
(10)
where 
 and
and  are determined by the follow equations
 (11)
(11)
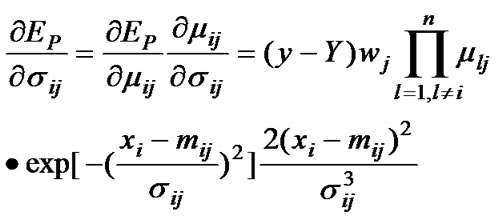 (12)
(12)
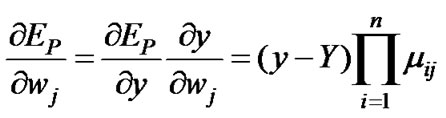 (13)
(13)
Step 9: Check the termination criterion. In this study, we use two measures that the mean squared error (MSE) and the maximal evolution generations. That is, if the MSE< ε or the number of maximal evolution generations is M, where ε and M are values set in advance, then stop algorithm, otherwise let t = t+1 and go to Step 3 until termination criterion is reached.
The diagram of multi-population adaptive genetic BP algorithm is shown in Figure 2.
3. Data Source and Pretreatment
The data of samples used in this study are selected from the listed corporations of China. Those sample corporations can be divided into two categories: ST (special treatment) corporations and the normal corporations. The main reason that listed corporations become ST corporations is due to the bad financial status. So, the ST corporations denote the corporations in financial distress and the normal corporations denote the corporations in financial non-distress in this study.
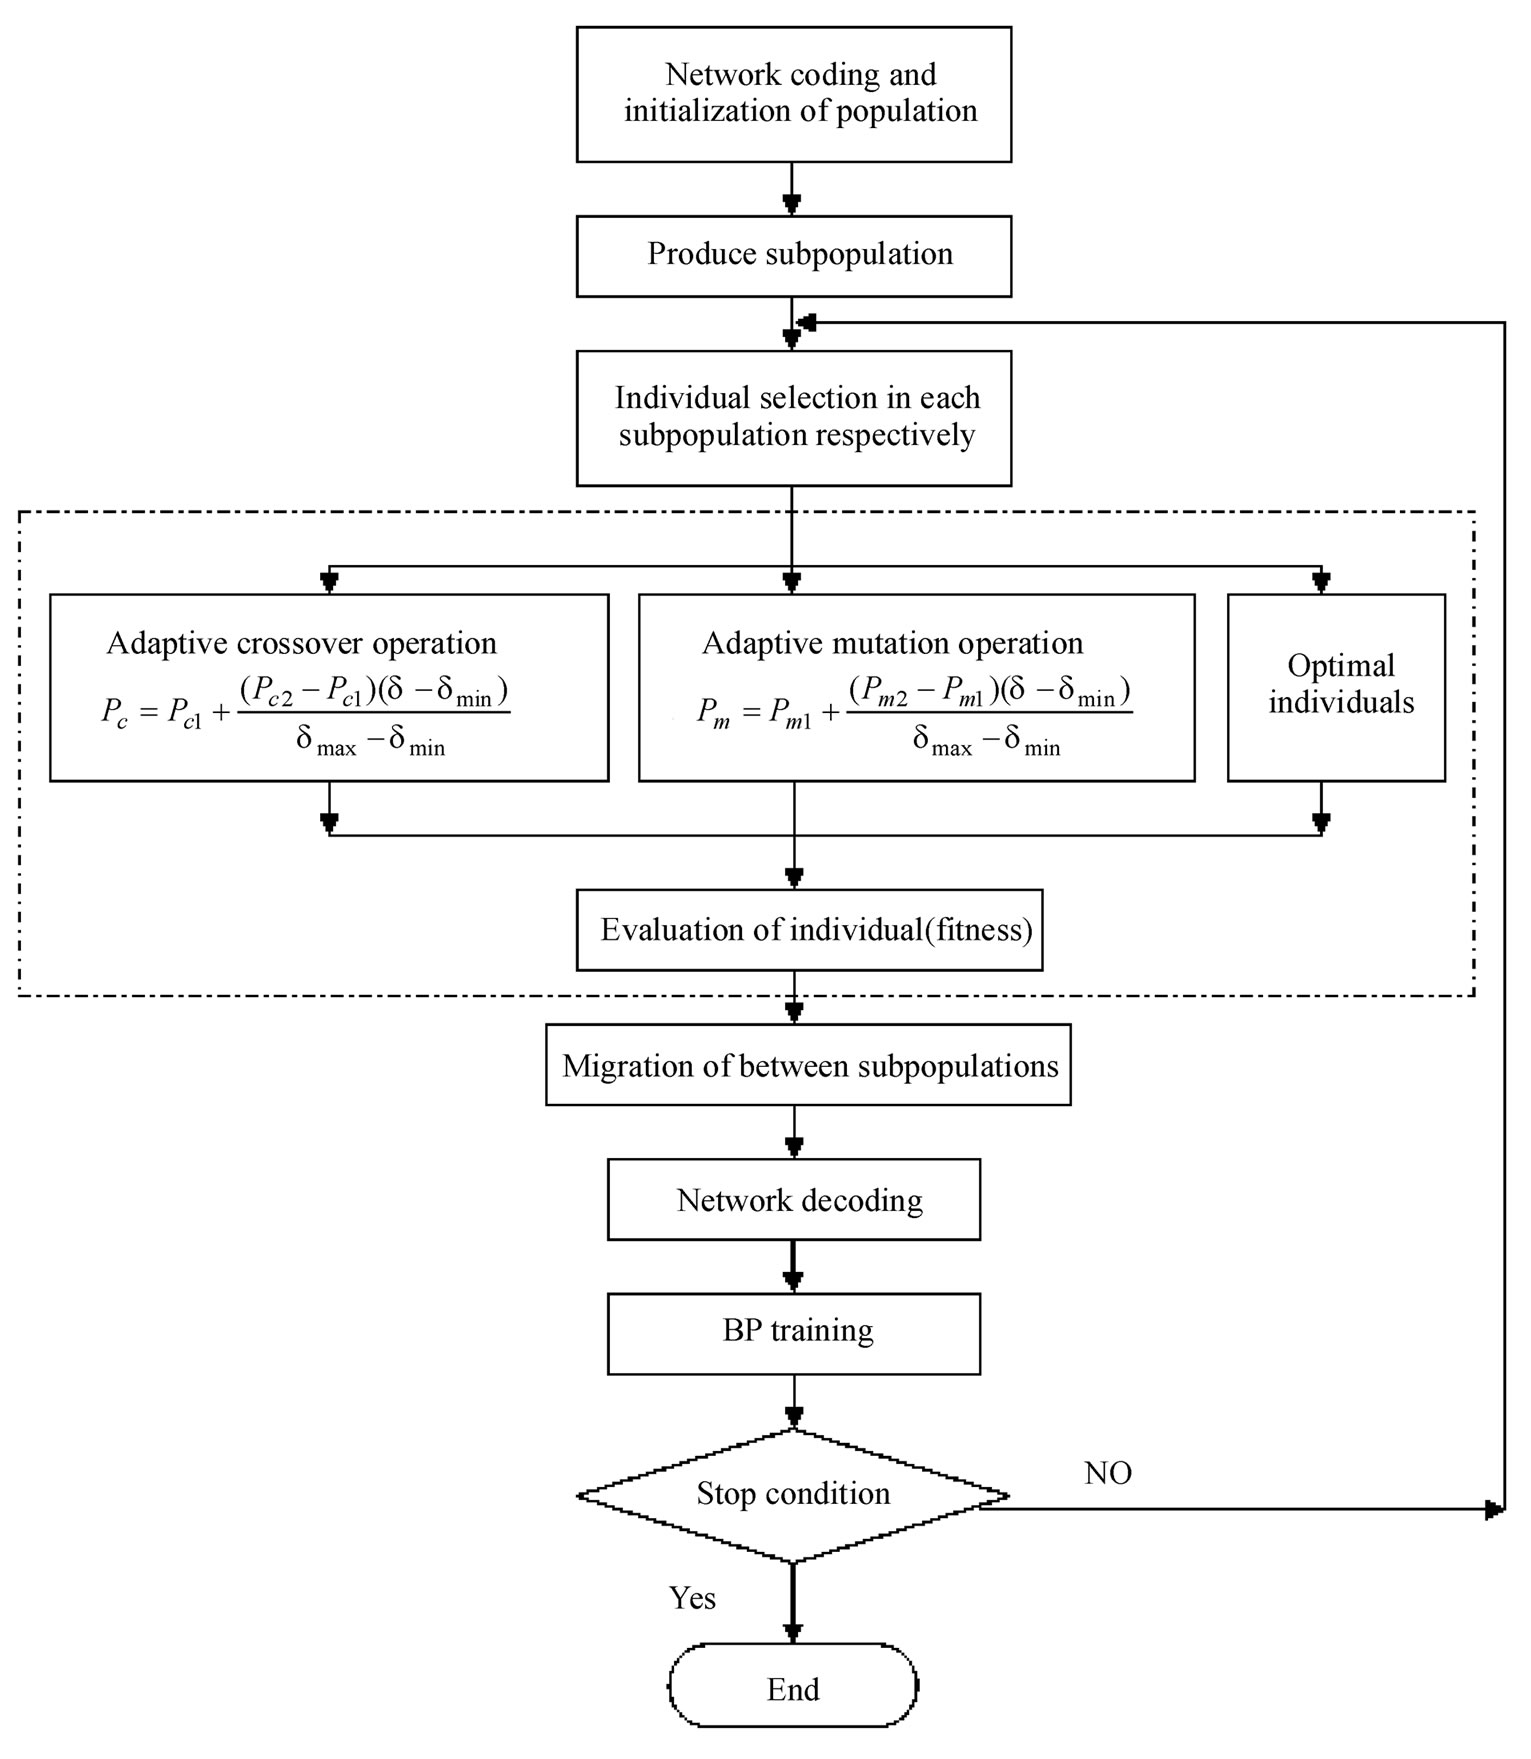
Figure 2. Diagram of multi-population adaptive genetic BP algorithm.
Jain and Nag (1997) observed that classification accuracy based on balanced samples represent a poor metric for assessing the effectiveness of NNs in predicting financial distress and bankruptcy. Because the proportion of financial failures among publicly traded entities is very small, it is mathematically possible for a model to have a predictive accuracy that exceeds 50% (better than a decision rule based on a fair coin test) and still perform very poorly when faced with real-world data. So they suggested that NN models should be validated with an unbalanced sample that includes a realistically small proportion of failed companies [10]. According to this suggestion, this paper selects 188 observations which include 47 ST and 141 normal corporations from 2004 to
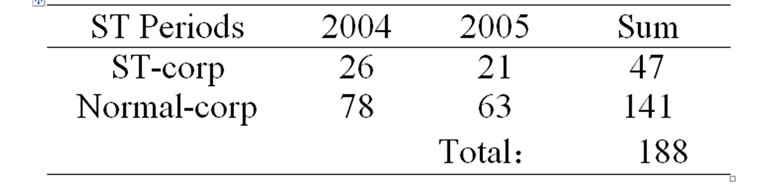
Table 1. Number of selected corporations.
2005. The detail of the number of selected corporations is shown in Table 1.
The data set is divided into two subsets: one is a training sample set with 120 corporations including 30 ST corporations and 90 normal corporations, used to design the common NNs model and the GFNN model; another is a test sample set with 68 corporations including 17 ST and 51 normal corporations to test the performance of models.
In this study, 10 financial variables are selected in this data according to the prior studies [4-5], which include: net profit to total assets (X1), ratio of main business profit (X2), return on equity (X3), total liabilities to total assets (X4), quick ratio (X5), interest coverage ratio (X6), working cash to total liability (X7), turnover of total assets (X8), turnover of accounts receivable (X9) and growth ratio of main business income (X10).
Function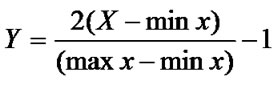 is used to treat input data, where X is input matrix, max x and min x, respectively, denote the maximum element and minimum element of matrix X. So, the number of input layer nodes is 10. The value of parameter m is set to 3. The number of layer 2 nodes and the number of layer 3 nodes are 30 and 3 respectively. The output variable is a single variable y, that is, output layer has one node. y = 1 denotes the corporation is in distress, y = 0 denotes the corporation is normal in this study. The actual structure of AGFNN is a 10-30-3-1 network model.
4. Empirical Results
In order to minimize the possible bias associated with the random sampling of the training and testing samples, researchers tend to use n-fold cross-validation scheme in evaluating the classification capability of the built model. In n-fold cross-validation, the entire dataset is randomly split into n mutually exclusively subsets (also called folds) of approximately equal size with respect to the ratios of different populations. The classification model will then be trained and tested n times. Each time the model is built using (n-1) folds as the training sample and the remaining single fold is retained for testing. The training sample is used to estimate the credit risk model’s parameters while the retained holdout sample is used to test the generalization capability of the built model. The overall classification accuracy of the built model is then just the simple average of the n individual accuracy measures [11]. As cross-validation is the preferred procedure in testing the out-of-sample classification capability when the dataset size is small and the size of bad credit corporations is only 47, the four-fold cross-validation will be adopted in this study. Therefore there are 47 corporations in each fold of the dataset.
In this study, suppose that the population size is 80, the number of subpopulations is 4, initial crossover probability is 0.75, initial mutation probability is 0.025,  and
and are set 0.7 and 0.9 respectively;
  and
and  are set 0.05 and 0.001 respectively; migration rate is 0.4, isolation time is 20 generations, the number of learning with BP algorithm in each generation is 5 times and the learning rate
 is 0.06.
Termination criterion of sample learning as follows:
(1)![]() or (2) the maximum number of genetic generations = 2000.
or (2) the maximum number of genetic generations = 2000.
The built-in multi-population adaptive genetic BP algorithm based fuzzy neural networks program attached in the toolbox of MATLAB is used for data processing in this study.
Four networks credit risk models were built and the classification results of the corresponding testing samples were summarized in Table 2. From the results in Table 2, we can observe that the average correct classification rates for the four folds are 93.62, 89.36, 91.49 and 93.62%, respectively, with the mean equals to 92.02%.
In the meanwhile, two models, a BPNN model (employ BP algorithm) and a classic model-ANFIS (adaptive network-based fuzzy inference system) model, are designed for comparison in this study*.
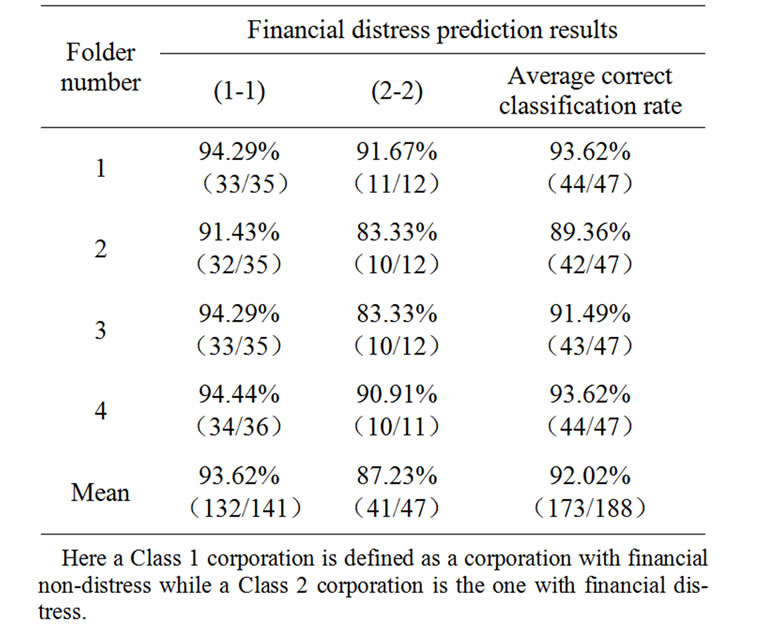
Table 2. Cross-validation testing results of AGFNN.
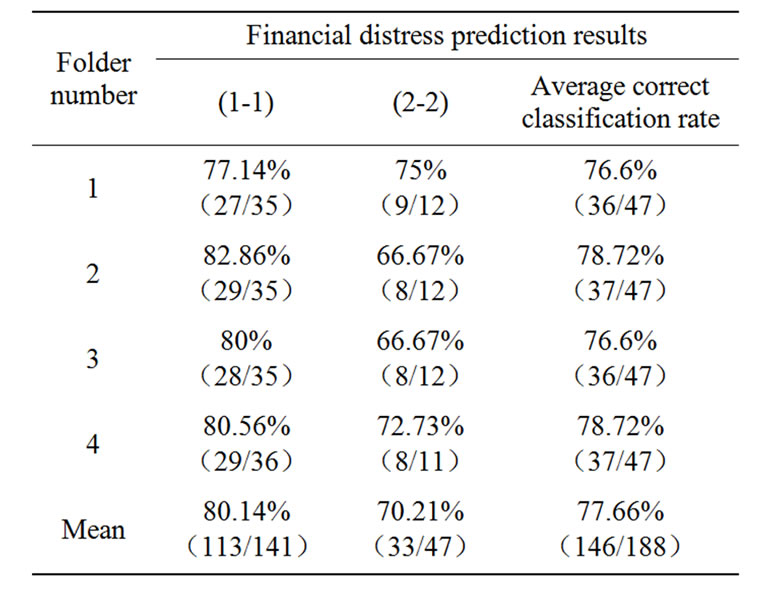
Table 3. Cross-validation testing results of BPNN.
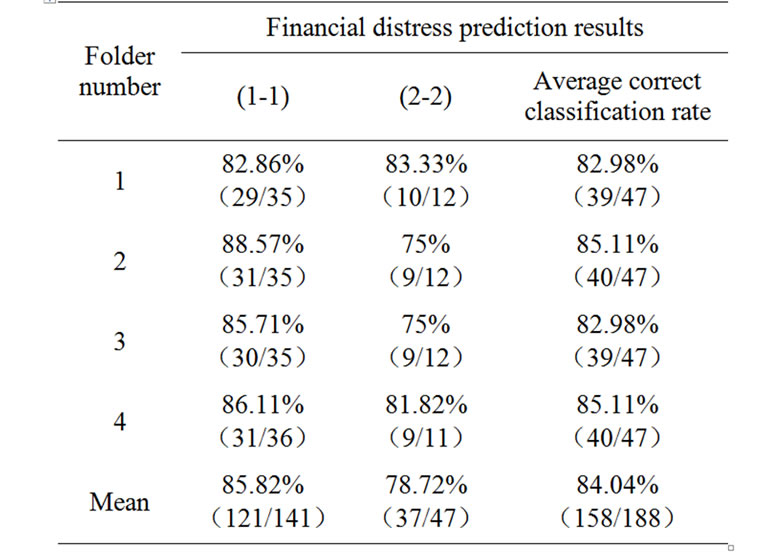
Table 4. Cross-validation testing results of ANFIS.
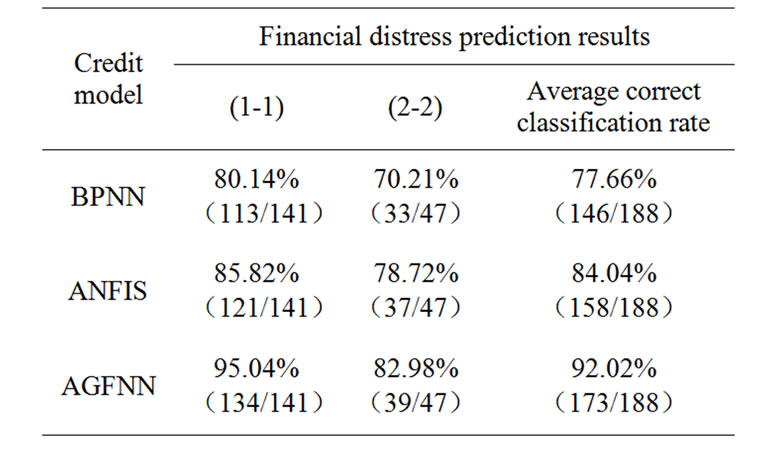
Table 5. Summarized testing results of the three
constructed models The testing results of the four built BPNN models can be summarized in Table 3. From the results in Table 3, we can conclude that the average correct classification rates for the four folds are 76.6, 78.72, 76.6 and 78.72%, respectively, with the mean equals to 77.66%. Similarly, the prediction results of the four built ANFIS models are summarized in Table 4. From the results in Table 4, we can conclude that the average correct classification rates for the four folds are 82.98, 85.11, 82.98 and 85.11%, respectively, with the mean equals to 84.04%.
In order to evaluate the effectiveness of the proposed AGFNN model, the classification results are also compared with those using BPNN and ANFIS models. Table 5 summarizes the average classifications results of BPNN, ANFIS and AGFNN models. As shown on the Table 5, AGFNN model outperforms BPNN and ANFIS models whether on identifying financial normal corporations or identifying financial distress corporations. Moreover, we can see that the average correct classification rate of BPNN and ANFIS models are 77.66% and 84.04% respectively, while the average correct classification rate of AGFNN model is 92.02% on Table 5. So, it can be conclude that the AGFNN model has the best financial distress prediction capability in terms of the correct classification rate from Table 5.
5. Conclusions
In this paper, an improved method for the financial distress prediction has been proposed. This method, namely hybrid model, combines fuzzy neural network and multi-population adaptive genetic back-propagation algorithm, named as Adaptive Genetic Fuzzy Neural Network (AGFNN). In this model, a modified learning algorithm, multi-population adaptive genetic BP algorithm (MAGBPA), is proposed to adjust the parameters for the desired outputs. In the MAGBPA method, multipopulation adaptive genetic algorithm is used to obtain a rough solution quickly and avoid local optimal solution, and then BP algorithm is used to fine-tune the results. In the end of this study, we investigate the performances of the BPNN model, ANFIS model and AGFNN model on financial distress prediction using the cross-validation approach, based on a set of financial data selected from China listed corporations from 2004 to 2005. The empirical results are shown on a series of tables (from Table 2 to Table 5). The results indicate that the performance of AGFNN is much better than the BPNN and ANFIS models and show that the proposed AGFNN model is promising in financial distress prediction.
6. Acknowledgement
This work is supported by the National Science Foundation of China (NSFC), Grant 70371029.
7. References
[1] P. Jackson and W. Perraudin, “Regulatory implications of credit risk modeling,” Journal of Banking and Finance, Elsevier Science Inc., Vol. 24, pp. 1-14, 2000.
[2] T. G. Calderon and J. J. Cheh, “A roadmap for future neural networks research in auditing and risk assessment,” International Journal of Accounting Information Systems, Elsevier Science Inc. Vol. 3, pp. 203-235, 2002.
[3] A. F. Shapiro, “The merging of neural networks, fuzzy logic, and genetic algorithms,” Insurance, Mathematics and Economics, Elsevier Science Inc., Vol. 31, pp. 115-131, 2002.
[4] R. Malhotra and D. K. Mahotra, “Differentiating between good credits and bad credits using neuro-fuzzy systems,” European Journal of Operational Research, Elsevier Science Inc., Vol. 136, pp. 190–211, 2002.
[5] S. Piramuthn, “Financial credit risk evaluation with neural and neuro-fuzzy systems,” European Journal of Operational Research, Elsevier Science Inc., Vol. 112, pp. 310–321, 1999.
[6] C. J. Lin and Y. J. Xu, “A self-adaptive neural fuzzy network with group-based symbiotic evolution and prediction applications,” Fuzzy Sets and Systems, Elsevier Science Inc., Vol. 157, pp. 1036-1056, 2006.
[7] R. Sikora and S. Piramuthu, “Framework for efficient feature selection in genetic algorithm based data mining,” European Journal of Operational Research, Elsevier Science Inc., Vol. 180, pp. 723-737, 2007.
[8] M. Srinivas and L. M. Patnaik, “Adaptive probabilities of crossover and mutation in genetic algorithms,” Systems, Man and Cybernetics, IEEE Transactions on, Vol. 24, No. 4, pp. 656-667, 1994.
[9] X. T. Guo and Y. Zhu, “Evolutionary neural networks based on genetic algorithms,” Journal of Qinghua University (National Science Edition), Vol. 40, No. 10, pp. 116-119, October 2000.
[10] B. A. Jain and B. N. Nag, “Performance evaluation of neural network decision models,” Journal of Manage Information Systems, Elsevier Science Inc., Vol. 14, pp. 201-216, 1997.
[11] R. A. Johnson and D. W. Wichern, “Applied multivariate statistical analysis,” 5th Edition, Prentice-Hall, Upper Saddle River, N. J., 2002.
[12] J. S. R. Jang, C. T. Sun, and E. Mizutani, “Neuro-fuzzy and soft computing, matlab curriculum series,” Prentice-Hall, Englewood Cliffs, N. J., 1997.
[13] Z. B. Xiong and R. –J. Li, “Credit risk evaluation with fuzzy neural networks on listed corporations of China,” Proceedings of IWVDVT, China, pp. 397-402, May, 2005.
NOTES
*See the Literature 12 and 13 for a more detailed design of the BPNN and ANFIS models..