Journal of Electromagnetic Analysis and Applications
Vol. 1 No. 3 (2009) , Article ID: 730 , 3 pages DOI:10.4236/jemaa.2009.13029
An Approach to Harmonic State Estimation of Power System
1State Key Laboratory of Power Transmission Equipment & System Security and New Technology, Chongqing University, Chongqing, China; 2AREVA T&D Inc., 10865 Willows Rd. NE, Redmond, USA
Email: jizhong.zhu@areva-td.com
Received March 17th, 2009; revised June 15th, 2009; accepted June 22nd, 2009.
Keywords: State Estimation, Harmonic Analysis, Measurement Errors, Total Least Squares, Probability, Uncertainty
ABSTRACT
This paper presents the harmonic state estimation (HSE) based on the Total Least Squares (TLS) through comprehensively considering the harmonic network parameter error and measurement system error. The proposed approach is tested on the IEEE 14–bus harmonic testing system. The satisfied results are obtained.
1. Introduction
The harmonic state estimation (HSE) in power system estimates the harmonic state in whole network according to the measured values of limited points [1–3]. The problem of harmonic state estimation was first proposed by Heydt in 1989 [1], where HSE is handled as an inverse problem of harmonic power flow, and the adopted algorithm for estimating the harmonic state and identifying the harmonic source is least square estimation. Since it is difficult to obtain accurately all system parameters for a non-fundamental frequency harmonic network, the parameter error always exists. However, the existing HSE methods only consider the harmonic measurement error, and ignore the effect of parameter error to harmonic state estimation, which is addressed in this paper.
2. HSE Based on TLS
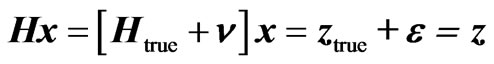
Since the parameter error always exists in non-fundamental frequency harmonic network, the mathematical model of HSE should consider not only the impact of measurement error, but also the impact of parameters error. Therefore, the HSE mathematical model can be expressed as:
 (1)
(1)
where, H is the parameter matrix (m×n) containing the relationship between the measured values and the state variables. x is the undetermined state vector (n×1). Htrue is the parameter matrix containing the truth values. v is the parameter error matrix (m×n). ztrue is the measurement vector (m×1) related to the truth values, which are unknown variables. ε is the measurement error vector (m×1). z is the measurement vector (m×1).
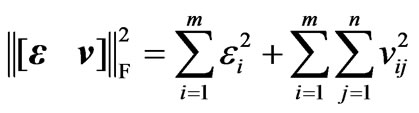
The harmonic state estimation Equation (1) is an overdetermined linear system. In this paper, the TLS method is proposed to solve such HSE problem. The estimation method of TLS is trying to estimate the noise matrix v and the noise vector ε to meet the exact solution of linear system. Select v and ε to make a minimum of
 (2)
(2)
where,  is the element of matrix v, and εi is the i-th element of ε.
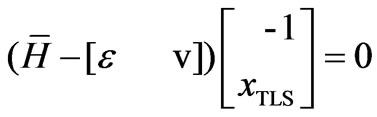
Let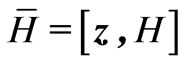 ,Equation (1) can be written as follows:
 (3)
(3)
where, 0 is an m-dimension vector in which all the elements are 0.
In general, because of the existence of noise, the augmented matrix is full rank. If m>n+1, the rank of matrix
  is (n+1). Using the singular value decomposition (SVD) method, the matrix can be expanded as follows:
 (4)
(4)
where, σi is the singular value of matrix , arranging in the decreasing order of values, ui and wi are left singular vector containing m elements and right singular vector containing (n+1) elements, respectively.
Let’s define rank approximate value as the minimum of the sum of various perturbations in matrix . It is given as follows [4]:
 (5)
(5)
Moreover, error matrix  is given as follows:
 (6)
(6)
From Equations (3) and (5), we can get
 (7)
(7)
According to [4], when the noise sequence meets the central limit theorem conditions of independent identical distribution, the standard TLS estimation is unbiased.
For the h-th harmonic, the harmonic power flow Equation can be expressed as follows:
 (8)
(8)
In this paper, the node harmonic voltage vector  is used as measuring point, and the node harmonic injection current
  is used as state variables. If different measurements and state variables are selected, the similar state estimation expression can still be obtained through the matrix transformation. If parameters error and measurement error are considered simultaneously, that is, harmonic impedance matrix error and harmonic node voltage measurement error are considered together, the relationship between measurements and state variables can be obtained as follows:
 (9)
(9)
According to Equations (3–7), the estimated value of the node harmonic injection current, , can be computed. Thus, the harmonic state estimation is solved.
3. Simulation Results and Analysis
The proposed TLS based HSE approach is examined using the IEEE–14 node harmonic test system, which includes two harmonic sources, one is high voltage direct current (HVDC) transmission system's terminal located at node 3, and another is static var compensator (SVC) located at node 8. The node harmonic voltages located at buses 2–12 are selected as the measurement data.
The following several combination modes are used for simulation analysis, respectively:
1) Case 1: Both measurement error and parameters error obey normal distribution with zero mean and different variances;
2) Case 2: Measurement error obeys uniform distribution of zero mean, parameters error obeys normal distribution of zero mean;
3) Case 3: Measurement error obeys normal distribution of zero mean; parameters error obeys uniform distribution of zero mean.
Assume that the errors are independent. The sampling frequency is selected as 10000. In order to do comparison easily, the three-phase harmonic simulation is computed to obtain the true value, which is used to compare with the estimated value of harmonic state estimation.
During the simulation, superimpose a random error at each node harmonic voltage and each element of harmonic impedance matrix. The errors are produced by the normrnd function in Matlab. The variance is selected as 1% of the absolute value of each element in the matrix.
Due to the limitation of the space, this paper only gives the analysis of case 2. In this case, it is needed to determine the upper and lower limit of the uniform distribution of the measurement error U[a,b]. Considering that the measurement error is the random signal, which has the similar definition with the noise in signal processing [5], we determine the values of a and b through the use of the signal-to-noise ratio (SNR) in signal processing.
 (10)
(10)
where, PS is the maximum true value in various measurements. PU is the variance of measurement error, which is the uniform distribution.
In this paper, the signal-to-noise ratio SNR is selected as 20, together with the error is zero mean (that is, a = – b). Then, the upper and lower limits of the uniform distribution can be obtained through the following Equation:
 (11)
(11)
Thus, the random sequence of measurement error can be obtained according to the upper and lower limit of uniform distribution. Then, the measurement value including uniform distribution error can be obtained by superimposing it to the true value.
The results are shown in Figures 1–4. Figure 1 shows the error cumulative probability density curve of the calculation results. Node harmonic injection current and harmonic voltage estimation are shown in Figures 2 and 3. The probability density curves of harmonic injection cur-
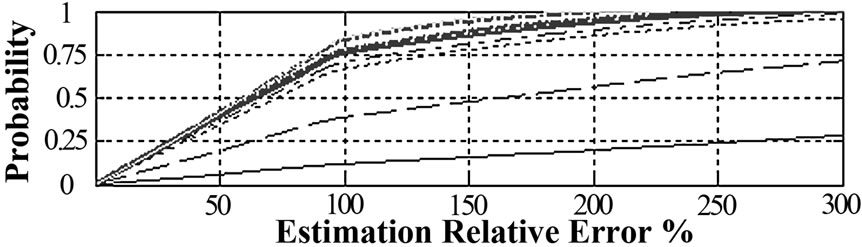
Figure 1. Harmonic current injections estimation relative error at bus 3
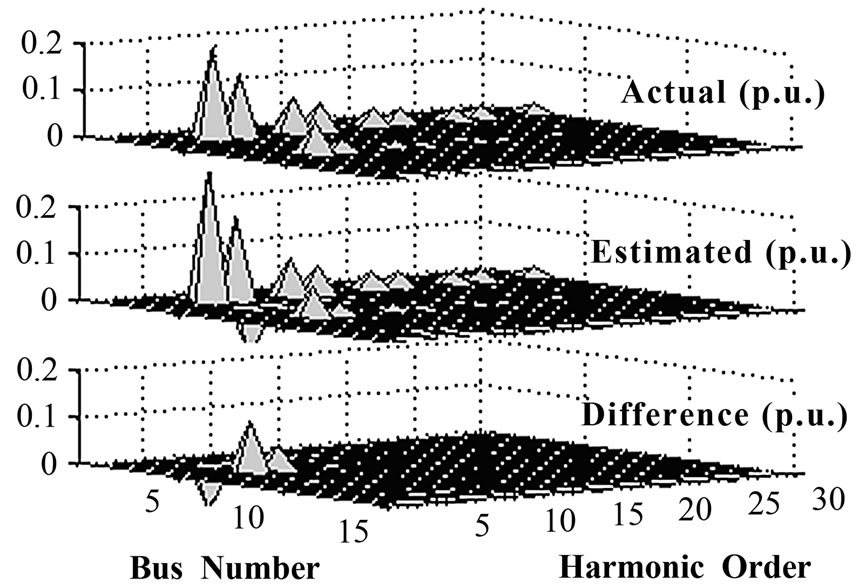
Figure 2. Harmonic current injections
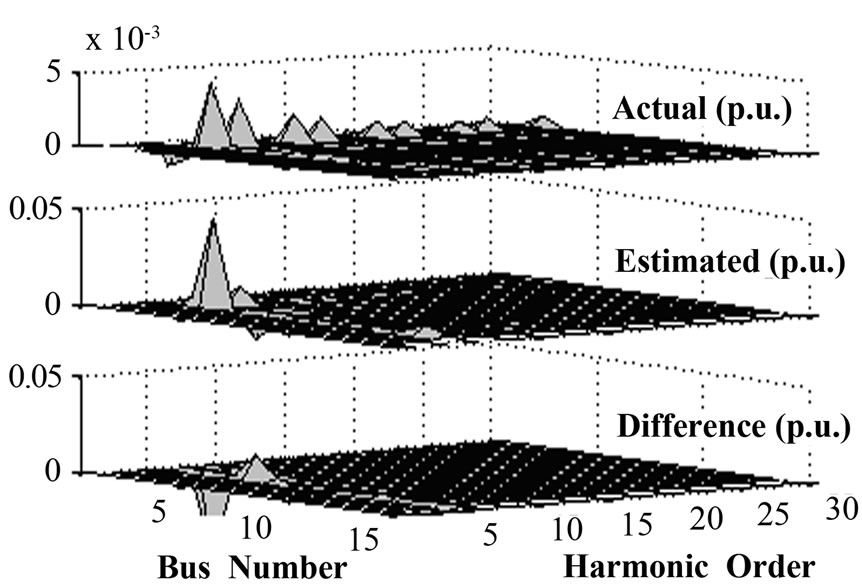
Figure 3. Harmonic bus voltages
rent estimation values are shown in Figure 4. The results show that the probability density curves of all harmonic injection current estimation values obey normal distribution approximately. For the low-order harmonic, its confidence interval of probability density curve is relatively wide.
4. Conclusions
This paper has studied the harmonic state estimation
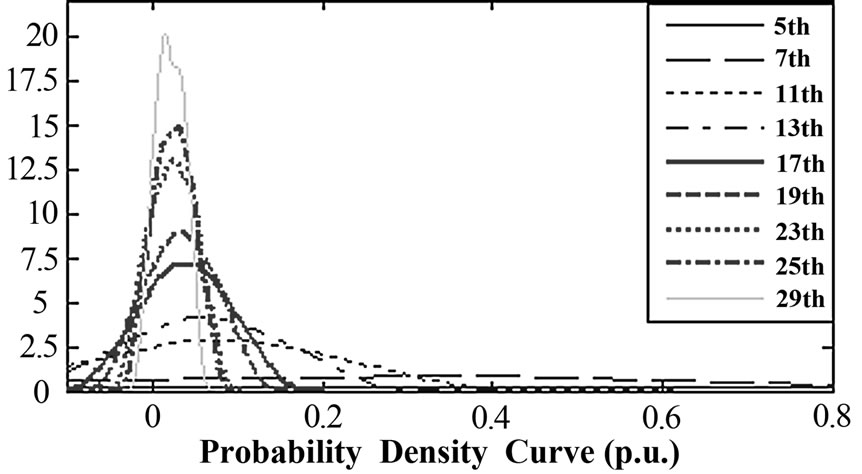
Figure 4. The probability density curve of the harmonic current injections estimated value at bus 3
(HSE) through considering comprehensively the meas urement error and parameters error. The proposed method is the Total Least Squares (TLS) and statistical approach. The details of HSE model based on TLS are presented, and error analysis for the HSE is conducted by using the probability density function and cumulative probability density function. The proposed method and algorithm are tested on IEEE 14-node harmonic network. The simulation results show the effectiveness and correctness of the paper.
REFERENCES
- G. T. Heydt, “Identification of harmonic sources by a state estimation technique,” IEEE Trans., Power Delivery, Vol. 4, No. 1, pp. 569–576, 1989.
- A. P. S. Meliopoulos, F. Zhang, and S. Zelingher, “Power system harmonic state estimation,” IEEE Trans., Power Delivery, Vol. 9, No. 3, pp. 1701–1709, 1994.
- Z. P. Du, J. Arrillaga, N. Watson, and S. Chen, “Identification of harmonic sources of power systems using state estimation,” IEE Proceedings – Generation, Transmission and Distribution, Vol. 146, No. 1, pp. 7–12, 1999.
- C. Fu, “The probability distribution of measurement errors,” Journal of Chengdu Institute of Radio Engineering, Vol. 3, No. 3, pp. 56–65, 1981.
- G. S. Hu, Digital Signal Processing, Beijing: Qing Hua University Publishing House, 2004.