Journal of Water Resource and Protection
Vol.6 No.2(2014), Article ID:43188,9 pages DOI:10.4236/jwarp.2014.62018
An Assessment of Irrigation Water Quality and Selected Soil Parameters at Mutema Irrigation Scheme, Zimbabwe
1Department of Environmental Science & Technology, Chinhoyi University of Technology, Chinhoyi, Zimbabwe
2DR & SS, Agricultural Research Centre, Harare, Zimbabwe3AGRITEX, Chipinge, Zimbabwe4DR & SS, Coffee Research Institute, Chipinge, ZimbabweEmail: achemura@gmail.com
Copyright © 2014 Abel Chemura et al. This is an open access article distributed under the Creative Commons Attribution License, which permits unrestricted use, distribution, and reproduction in any medium, provided the original work is properly cited. In accordance of the Creative Commons Attribution License all Copyrights © 2014 are reserved for SCIRP and the owner of the intellectual property Abel Chemura et al. All Copyright © 2014 are guarded by law and by SCIRP as a guardian.
Received August 20, 2013; revised September 23, 2013; accepted October 19, 2013
Keywords:Mutema; Irrigation Scheme; Salinity; Irrigation Water Quality; SAR; ESP
ABSTRACT
Soil salinity and sodicity are major factors limiting agricultural productivity in irrigation schemes located in semi-arid areas. A study was conducted to assess the quality of irrigation water used in Mutema Irrigation Scheme located in south-east Zimbabwe to understand how irrigation water quality is related to the chemical quality of soils in the scheme. Irrigation water samples were collected from groundwater and surface sources in 2012 and their hydrochemistry determined while soil samples were collected from irrigated and non-irrigated parts of the scheme in 2006 and 2012 and analysed for selected chemical properties. The results indicated that the groundwater had high concentrations of Na+ (4.35 mg/l), Mg2+ (4.75 mg/l), Cl− (3.6 mg/l) and Electrical Conductivity (EC) (1729 Msm/cm) compared to the surface irrigation water source which had 0.72 mg/l Na+, 2.25 mg/l Mg2+, 0.78 mg/l Cl− and 594 Msm/cm EC. The soils in the scheme had higher levels of pH, Sodium Adsorption Ratio (SAR), Exchangeable Sodium Percentage (ESP) and EC which in some blocks exceeded the threshold requirements for cropping. It was found that pH, SAR and ESP were significantly higher (p < 0.05) in irrigated blocks compared to non-irrigated areas of the scheme, indicating an influence of irrigation water on soils characteristics in irrigated plots. Mg2+ and Ca2+ in the soils positively correlated with Na+ (r2 = 0.67 and r2 = 0.57 respectively). The results indicated that the groundwater presents a chloride hazard to the soils in the scheme which are becoming saline and therefore require proper management and choice of crops to sustain crop production.
1. Introduction
Salinity and sodicity have been extensively reported among the major problems of irrigated agriculture across the world [1-5]. It is estimated that over 900 million hectares of agricultural land are impacted by salinity and sodicity, representing over 6% of all agricultural land and about 20% of the world’s irrigated land [6-8]. Soils are classified as saline or sodic based on the soluble salts in saturated extracts (EC) and the proportion of Na to Ca and Mg in saturated extracts (SAR = Na [Ca+Mg/2]½) or the proportion of exchangeable Na to the cation exchange capacity (ESP = Na/CEC/100) [4]. Saline soils have an EC of more than 4 dS∙m−1 and either a SAR of less than 13 or an ESP of less than 9% [9-11]. On the other hand, sodic soils have an EC of less than 4 dSm−1 and either a SAR of more than 13 or an ESP of more than 9% [6,12,13].
The methods that are commonly used as indices of salinity and/or sodicity in soils include electrical conductivity, osmotic potential, Sodium Adsorption Ratio [SAR) and Exchangeable Sodium Percentage (ESP) [3,9,12,14]. SAR measures the proportion of sodium (Na+) to calcium (Ca2+) and magnesium (Mg2+) and can be used for assessing quality of the water used for irrigation and the status of the soils that receive the irrigation water [1,6]. The effects of high SAR are usually poor soil tilth and soils become sticky when wet resulting in reduced water infiltration [1,15]. The soil tensile strength, a physical measure of the ability of the soils to endure applied forces without being disrupted, is associated with SAR among other factors [13]. Soil pH and physical conditions are also used to determine soil and irrigation water quality in addition to SAR. SAR is commonly used because determining the required CEC for ESP demands laborious and time consuming laboratory tests [12]. The thresholds for SAR and ESP in Zimbabwe are 13% and 9% respectively [16].
The main cause of salinization and sodification is the use of poor quality irrigation water and continued use of this water leads inexorably to increasing salinization and sodification problems and ultimately results in increased cost of production and crop failures [14,17-20]. Salinization is especially serious where groundwater is used for irrigation with the problem being coupled by conversion from natural deep rooted trees and shrubs to commercial shallow-rooted crops that cause the water table to rise and bring more salts with it to the upper layers [8,21]. In addition to effects of crop production, salinity and sodicity have been linked to environmental degradation including loss of below and above ground carbon stocks as vegetation health deteriorate and making soils more susceptible to erosion [9,13,22]. Salinity conditions in agricultural soils have been found to vary over space and seasons [23].
Irrigation water quality and quantity have direct and indirect impact on soil characteristics (physical, biological and chemical) especially in arid and semi-arid regions that unfortunately depend on irrigation [13]. Due to unreliable rainfalls and the climatic gradient, there are over 180 community and government operated surface and sprinkler-based smallholder irrigation schemes in Zimbabwe covering over 10,000 ha producing maize, tomatoes, soya beans, beans, wheat, leafy vegetables and other crops [24-27]. The majority of these are in dry areas and produce food for own use and for marketing and were a result of deliberate policy and institutional frameworks for supporting and promoting irrigated agriculture in dry areas of the country [28]. Water supply to support these schemes is drawn from dams, rivers and/or from deep boreholes with potential for water harvesting to supplement these sources [29-31].
The quality and quantities of the water used on each scheme are as variable as the environmental and geological characteristics in each of the schemes. Water quality and quantity also vary between different seasons and between years as affected by different factors [1]. The variation in water quantity is directly related to productivity in irrigation schemes in the short term while water quality affects productivity in the long term [14,32]. In Zimbabwe, although many schemes have been successful in improving socioeconomic conditions of people in water-limited areas, when assessed in terms of water delivery, agricultural production and socioeconomic indicators, some schemes have not been successful [25,33-35]. The reasons for poor performance or failure in these schemes are both biophysical and socioeconomic [28,32]. This is despite the fact that irrigation schemes are a source of livelihoods for many communal areas in Zimbabwe, the majority of which are in drier areas (mean annual rainfall <650 mm/year) making rainfed crop production risky [21]. Therefore, irrigation schemes are strategic in ensuring food security and agricultural economic activities in areas where crop production is constrained by inadequate or unreliable rainfall.
The biophysical characteristics in schemes need to be optimal for obtaining potential socioeconomic benefits without compromising resource base. This is important for many irrigation schemes, whose demise spells disaster for many people who have little or no alternative options to meet their economic and food security requirements. The objectives of the study were therefore to [1] assess the chemical properties of the irrigation water used at Mutema Irrigation Scheme and [2] determine the levels of selected chemical properties of soils in irrigated and non-irrigated parts of the scheme. It is hoped that knowledge generated from this study will guide agricultural and environmental policy for sustainable irrigation schemes in semi-arid regions.
2. Materials and Methods
2.1. Study Area
The study was carried out in Mutema Irrigation Scheme, located in the Chipinge district within the Save catchment. It is 150 km south of Mutare (Figure 1). Altitude is 435 m on a gentle slope of 0.5% from east to west. The scheme was commissioned in 1932 as a pilot irrigation project for communal areas in the area [36,37]. After realising that water abstracted from the Tanganda river was not reliable, four boreholes were drilled in the early 1970s to supplement water supply especially during the winter season [36]. After Cyclone Eline in 2000, the point of abstraction from the Tanganda River was seriously damaged and the boreholes were extended to cover the whole scheme [37]. The soils range from sandy clay loam to sandy loams derived from colluvium and alluvium deposits [36,38]. The scheme is bounded to the south by the Tanganda River, to the west by Save River and to the north by a mountain range. It is in Agro-ecological Region V which is characterized by semi-arid conditions [38]. Mean annual temperatures are above 25˚C with hottest months being September and October. Annual total rainfall is very low (less than 600 mm) and is received between December and March [37].
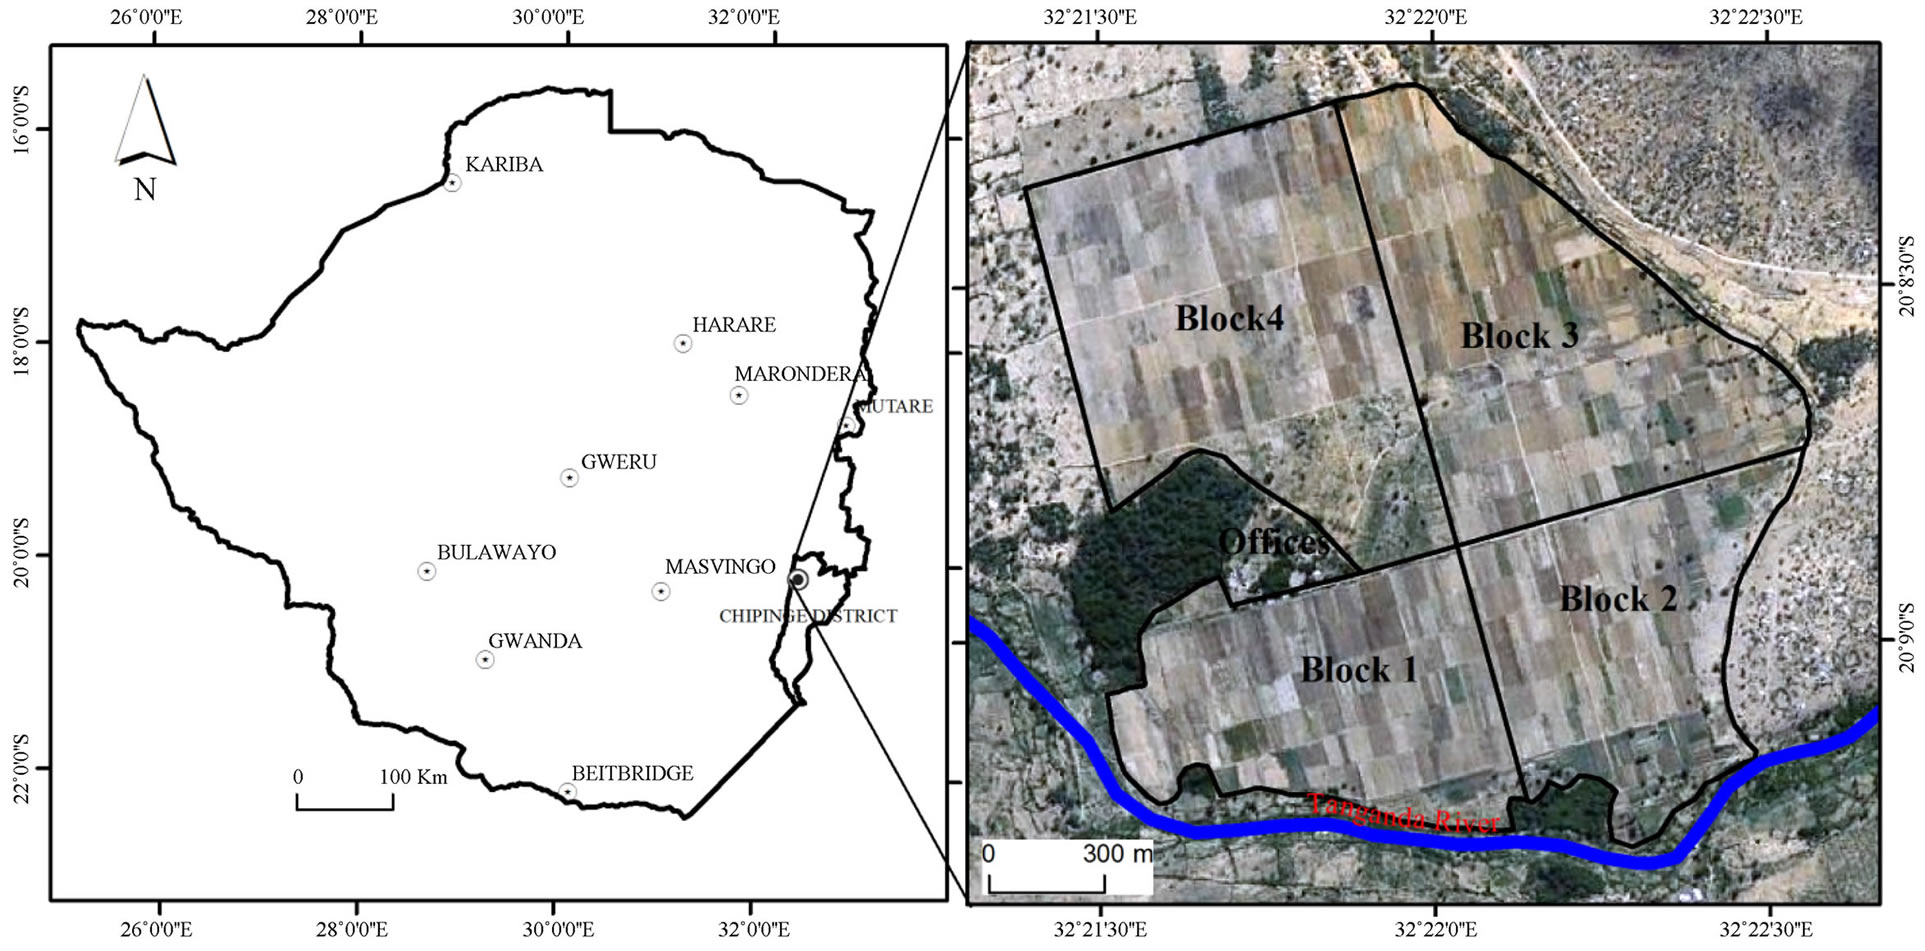
Figure 1. Location of Mutema irrigation schemes in Manicaland and blocks used for sampling. The blocks image was obtained from Google Earth® image.
2.2. Soil Sampling
The scheme was divided into four blocks for purposes of soil sampling (Figure 1). From each of the four blocks four soil samples were collected, each from a subdivision of the block into four equal parts. To collect one sample from each block subdivision, four samples were randomly collected and thoroughly mixed to make one composite sample (Figure 1). Therefore, from each block, four samples were collected. Further 4 samples were collected just outside each of the four blocks to be analyzed as the control sample that would indicate the condition of the soils under rainfed system (>100 m from irrigated plots). In total 20 soil samples were collected; 16 inside the irrigated blocks (four from each block) and 4 outside the irrigation scheme. A soil auger was used to collect the samples up to 30 cm depth and all sampling and sample handling were as described by Okalebo et al. [39]. The soil samples were sent for analysis at the Soils and Chemistry Research Institute in Harare. The samples were analysed for pH (CaCl2), EC, K, Ca2+, Mg2+, Na+ and Total Exchangeable Bases (TEB). The soil samples were collected and analyzed in June 2006 and again in June 2012 using the same procedure.
2.3. Water Sampling
Two water samples were collected for analysing the irrigation water to determine its quality; one from the borehole water and another from the adjacent Tanganda River which is a surface source of irrigation water. The water samples were collected on the 12th of July 2012 to coincide with peak periods of irrigation in the scheme. For the borehole sample, two litres of water were collected from the main irrigation line from the borehole in the fields to represent the water that is actually used for irrigation. The water samples were sent for analysis at the Soils and Chemistry Research Institute in Harare. The water samples were analysed for pH, EC, Ca2+, Mg2+, Na+,  and Cl−. The quality of the water and the soil were assessed using SAR and ESP, calculated from ionic concentrations of Na+, Ca2+, Mg2+ and CEC.
2.4. Data Analysis
Student’s t-test was used to analyse for differences in chemical concentrations inside and outside the scheme as well as between chemical concentrations of samples between 2006 and 2012. Correlation analysis (two-tailed) was performed among the variables using the Pearson correlation coefficient while linear regression analysis was conducted to measure the strength of relationships between some variables. All data analysis was done in R environment v. 3.0.1 [40] and all significance tests were at 95% confidence level.
3. Results
3.1. Hydrochemistry of the Irrigation Water
The borehole irrigation water had higher chemical concentrations than the river water for all major cations having double as much Mg2+, six times as much Na+ and double the amount of carbonates (Table 1). The borehole water had five times as much Cl− than the river water,
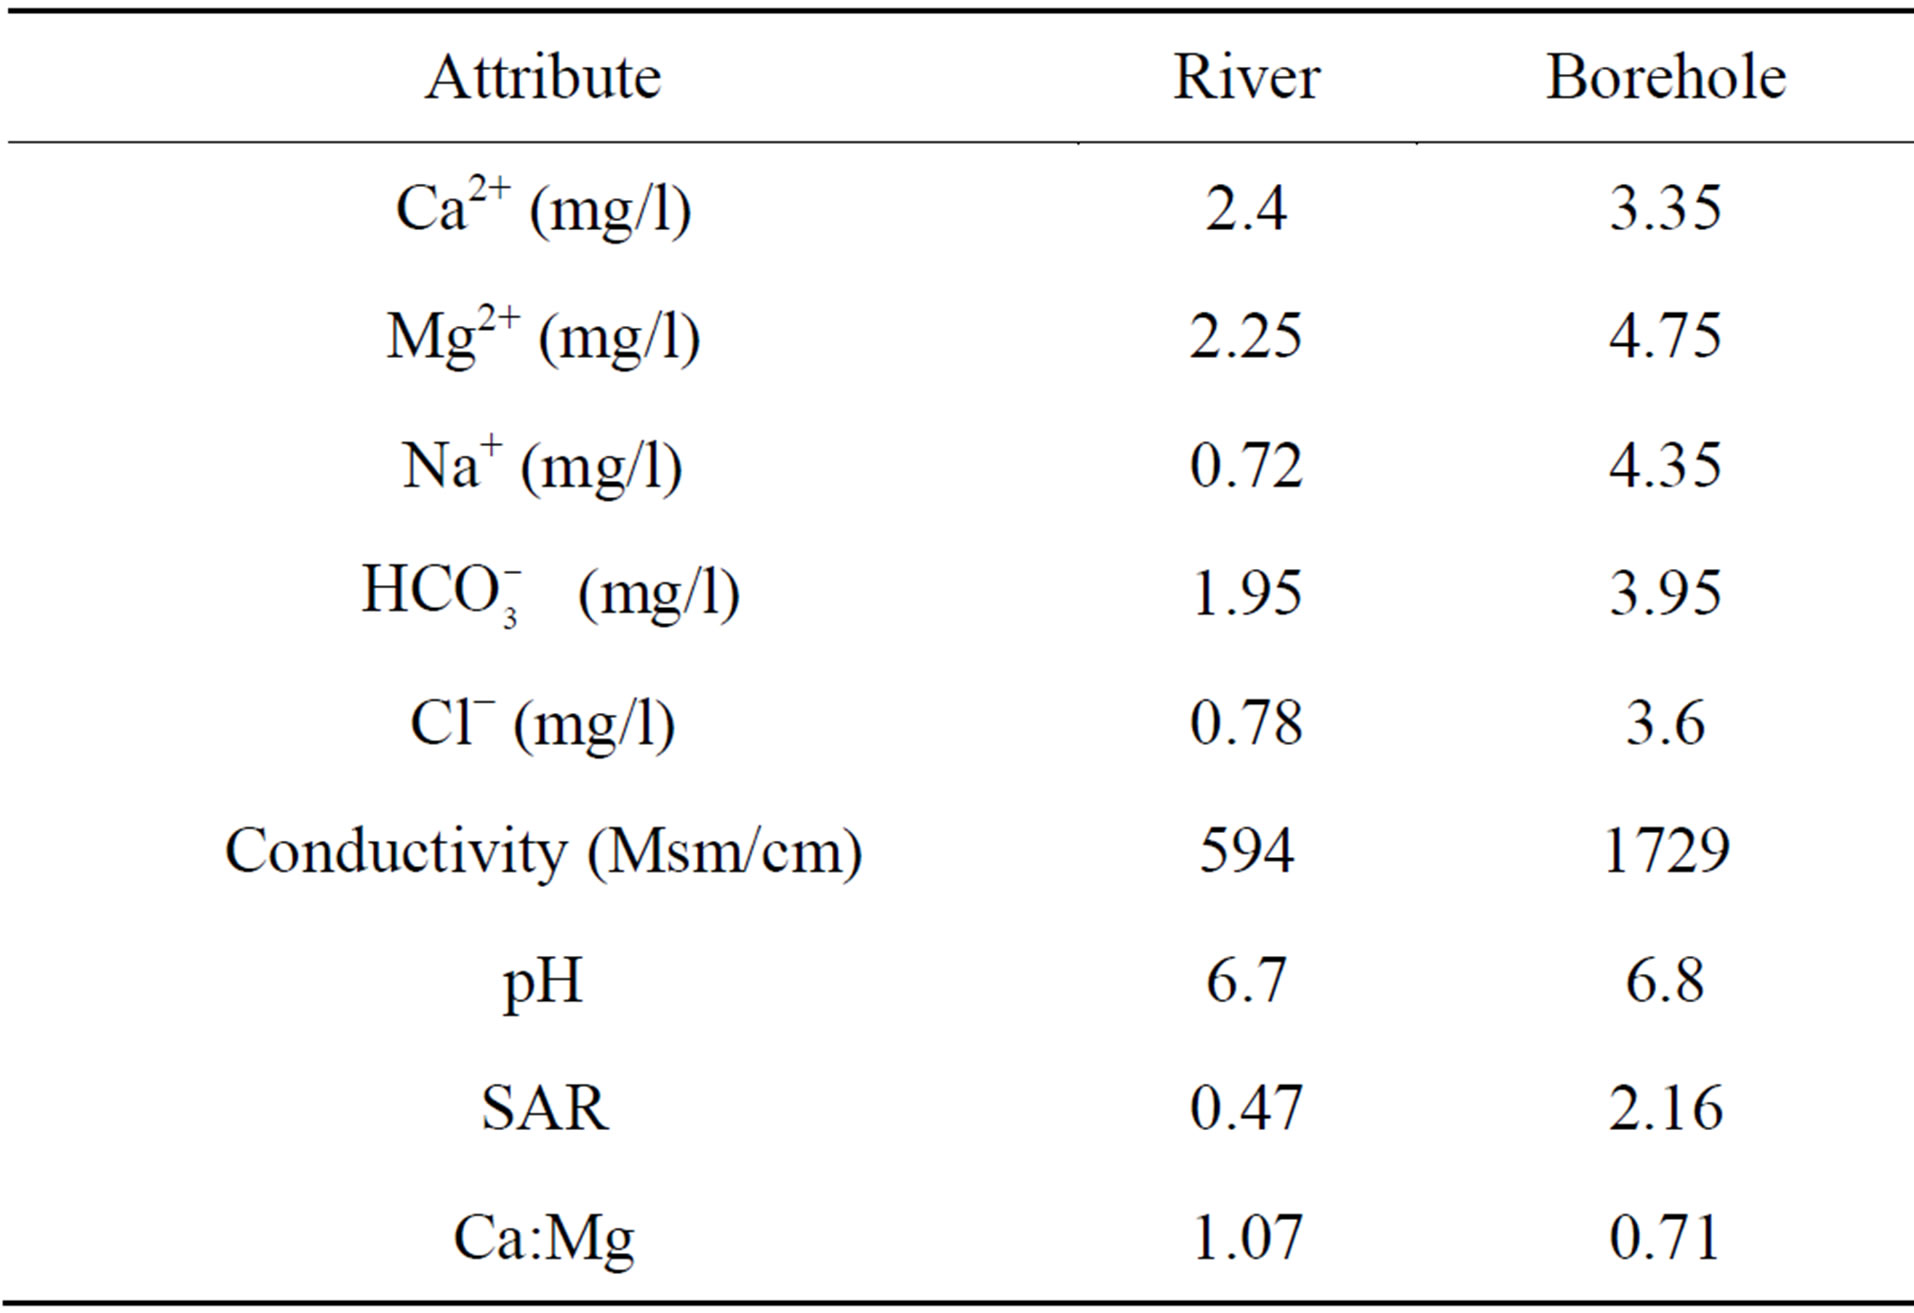
Table 1. Chemical properties of water samples from the river and borehole irrigation water.
and there was a higher conductivity (1729 Msm/cm) in borehole water compared to river water (594 Msm/cm) and this indicated a potential salinity hazard. Although the SAR value was more than four times as much in borehole water (2.16) than in river irrigation water (0.47), there were not much difference in pH values for the borehole and river water which were slightly acidic to neutral (6.8 and 6.7 respectively).
3.2. Chemical Characterization of Soils
3.2.1. Soil pH and Electrical Conductivity
The general soil conditions in Mutema Irrigation Scheme were alkaline with a high pH ranging from 8 to 8.2 for the irrigated parts of the scheme and 7.2 outside the scheme in 2006 (Table 2). For the irrigated blocks, the highest mean pH was for Block 1 (8.2) while the lowest was for Block 3 which had a mean pH of 8.0. In 2012, mean pH values were slightly lower than in 2006 but still reflecting alkaline soils with mean values for the irrigated parts of the scheme above 7.8 while the mean for samples collected outside the scheme was 7.6 (Table 2). For the irrigated blocks the highest mean pH was for Block 3 (7.9) while the other 3 blocks had a mean pH of 7.8. There were significant differences in soil pH between soils in the scheme and those outside the scheme for 2006 (t = 5.48, p < 0.05) and 2012 (t = 6.0, p < 0.05).
There were no significant differences in EC between the irrigated and non-irrigated blocks in 2006 (t = 0.87, p > 0.05, df = 18). In 2006, the highest EC for irrigated blocks was recorded in Block 2 (222.5) while the lowest was for Block 1 (145), which was even lower than that of non-irrigated rainfed parts (153.8). However, samples collected in 2012 indicated that the EC of the blocks inside the scheme is higher than that from the non-irrigated parts of the scheme (t = 5.25, p < 0.05). Results for 2012 indicated that Block 3 and 4 had the highest EC values (380 and 360 respectively) while the lowest for the irrigated blocks was in Block 1 (250), with samples collected outside the scheme having significantly lower EC in 2012 (Table 2).
3.2.2. Soil SAR and ESP
There were highly significant differences in SAR between the irrigated blocks and the non-irrigated soils in the scheme for samples collected in 2006 (t = 3.98, p < 0.001, df = 18). Block 1, 2 and 3 showed high SAR values that were far above the maximum threshold of 13% in 2006 (Table 2). In 2012, Block 4 had very low SAR values (2.89%) which were lower than outside the scheme (11.08%) explaining the lack of significant differences between the irrigated and the outer parts of the scheme (t = 0.62, p > 0.05). In terms of ESP of the topsoil, only Block 3 surpassed the threshold of 9% in 2006, indicating that the soils were sodic in 2006. Like for SAR, all irrigated blocks had higher ESP than the control samples in 2006 but Block 4 had the lowest in 2012 (Table 2).
3.2.3. Exchangeable Cations and Ratios
There were no significant differences in K, Mg2+, Ca2+ and TEB between the irrigated and non-irrigated soils (p > 0.05) in the scheme (Tables 3 and 4). Results for 2006 indicated that Block 1 had the lowest of all exchangeable cations while for 2012; it was Block 4 which had the lower concentrations. Results were not consistent about
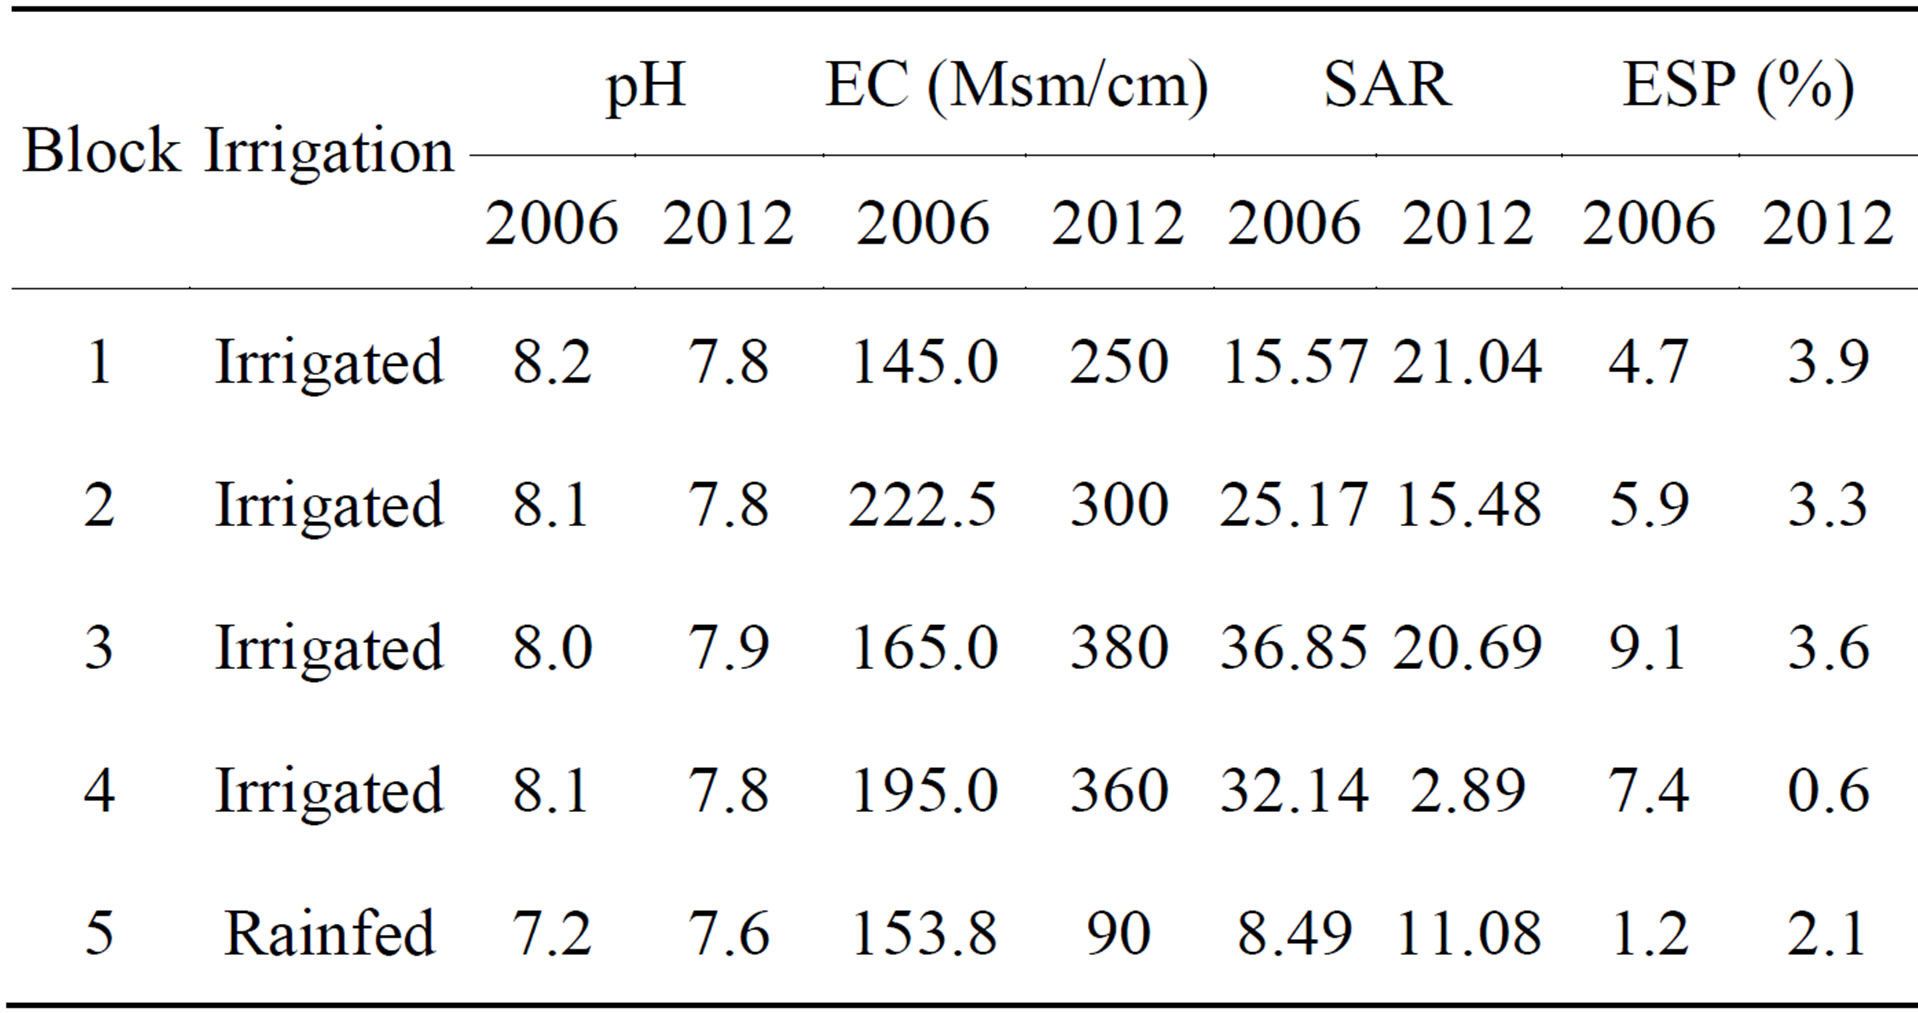
Table 2. Mean values of soil pH, EC, SAR and ESP for Mutema Irrigation Scheme for 2006 and 2012.
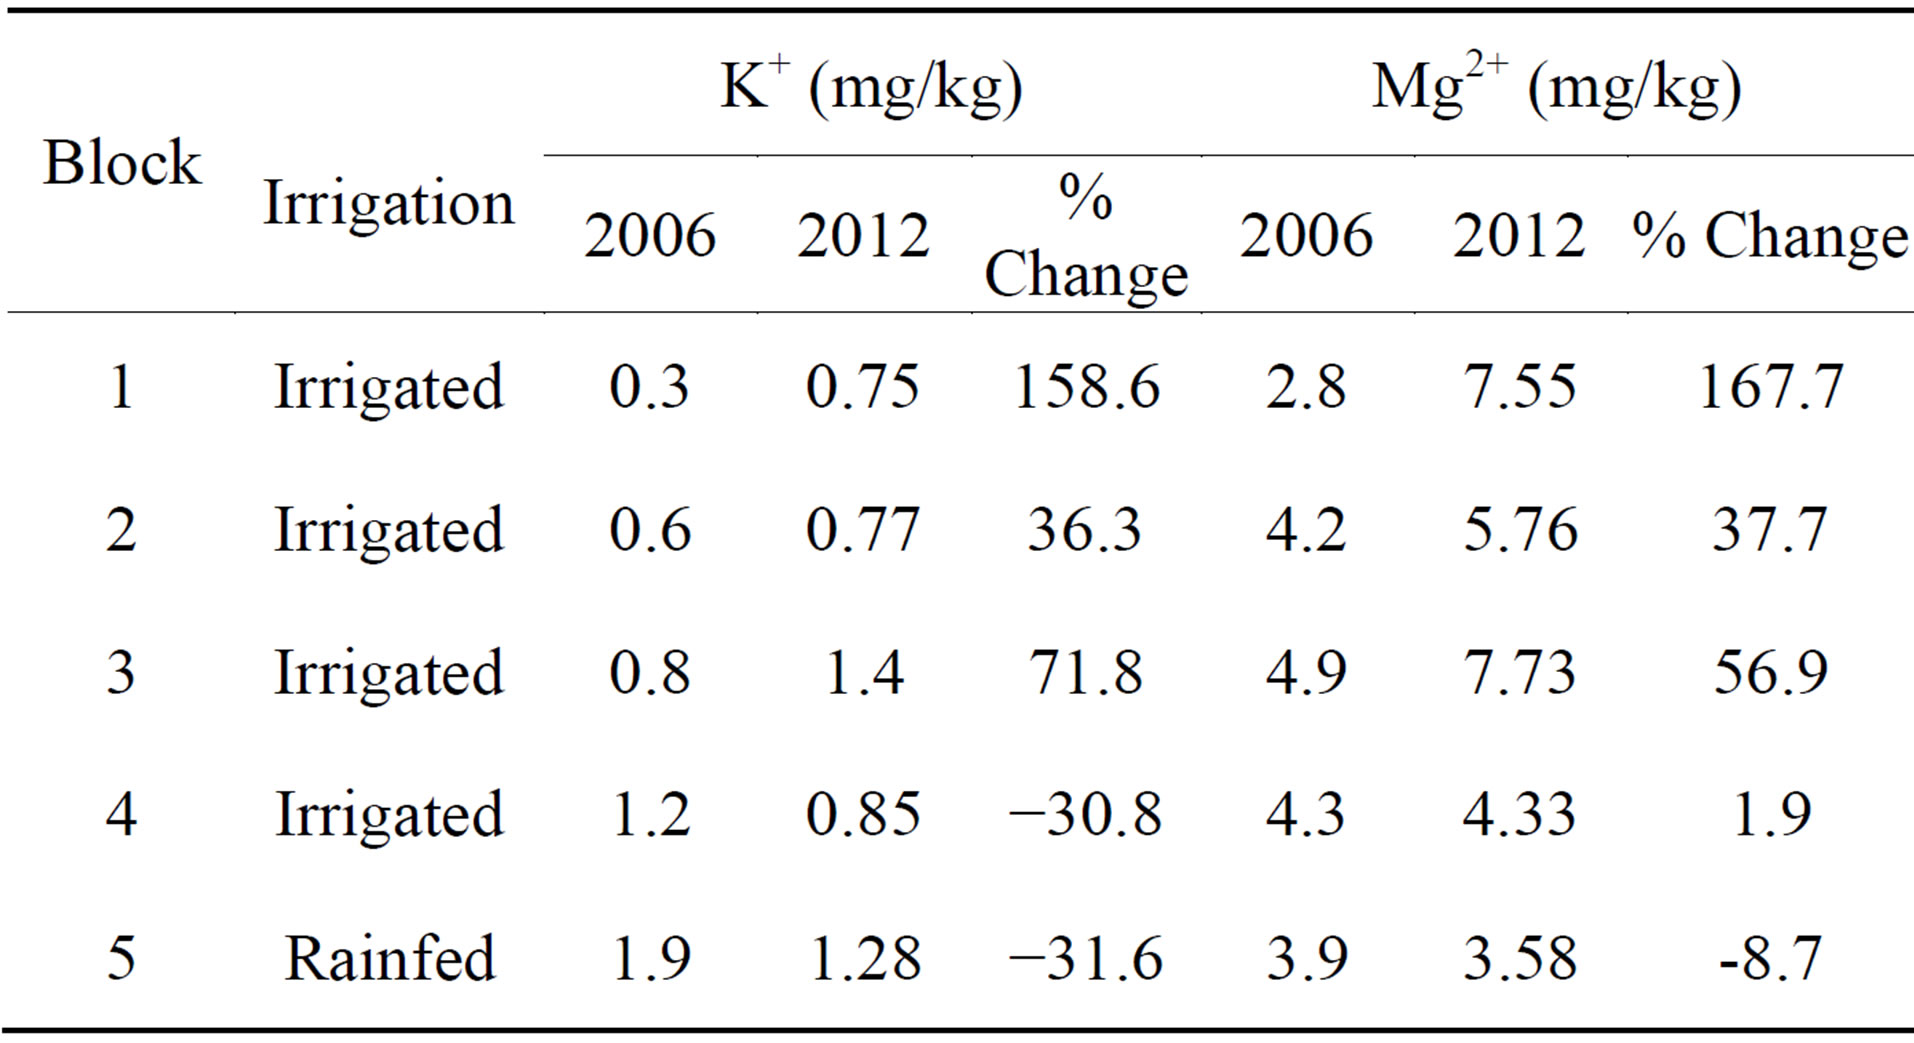
Table 3. Mean concentrations of soil cations K+ and Mg2+ in Mutema irrigation scheme and their change between 2006 and in 2012.
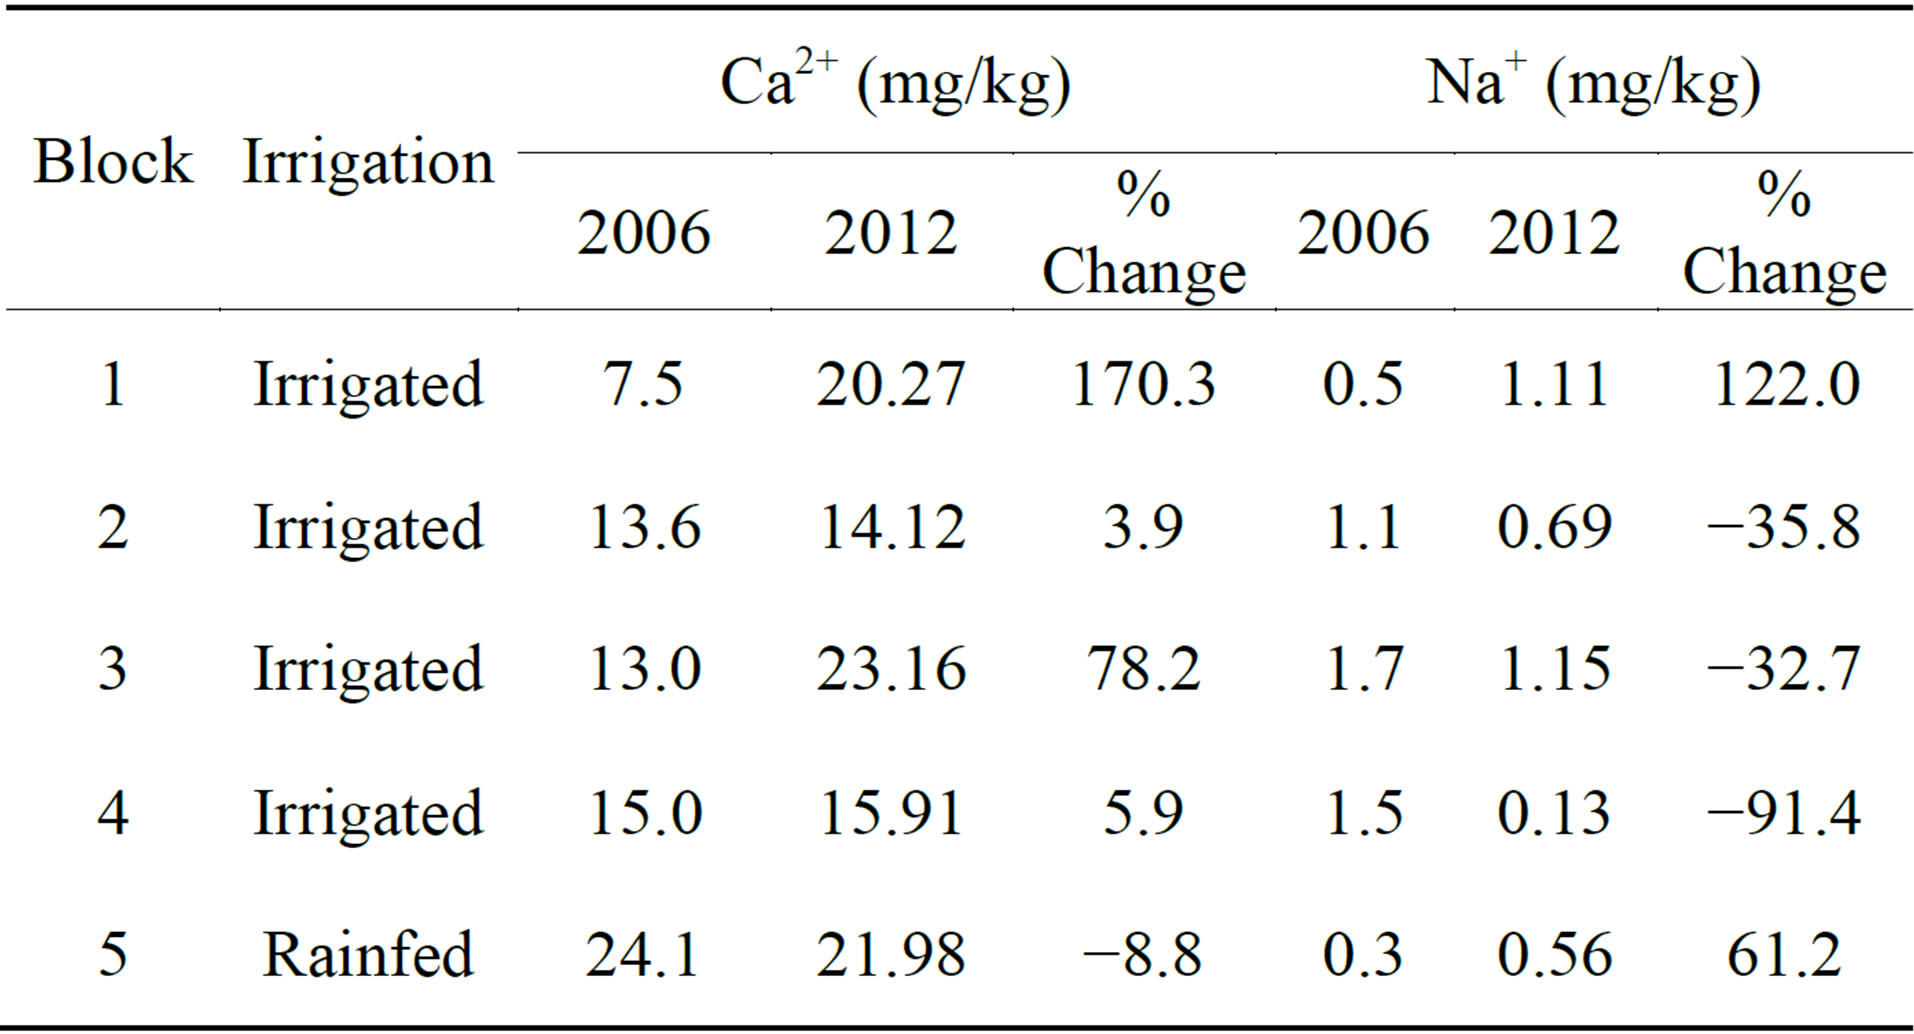
Table 4. Mean concentrations of soil Ca2+ and Na+ in Mutema irrigation scheme and their change between 2006 and in 2012.
changes in concentrations of cations between 2006 and 2012. The soil samples collected outside the scheme had significantly lower Na+ content than those collected from inside the irrigation scheme (p < 0.05, t = 3.20, df = 18). Except for Block 1 and Block 5 (outside), Na+ concentrations increased in the scheme between 2006 and 2012 (Table 4).
There was an increase in Na+ with increase Mg2+ in (R2 = 0.65, p < 0.001, Figure 2) and Ca2+ (R2 = 0.57, p < 0.001, Figure 3) in the soils collected inside the scheme. The soil samples showed that the ratio of Ca2+ to Mg2+ was lower in Block 1 and Block 3 (2.6) while highest in samples outside the scheme (6.1) (Table 4).
4. Discussion
The analysis of groundwater used for irrigation in Mutema Irrigation Scheme has indicated high levels of chloride, bicarbonates and sodium, presenting a hazard to the soils and crops in the scheme. The soils in the schemes had higher pH and exchangeable Na+, ESP and SAR compared to samples collected outside the scheme suggesting that the groundwater was the main source of contamination for the soils in Mutema Irrigation Scheme. Using irrigation water with a bicarbonate hazard results in the pH of the soil rising continually and this will ultimately result in chloroses in plants and other crop production problems [16,19].
The results indicate that approximately 14.4 kg of Cl− are added to the soils in Mutema Irrigation Scheme per hectare per cropping cycle (assuming a cropping cycle of 4 months for vegetables and grains supplied at recommended rates of 25 mm per week [21]. Therefore between 2006 and 2012, about 172 kg Cl−∙ha−1 have been added to the soils of the scheme from the borehole irrigation water (assuming a double cropping cycle per year). This rate of salt build up will largely depend on soil drainage in the scheme. Higher Cl− deposition in agricultural areas has been reported in other areas [5]. According to Mapanda and Mavengahama [21], the maximum permissible soil chloride for crops such as tomatoes
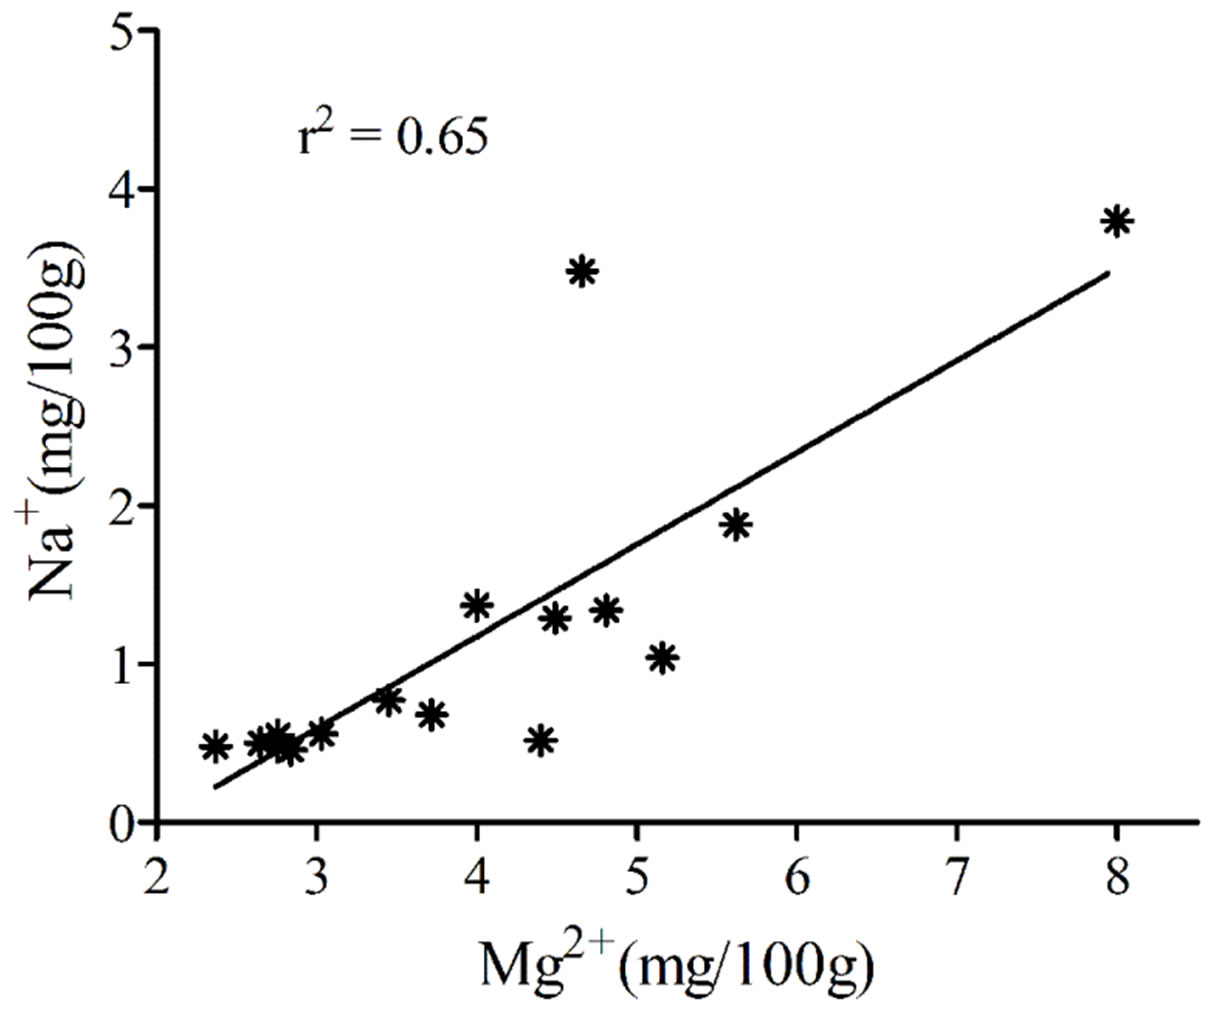
Figure 2. Relationship between Mg2+ and Na+ in the soils of Mutema Irrigation Scheme.
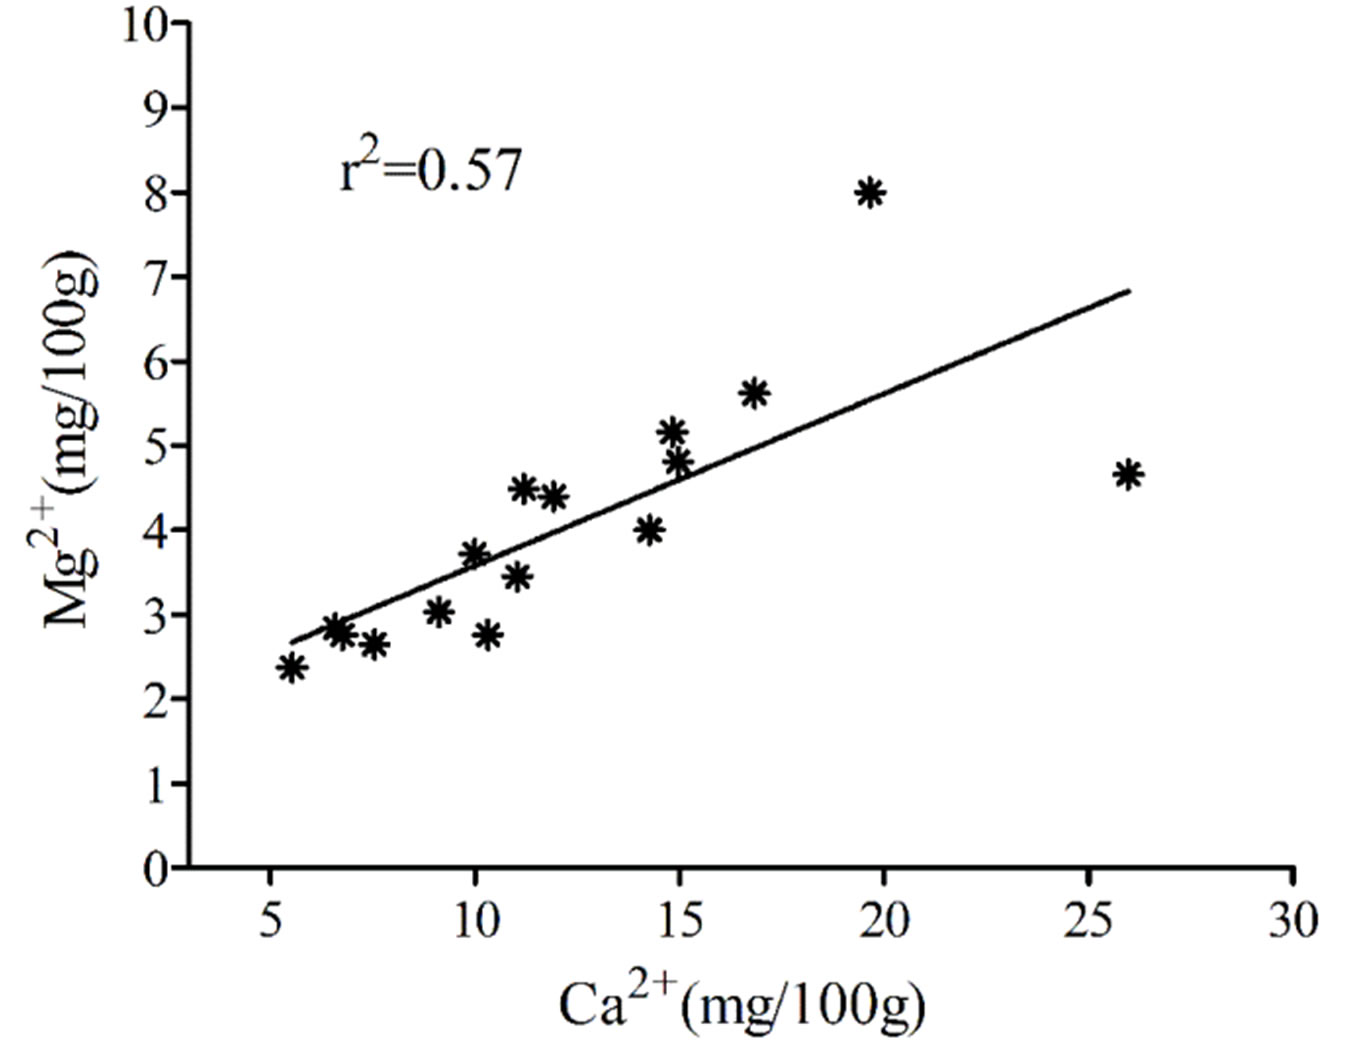
Figure 3. Relationship between Mg2+ and Ca2+ in the soils of Mutema Irrigation Scheme.
and legumes which are common in the scheme is 10 mg/l.
The higher concentration of chloride in the groundwater has potential to affect production of crops given the cumulative nature of chloride in the soils. For example, Ünlükara et al. [11] determined threshold values of 1.5 and 6.7 dS∙m−1 in irrigation water for fruit yield and vegetative dry weight of eggplant (Solanum melongena L.) in field experiments where it was observed that increasing soil salinity results in reduced water uptake and resultantly reduce growth and yields. Similar findings were reported in other crops such as tomatoes, okra, maize and other crops produced in Mutema Irrigation Scheme [41- 45]. Unlike the river water that flows, the higher concentration in the borehole water is attributed to the Save aquifer system that obtains the high soluble salts and sodium from the underlying geological formations [16]. The effects of water and soil quality on crop productivity therefore need to be further investigated in the scheme.
The results indicate that the soils in the scheme are alkaline to the extent that may not support sustainable crop production in some blocks. The soils in the area generally have high pH levels (above 7 for outside the scheme) but irrigation using saline water exacerbates the situation. This is indicated by the fact that the conditions inside the scheme have higher pH, EC, SAR and ESP as shown in by the 2006 and 2012 results (except for Block 4 in 2012). High salinity levels in the scheme as measured by these attributes may be affecting crop plants physically and chemically. Physically, high salinity levels change the osmotic potential between the soils and roots of the plants, thereby reducing the capacity of the plants to absorb water from the soils and transport it through its system for development and functioning of essential parts of the plant system [1,9,17,46]. Chemically, high concentrations of some specific ions such as Na+,  , and C− can be toxic to some crops such as vegetables, maize and wheat, which are sensitive to salinity [1,6]. A soil sample taken in 1990 showed that the soils were already becoming alkaline with pH ranging from 7.2 to 7.8 [36].
In 2012 the results indicated lower concentrations in Block 4, which were lower than outside the scheme. This could be attributed to the lack of cropping in the block between 2006 and 2012 as much of the block was left fallow due to inadequate irrigation since Block 4 is at the end of the line. This means that there is a possibility of improving the soils in the scheme through proper management as shown by the changes in Block 4 between 2006 and 2012. Given the higher SAR percentages in the scheme that exceed the threshold of 13%, it is important that in the short term use corrective treatments are applied in some blocks that are becoming sodic as part of the cropping system for farmers in the scheme. These could include crop rotation, organic soil amendments and use of gypsum and other ameliorants [8,47]. However, these conditions have implications on soil microbial activity and decomposition while increasing erosion hazard and therefore the option of using organic soil amendments maybe slower than expected [9,10].
The effects of the high SAR percentages are that the soil hydraulic system is affected, as aggregates will begin to break down resulting in poor soil structure. This will make the soils less productive as they will be sticky when wet and crusty when dry making tillage operations very difficult [14,15]. In addition, the ion ratios have shown that Mg2+ exceeds Na+ and this indicates that there is excess Na+ which is known to result in poor drainage [46]. Ca2+ is known to counter the dispersion effects of Na+ thereby counteracting the adverse effects of excessive Na+ in the soils [6,10,14]. It is not only the high amounts of soluble salts that have adverse effects on the soil and crops but also high concentrations of specific ions including sodium (1). When both are not favourable for crop production, there will be ripple effects on crop productivity.
The problems of salinity in the scheme could result in poor water and nutrient uptake by a plant which is usually interpreted as lack of adequate irrigation or fertilization (1). This is because the saline conditions in the scheme reduce the osmotic ability of the crops which in turn reduces the ability of the crops to absorb and transport water even when available, resulting in physiological droughts [1,44]. Thus farmers would interpret this as lack of sufficient water supply. There is need for development and implementation of agronomic and water management strategies in the scheme to ensure sustainable crop production. The use of surface water to complement the groundwater source should be considered where it can be used as a dilution or a pre-planting flushing of salts to beyond the root zone [5,20,48,49]. Thus, integration of the surface and groundwater sources could help reduce the problem of salinity in the scheme. Given the limitations in water availability and costs associated with pumping from groundwater sources, there is need to consider irrigation methods that minimise the risk of salinity in schemes like Mutema Irrigation Scheme [48,50,51]. A proper water allocation mechanism may be required in order to ensure that all blocks get sufficient water to meet elevated crop water requirements under saline conditions [5,52].
The application of models to simulate the irrigation requirements and crop production potential under the conditions in the scheme is also required to inform crop production and policy on management of existing schemes and development of new ones in dry areas [18, 27,49]. It may also be important to analyze the temporal variations in both water and soil characteristics in the scheme as reported in other studies [1,23]. A broader and regional water quality assessment protocol such as the one suggested by Chilundo et al. [53] may be required to ensure that irrigation schemes remain productive, especially in countries such as Zimbabwe where access to irrigation infrastructure is an important determinant of successful crop production and associated food security and socioeconomic development [34].
5. Conclusion
The results have indicated that the groundwater presents chloride and bicarbonate hazards to the scheme. The considerably higher soil pH, EC, SAR and ESP in irrigated blocks directly links the use of groundwater for irrigation to the problems of salinity in the scheme. It is therefore recommended that extension workers should train the farmers on sustainable management practices such as a pre-planting irrigation, use of salt tolerant crop varieties, use of acidifying agents such as Ammonium sulphate and use of crop residues as an agronomic input. There is need for more work in this and other irrigation schemes to determine the link between the soil chemical properties and crop yields.
Acknowledgements
We are grateful to AGRITEX extension officers in Mutema irrigation scheme for assisting in collection of soil and water samples in the scheme.
REFERENCES
- M. S. Yidana, P. A. Sakyi and G. Stamp, “Analysis of the Suitability of Surface Water for Irrigation Purposes: The Southwest and Coastal River Systems in Ghana,” Journal of Water Resources and Protection, Vol. 3, No. 1, 2011, pp. 695-710. http://dx.doi.org/10.4236/jwarp.2011.310080
- A. K. Fasedja, “Eastern and Southern African Agricultural Systems: A Problem Perspecitive,” Kilwood Publications, Nairobi, 1999.
- G Fipps, “Irrigation Water Quality Standards and Salinity Management Strategies,” Texas Cooperaive Extension Services, 2007.
- F. Bouksila, A. Bahri, R. Berndtsson, M. Persson, J. Rozema and S. E. A. T. M. Van der Zee, “Assessment of soil salinization risks under irrigation with brackish water in semiarid Tunisia,” Environmental and Experimental Botany, Vol. 92, 2013, pp. 176-185. http://dx.doi.org/10.1016/j.envexpbot.2012.06.002
- P. Verwey and P. Vermeulen, “Influence of Irrigation on the Level, Salinity and Flow of Groundwater at Vaalharts Irrigation Scheme,” Water SA, Vol. 37, No. 2, 2011, pp. 155-164. http://dx.doi.org/10.4314/wsa.v37i2.65861
- R. Munns, “Genes and Salt Tolerance: Bringing Them Together,” New Phytologist, Vol. 167, No. 3, 2005, pp. 645-663. http://dx.doi.org/10.1111/j.1469-8137.2005.01487.x
- FAO, “Global Network on Integrated Soil Management for Sustainable Use of Salt-Affected Soils,” FAO Land and Plant Nutrition Management Service, Rome, 2005.
- V. N. L. Wong, R. S. B. Greene, R. C. Dalal and B. W. Murphy, “Soil Carbon Dynamics in Saline and Sodic Soils: A Review,” Soil Use and Management, Vol. 26, No. 1, 2010, pp. 2-11. http://dx.doi.org/10.1111/j.1475-2743.2009.00251.x
- R. Setia, P. Gottschalk, P. Smith, P. Marschner, J. Baldock, D. Setia and J. Smith, “Soil Salinity Decreases Global Soil Organic Carbon Stocks (In Press),” Science of The Total Environment, 2012.
- D. N. Rietz and R. J. Haynes, “Effects of Irrigation-Induced Salinity and Sodicity on Soil Microbial Activity,” Soil Biology and Biochemistry, Vol. 35, No. 6, 2003, pp. 845-854. http://dx.doi.org/10.1016/S0038-0717(03)00125-1
- A. Ünlükara, A. Kurunç, G. D. Kesmez, E. Yurtseven and D. L. Suarez, “Effects of Salinity on Eggplant (Solanum melongena L.) Growth and Evapotranspiration,” Irrigation and Drainage, Vol. 59, No. 2, 2010, pp. 203-214.
- M. Seilsepour, M. Rashidi and B. Khabbaz, “Prediction of Soil Exchangeable Sodium Percentage Based on Soil Sodium Adsorption Ratio,” American-Eurasian Journal of Agriculture & Environmental Science, Vol. 5, No. 1, 2009, pp. 1-4.
- H. Rahimi, E. Pazira and F. Tajik, “Effect of Soil Organic Matter, Electrical Conductivity and Sodium Adsorption Ratio on Tensile Strength of Aggregates,” Soil & Tillage Research, Vol. 54, No. 3-4, 2000, pp. 145-153. http://dx.doi.org/10.1016/S0167-1987(00)00086-6
- R. S. Ayers and D. W. Westcot, “Water Quality for Agriculture,” FAO Irrigation and Drainage Paper No. 29, Rome, 1985.
- A. O. Affullo, “Irrigation Suitability Assessment of Effluents from West Kano Rice Irrigation Scheme, Kisumu, Kenya,” Ethiopian Journal of Environmental Studies and Management, Vol. 2, No. 2, 2009, pp. 1-11.
- D. Nyamapfene, “The Soils of Zimbabwe,” Nehanda Publishers, Harare, 1984.
- C. Cocozza, C. Pulvento, A. Lavini, M. Riccardi, R. d’Andria and R. Tognetti, “Effects of Increasing Salinity Stress and Decreasing Water Availability on Ecophysiological Traits of Quinoa (Chenopodium quinoa Willd.) Grown in a Mediterranean-Type Agroecosystem,” Journal of Agronomy and Crop Science, Vol. 199, No. 4, 2013, pp. 229-240. http://dx.doi.org/10.1111/jac.12012
- J. Letey and G. L. Feng, “Dynamic versus Steady-State Approaches to Evaluate Irrigation Management of Saline Waters,” Agricultural Water Management, Vol. 91, No. 1-3, 2007, pp. 1-10. http://dx.doi.org/10.1016/j.agwat.2007.02.014
- U. Seeboonruang, “Relationship between Groundwater Properties and Soil Salinity at the Lower Nam Kam River Basin in Thailand,” Environmental Earth Sciences, Vol. 69, No. 6, 2013, pp. 1803-1812. http://dx.doi.org/10.1007/s12665-012-2012-5
- N. Matthews, B. Grové, J. Barnard and L. van Rensburg, “Modelling the Economic Tradeoffs between Allocating Water for Crop Production or Leaching for Salinity Management,” Water SA, Vol. 36, No. 1, 2010, pp. 37-44. http://dx.doi.org/10.4314/wsa.v36i1.50905
- F. Mapanda and S. Mavengahama, “Assessment of Selected Soil Nutrients and Irrigation Water Quality in the Dryland Area of Chivi District, Zimbabwe,” Scientific Research & Essays, Vol. 6, No. 14, 2011, pp. 2918-2927.
- E. Bresler, “Transport of Salts in Soils and Subsoils,” Agricultural Water Management, Vol. 4, No. 1-3, 1981, pp. 35-62. http://dx.doi.org/10.1016/0378-3774(81)90043-3
- C. R. Aza-Gnandji, Y. Xu, L. Raitt and J. Levy, “Salinity of Irrigation Water in the Philippi Farming Area of the Cape Flats, Cape Town, South Africa,” Water SA, Vol. 39, No. 2, 2013, pp. 199-210.
- GOZ, “Support to NEPAD-CADAP Implementation: Bankable Investment Project Profile,” Smallholder Irrigation Development, 2004
- J. M. Makhadho, “An Analysis of Water Management Performance in Smallholder Irrigation Schemes in Zimbabwe,” University of Zimbabwe, Harare, 1994.
- G. Diemer, “Management Processes on Two SmallHolder Sprinkler Layouts: A Case Study from Zimbabwe,” Irrigation and Drainage Systems, Vol. 14, No. 3, 2000, pp. 183-197. http://dx.doi.org/10.1023/A:1026525329369
- I. Samakande, A. Senzanje and E. Manzungu, “Sustainable Water Management in Smallholder Irrigation Schemes: Understanding the Impact of Field Water Management on Maize Productivity on Two Irrigation Schemes in Zimbabwe,” Physics and Chemistry of the Earth, Vol.29, No. 15-18, 2004, pp. 1075-1081. http://dx.doi.org/10.1016/j.pce.2004.08.009
- I. Nyagumbo and J. Rurinda, “An Appraisal of Policies and Institutional Frameworks Impacting on Smallholder Agricultural Water Management in Zimbabwe,” Physics and Chemistry of the Earth, Vol. 47-48, 2012, pp. 21-32. http://dx.doi.org/10.1016/j.pce.2011.07.001
- T. H. Podmore, R. J. McConnen and A. Hungwe, “SmallScale and Smallholder Irrigation in Zimbabwe: Analysis of Opportunities for Improvements,” Water Management Synthesis Report 48, 1986.
- M. M. Sikwela, “Determinants of Household Food Security in the Semi-Arid Areas of Zimbabwe: A Case Study of Irrigated and Non-Irrigated Farmers in Lupane and Hwange Districts,” University of South Africa, 2008.
- G. Nyamadzawo, M. Wuta, J. Nyamangara and D. Gumbo, “Opportunities for Optimization of In-Field Water Harvesting to Cope with Changing Climate in SemiArid Smallholder Farming Areas of Zimbabwe,” Springer Plus, Vol. 2, No. 100, 2013, pp. 1-9.
- N. Mujere, B. Chazovachii, G. Chifodya and A. Mushuku, “Evaluating the Factors Influencing the Variation of Irrigated Wheat Yields: A Case Study of Chinyamutumwa Irrigation Scheme in Zimbabwe,” Journal of Sustainable Development in Africa, Vol. 13, No. 14, 2011, pp. 177- 188.
- E. Manzungu, “Water for Agriculture in Zimbabwe: Policy and Management Options for the Smallholder Sector,” University of Zimbabwe, Harare, 1999.
- H. Bjornlund, “Is Water and Land Redistribution a Driver of Economic Growth and Poverty Reduction? Lessons from Zimbabwe,” Water International, Vol. 34, No. 2, 2009, pp. 217-229. http://dx.doi.org/10.1080/02508060902855599
- K. Nhundu, C. Gwata and A. Mushunje, “Impacts of Zimbabwe European Union Micro-Project Programme (ZIM/EU MPP) in Funding Smallholder Irrigation Projects on Food Security and Income Levels: A Case Study of Mopane Irrigation Scheme in Zvishavane, Midlands Province, Zimbabwe,” African Journal of Agricultural Research, Vol. 5, No. 14, 2010, pp. 1759-1771.
- R. O’Duk and B. Banda, “Irrigation Design for Mutema Irrigation Scheme,” FAO and AREX, Harare, 1994.
- L. Chidoko, “A History of Mutema Irrigation Scheme, 1928-1972,” University of Zimbabwe, Harare, 2010.
- I. P. Anderson, P. J. Brinne, M. Moyo and B. Nyamwanza, “Physical Resource Inventory of Communal Lands of Zimbabwe—An Overview,” NRI Bulletin 60, NRI, Harare, 1993.
- R. J. Okalebo, K. W. Gathua and P. L. Woomer, “Laboratory Methods for Soil and Plant Analysis: A Working Manual,” 2nd Edition, TSBF-CIAT and SACRED Africa, Nairobi, 2002.
- R Core Team, “R: A Language and Environment for Statistical Computing,” R Foundation for Statistical Computing, Vienna, 2013.
- E. Yurtseven, G. D. Kesmez and A. Ünlükara, “The Effects of Water Salinity and Potassium Levels on Yield, Fruit Quality and Water Consumption of a Native Central Anatolian Tomato Species (Lycopersicon esculantum),” Agricultural Water Management, Vol. 78, No. 1-2, 2005, pp. 128-135. http://dx.doi.org/10.1016/j.agwat.2005.04.018
- A. Latef, A. A. Hamed and C. He, “Effect of Arbuscular Mycorrhizal Fungi on Growth, Mineral Nutrition, Antioxidant Enzymes Activity and Fruit Yield of Tomato Grown under Salinity Stress,” Scientia Horticulturae, Vol. 127, No. 3, 2011, pp. 228-233. http://dx.doi.org/10.1016/j.scienta.2010.09.020
- G. Psarras, M. Bertaki and K. Chartzoulakis, “Response of Greenhouse Tomato to Salt Stress and K+ Supplement,” Plant Biosystems, Vol. 142, No. 1, 2008, pp. 149-153. http://dx.doi.org/10.1080/11263500701872903
- A. Ünlükara, A. Kurunç, G. Kesmez and E. Yurtseven, “Growth and Evapotranspiration of Okra (Abelmoschus Esculentus L.) as Influenced by Salinity of Irrigation Water,” Journal of Irrigation and Drainage Engineering, Vol. 134, No. 2, 2008, pp. 160-166. http://dx.doi.org/10.1061/(ASCE)0733-9437(2008)134:2(160)
- N. Katerji, J. W. van Hoorn, A. Hamdy and M. Mastrorilli, “Salt Tolerance Classification of Crops According to Soil Salinity and to Water Stress Day Index,” Agricultural Water Management, Vol. 43, No. 1, 2000, pp. 99-109. http://dx.doi.org/10.1016/S0378-3774(99)00048-7
- B. D. Seelig, J. L. Richardsen and W. T. Barker, “Characteristics and Taxonomy of Sodic Soils as a Function of Landscape Position,” 2005. http://www.soilscisoc.ndsu.edu.html
- G. Murtaza, B. Murtaza, H. M. Usman and A. Ghafoor, “Amelioration of Saline-Sodic Soil Using Gypsum and Low Quality Water in Following Sorghum-Berseem Crop Rotation,” International Journal of Agriculture and Biology, Vol. 15, No. 4, 2013, pp. 640-648.
- M. T. Dastorani, M. Heshmati and M. A. Sadeghzadeh, “Evaluation of the Efficiency of Surface and Subsurface Irrigation in Dryland Environments,” Irrigation and Drainage, Vol. 59, No. 2, 2010, pp. 129-137.
- D. Love, P. van der Zaag, S. Uhlenbrook and R. J. S. Owen, “A Water Balance Modelling Approach to Optimising the Use of Water Resources in Ephemeral Sand Rivers,” River Research and Applications, Vol. 27, No. 7, 2011, pp. 908-925.
- S. van der Kooij, M. Zwarteveen, H. Boesveld and M. Kuper, “The Efficiency of Drip Irrigation Unpacked,” Agricultural Water Management, Vol. 123, 2013, pp. 103-110. http://dx.doi.org/10.1016/j.agwat.2013.03.014
- W. de Lange, B. Mahumani, M. Steyn and S. Oelofse, “Monetary Valuation of Salinity Impacts and Microbial Pollution in the Olifants Water Management Area, South Africa,” Water SA, Vol. 38, No. 2, 2012, pp. 241-248. http://dx.doi.org/10.4314/wsa.v38i2.9
- H. C. Komakech, M. Condon and P. van der Zaag, “The Role of Statutory and Local Rules in Allocating Water between Largeand Small-Scale Irrigators in an African River Catchment,” Water SA, Vol. 38, No. 1, 2012, pp. 115-126. http://dx.doi.org/10.4314/wsa.v38i1.14
- M. Chilundo, P. Kelderman and J. H. Ókeeffe, “Design of a Water Quality Monitoring Network for the Limpopo River Basin in Mozambique,” Physics and Chemistry of the Earth, Vol. 33, No. 8-13, 2008, pp. 655-665.