Journal of Water Resource and Protection
Vol.4 No.9(2012), Article ID:22727,7 pages DOI:10.4236/jwarp.2012.49088
The Monte Carlo-Based Uncertainty Health Risk Assessment Associated with Rural Drinking Water Quality
1Key Laboratory of Agricultural Environmental Engineering, Sichuan Agricultural University, Ya’an, China
2College of Information and Engineering, Sichuan Agricultural University, Ya’an, China
Email: *nfq1965@163.com
Received June 29, 2012; revised August 2, 2012; accepted August 14, 2012
Keywords: Monte Carlo; Health Risk; Water Quality; Triangular Fuzzy-Number; Mingshan County
ABSTRACT
In this study, Triangular Fuzzy-number of the Fuzzy Set Theory was introduced to reform parameters of those previous health risk assessment (HRA) models, Monte Carlo simulation parameter was applied to lower the randomness and fuzziness of the HRA system, and the Monte Carlo-United States Environmental Protection Agency (MC-EPA) model was employed to evaluate the health risk associated with water quality (HRWQ), so as to solve the uncertainty HRA associated with rural drinking water quality. Results showed that the water in Mingshan was contaminated mainly by Cr(VI), nitrate, fluoride and Fe. The health risk primarily embodied in the carcinogenic risk (CR) caused by Cr(VI) that generally exceeds the limit while little non-carcinogenic toxic effected presents. However, non-carcinogenic risk (NCR) in some water resources was high, exceeding the limit “1”. The results revealed the health risk level of the water quality and the health risk degree caused by the pollutants, providing scientific support for the management of the HRWQ of the WR. It also indicated the significance of MC-EPA model’s application.
1. Introduction
Along with the sustainable and speedy economic development, water contamination has become more serious with many toxic and harmful substances being discharged into the environment, posing long-term potential threat to the residents’ health [1-3]. As a result, more attention is paid to health risk associated with water quality (HRWQ) [4-8]. How to implement qualitative and quantitative presentation of the contamination degree of those chemicals in water and to indicate directly the hazards to people by risk level become a key in the health risk assessment (HRA) associated with rural drinking water quality. Currently, most domestic researches applied the model recommended by United States Environmental Protection Agency (US EPA) to calculate the HRA for single water source, but little researches focused on the HRA for the regional water resources and the establishment of HRA parameter in county scale [9,10]. Setting rural areas as the studied object and on the basis of the specific drinking water condition of residents, this study analyzed the uncertainty of the model recommended by US EPA and implemented a comprehensive evaluation of the rural drinking water-related health risk to human health.
2. Materials and Methods
2.1. Sampling, Detection and Hazard Index Discrimination
In 2010, 42 samples (Figure 1) were collected in 21 towns of Mingshan County, based on comprehensive consideration of the studied area’s topography, hydrography, water system, the distribution of water-borne diseases and the types of water supply projects. Relevant chemical index in the 42 samples were detected and referring to the results, hazard index below the limit set by the Standard Examination Methods for Drinking Water is excluded and Cr(VI), iron, fluoride and nitrate are set as the index for water quality evaluation [10], among which Cr(VI) is set as carcinogenic index, and the detection value of indexes is shown in Table 1.
In the investigation, the residents’ exposure parameters (daily water intake rate, weight, height and age, etc.) were examined as well and 687 people were included, among which 591 are adults aging from 18 to 60.
2.2. Construction of MC-EPA Model
The US EPA model [11] presented the long-term daily water intake amount and its corresponding carcinogenic and non-carcinogenic level. Actually, great uncertainty and fuzziness lie in the HRA due to the incomplete
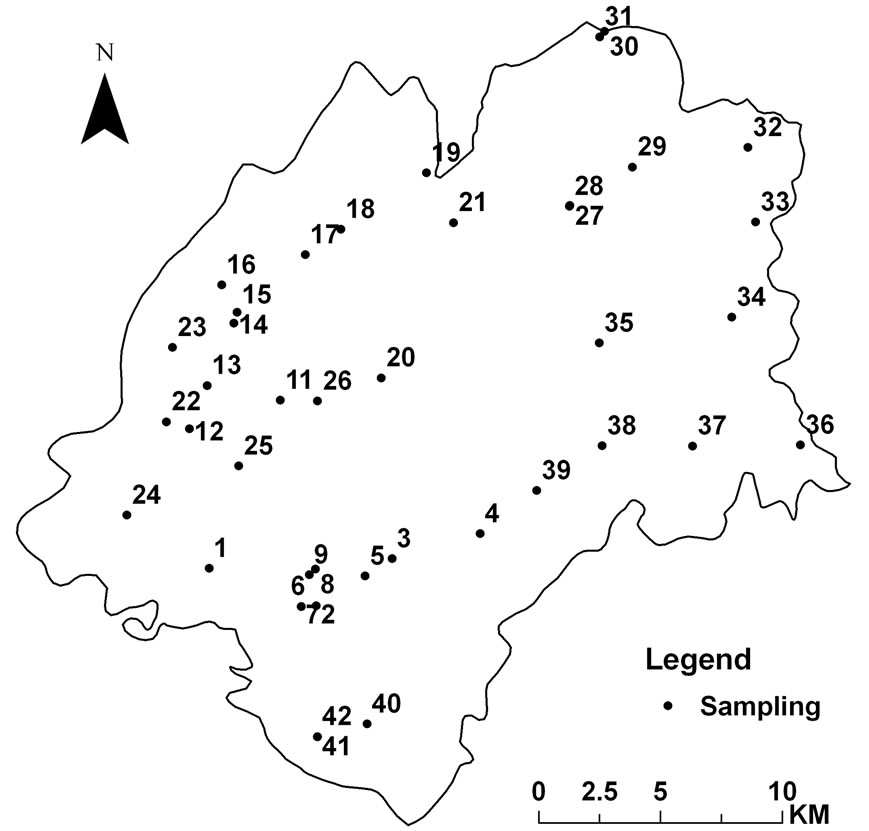
Figure 1. The distribution of sampling sites.
analysis, the extraction, applicability and assumption of model parameters, and the inaccuracy in measurement, sampling, experiment analysis, description and professional judgment as well as the spatial and temporal variations of chemicals’ concentration both in surface water and ground water. At present, Monte Carlo Simulation is often used to deal with those uncertainly issues, it apply the method of probabilistic statistics to indicate the uncertainty of parameters, thus, it can present better risk identification and exposure assessment. And its analysis procedure is: define the statistical distribution law of input parameters; sample randomly parameters from its statistical distribution; repeat the model simulation by using parameters obtained by random sampling; analyze the output value to reach a reasonable result. Based on those steps, MC-EPA model is developed to implement the HRA associated with rural drinking water quality in Mingshan County.
2.2.1. Stochastic Simulation of Parameters
Parameters of health risk model comply with Gaussian distribution or approximate [8,12]. However, the insufficiency and incompleteness of data affected the HRA results. Recently, Triangular Fuzzy-number has been applied to match approximately the Gaussian distribution and some results were obtained [12]. In this study, parameters are transformed into Triangular Fuzzy-numbers, and then stochastic simulation of Triangular Fuzzy-numbers is carried out. In this way, many possible values of parameters that conform to some extent with the actual situation of the studied areas can be obtained.
a1, a2, a3 (a1 ≤ a2 ≤ a3) are defined correspondingly as the minimum value (MI), the most probable value (MP) and the maximum value (MA) of fuzzy variable A, therefore, A can be represented by Triangular Fuzzy-


Table 1. Detection value of rural drinking water quality hazard index.
number 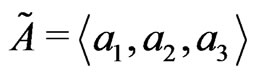 [13] to which
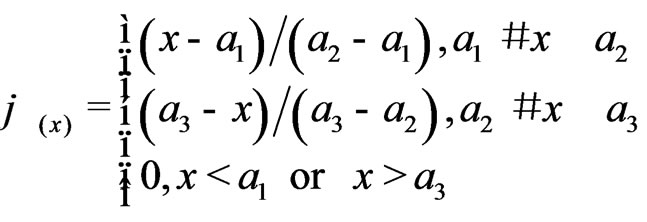
  is the membership function.
 (1)
(1)
where, x refers to the probable value of fuzzy variables in the universe.
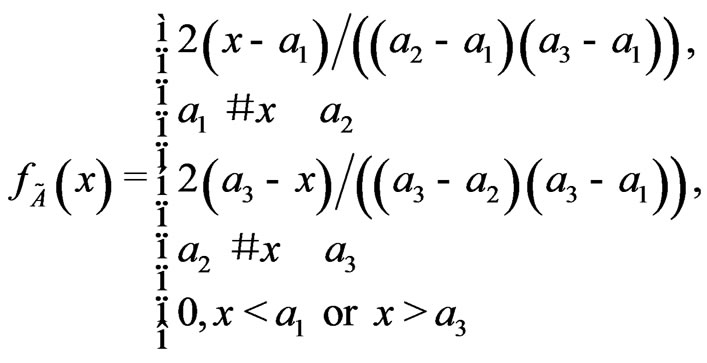
Divide the square measure framed by axis x and the curve of the membership function  by
by  to obtain the probable reliability density function of
  [14]:
[14]:
 (2)
(2)
Transform 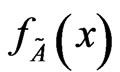 into probability distribution function and obtain the stochastic simulation formula of x by the inverse transform method [14,15]:
 (3)
(3)
where, u refers to uniform random numbers within the interval of [0,1], which can be obtained by Matlab using rand order.
2.2.2. Monte Carlo-Based Health Risk Value Calculation
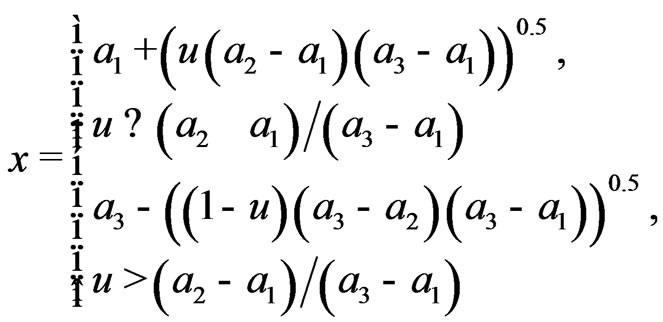
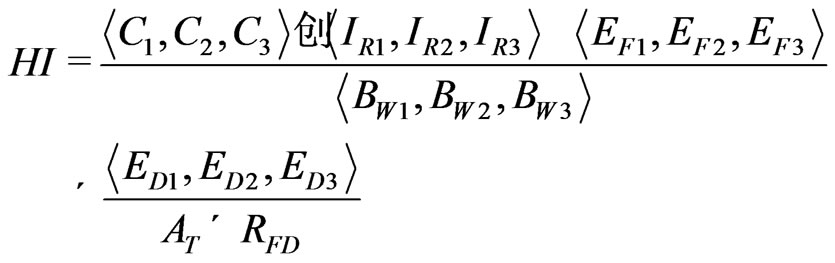
Based on the assumption that the state of water quality is R in the evaluation system for HRWQ and the given limit value of water quality standard is RZ, then the HRWQ can be defined as:
 (4)
(4)
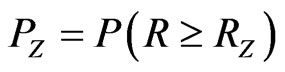
where, R refers to both CR and hazard index (HI) and its calculation formula is as following:
 (5)
(5)
 (6)
(6)
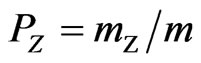
where, PZ can be taken as the reliability when the water quality state R exceeds the standard limit RZ.  is the stochastic simulation value, where C1, C2, C3 refer correspondingly to the MI, the MP and the MA of pollutants concentration;
  is the stochastic simulation value where IR1, IR2, IR3 correspondingly refer to the MI, the MPV and the MA of water drinking rate;
  is stochastic simulation value (SSV), where EF1, EF2, EF3 state correspondingly to the MI, the MP and the MA of the exposure frequency;
  is the SSV, where ED1, ED2, ED3 refer correspondingly to the MI, the MP and the MA of the exposure duration;
  is the SSV, where BW1, BW2, and BW3 correspondingly refer to the MI, the MP and the MA of the weight; AT refers to the average time (the suggesting value is 70 a × 365 d·a–1); RFD is the referring dose (mg·kg–1·d–1).
By applying the stochastic simulation of parameters, the simulation sequence of parameters {x|i = 1, 2, 3,···, m} in the evaluation system for HRWQ can be obtained from Equation (3) and the simulation sequence of water quality state {Ri|i = 1, 2, 3,···, m} can be obtained from Equations (5) and (6), and m is the simulation times. Researches [15] indicated that the more times the experiment is repeated, the frequency distribution of R ws closer to actual probability, therefore, the value of m is set where the frequency distribution reaches convergence and mZ refers to the times R exceeds the standard limit RZ.
Therefore, the reliability of the interval of HRWQ is:
 (7)
(7)
2.3. Health Risk Assessment
Information of chemicals (Fe, Cr(VI), nitrate and fluoride), weight and drinking water ingestion rate was dealt with according to the investigation on the exposure parameters of residents who rely on the 42 water resources in Mingshan County and by applying the MC-EPA model. The results showed as Table 2.
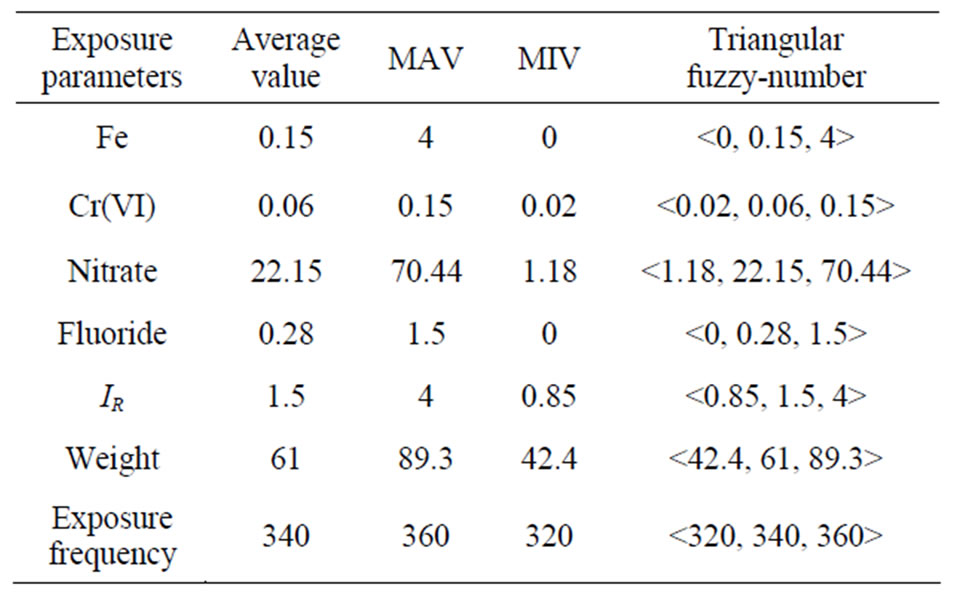
Table 2. Exposure parameters statistics.
In the data dealing process, data too far from the rest is excluded and the average value, the MA and the MI in the investigation are set correspondingly as the MP, the MA and the MI of the Triangular Fuzzy-number. The average health risk caused by various chemicals to individuals and the reliability of the health risk can be obtained from Equations (3) and (4), as is shown in Tables 3 and 4.
Referring to the above results obtained from the simulation experiments, the results will reach convergence when the experiment is simulated as many as 100,000 times, i.e. according to the MC-EPA model, 100,000 times of simulation experiments can obtain the CR, NCR and the reliability of the risk interval, as is shown in Tables 5 and 6.
3. Results Analysis
3.1. NCR Assessment
According to the definition of hazard index, the risk standard of non-carcinogenic chronic toxic effect can be set as “1”. Table 3 indicates that the average hazard index of the total water quality in Mingshan County is 0.6681 below the risk standard and the corresponding reliability of total hazard index within interval 0 - 0.1, interval 0.1 - 0.2, interval 0.2 - 0.5, interval 0.5 - 1 and interval greater than 1 is 29.39%, 21.87%, 39.43%, 9.48% and 0. According to the hazard index value, they can be ranked as follows: Cr (VI) > nitrate > fluoride > Fe. The corresponding average hazard index of Cr(VI), nitrate, fluoride and Fe is 0.2983,0.2101, 0.0894 and 0.0703.
As Table 5 shown, the hazard index of samples No.11, 12, 19, 22, 37, 38 and 39 exceed the standard limit “1” and their corresponding reliability are 21.24%, 16.93%, 98.88%, 50.69%, 26.7%, 73.46% and 63.45%. That Cr(VI) and nitrate exceed the standard is the main cause for the excessive hazard index. And the hazard index of sample 40 is at the critical point of 0.9227. It is highly recommend that relevant administrations implement monitoring, investigation and management of WR whose hazard index are at the critical point as well as WR that
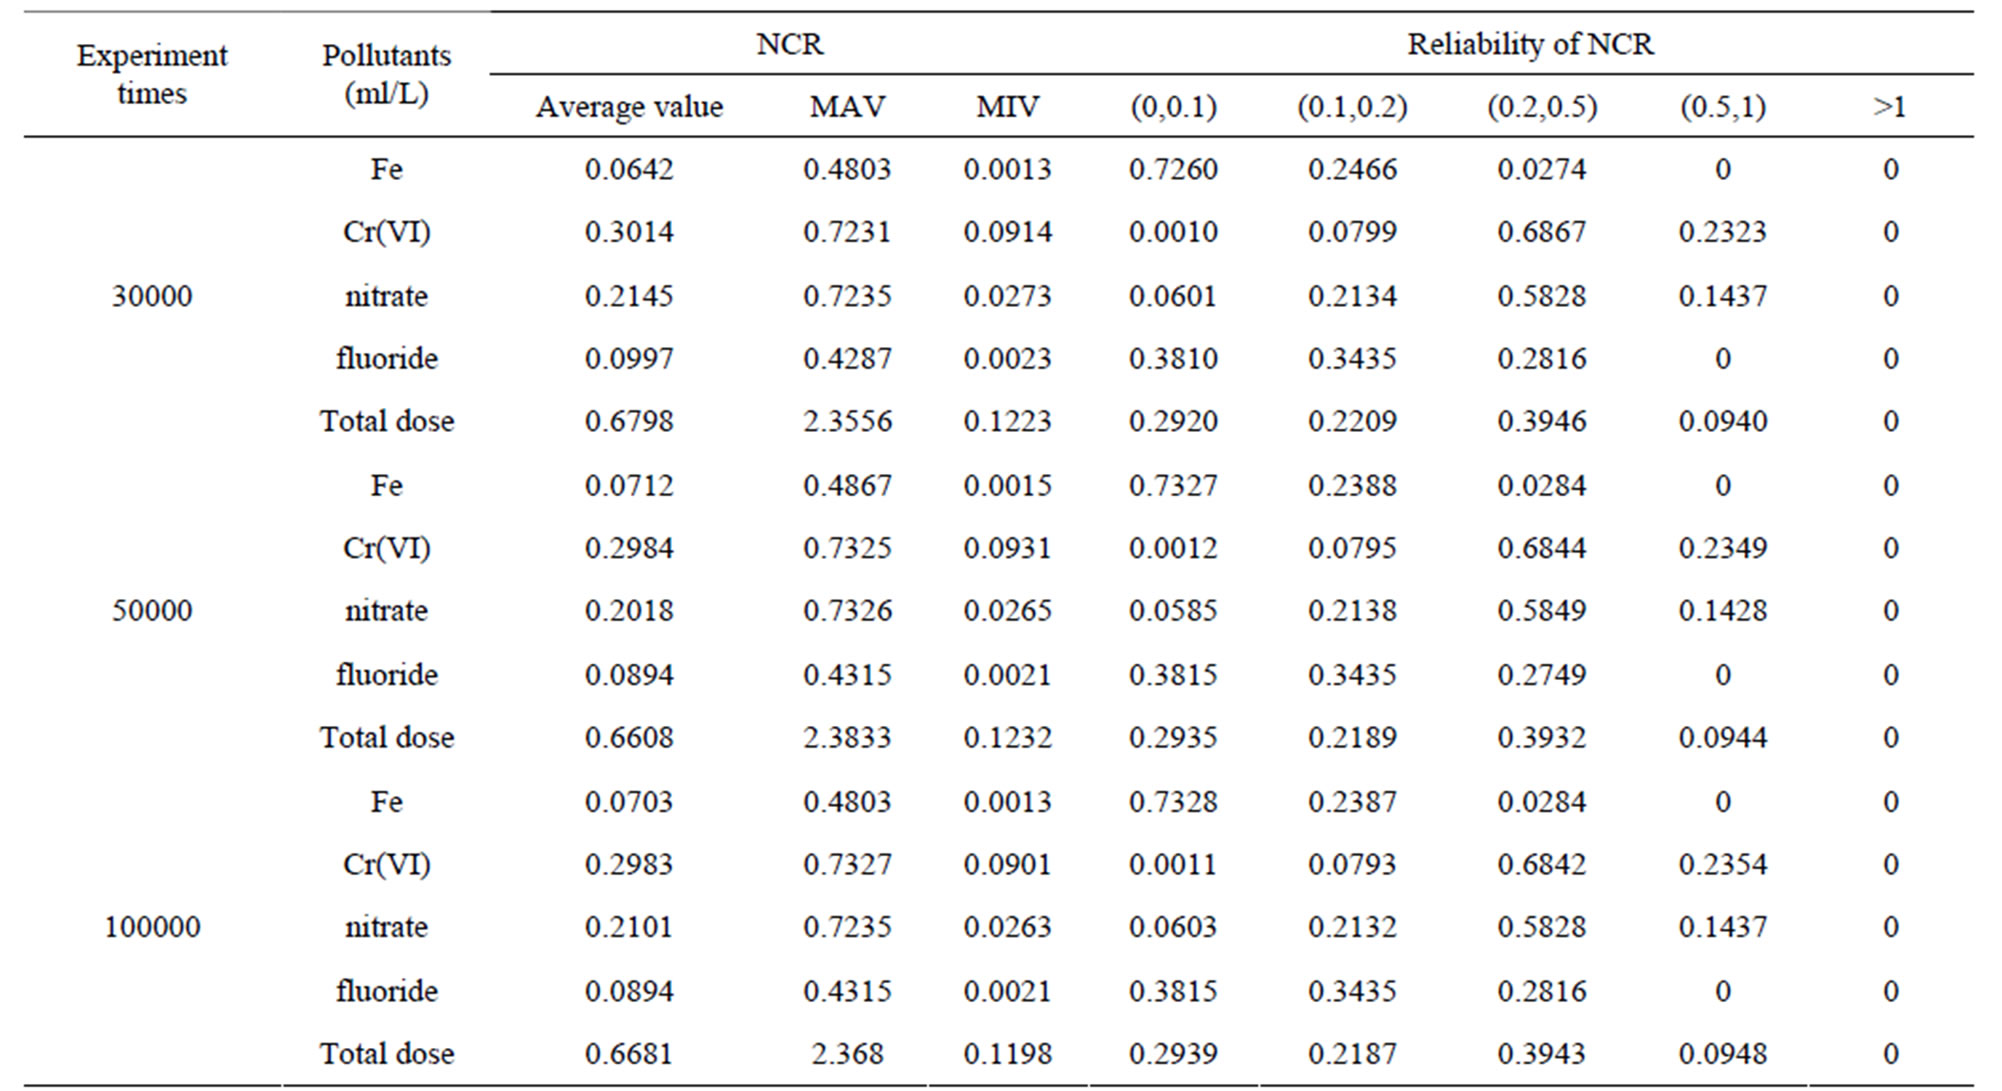
Table 3. Calculation results of total NCR.
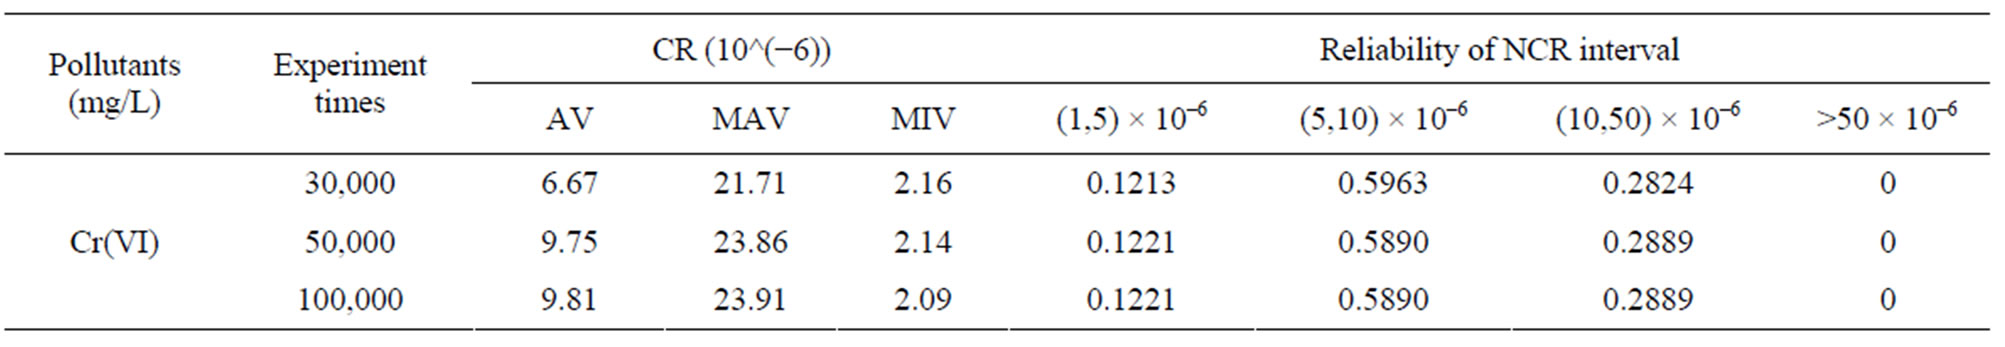
Table 4. Calculation results of total CR.
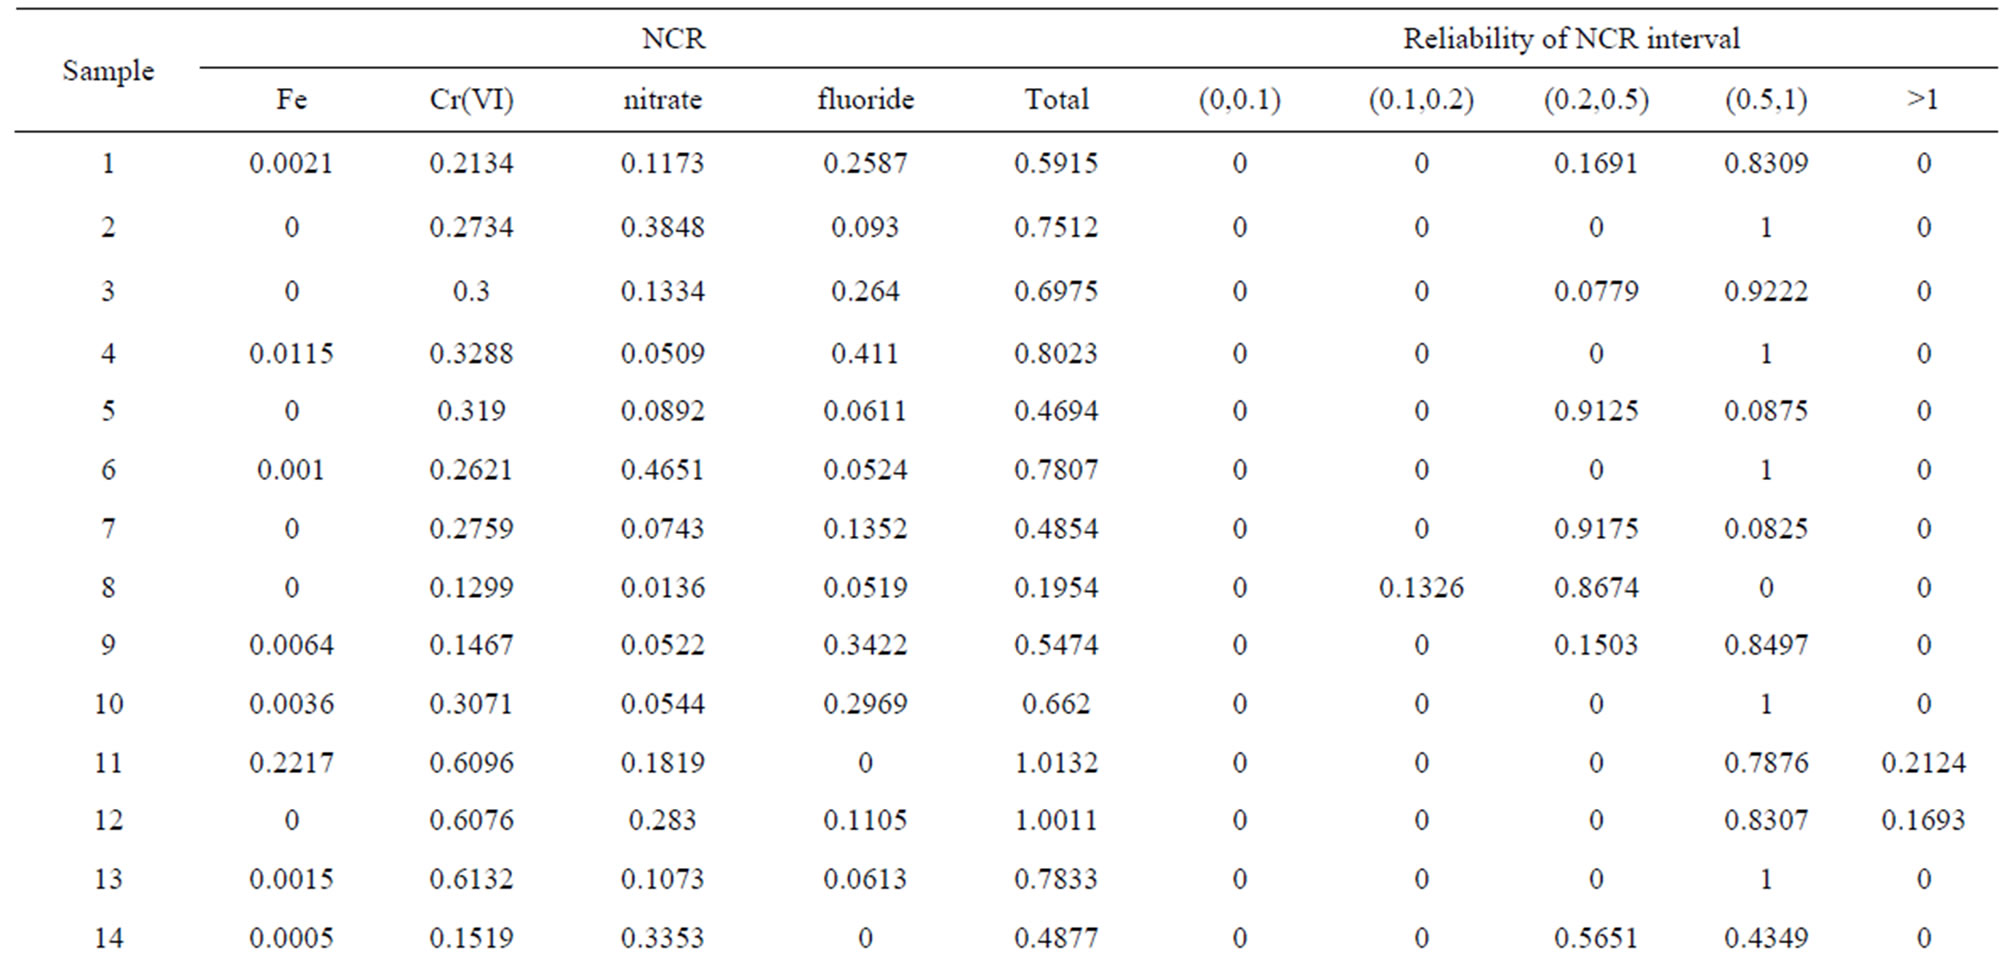
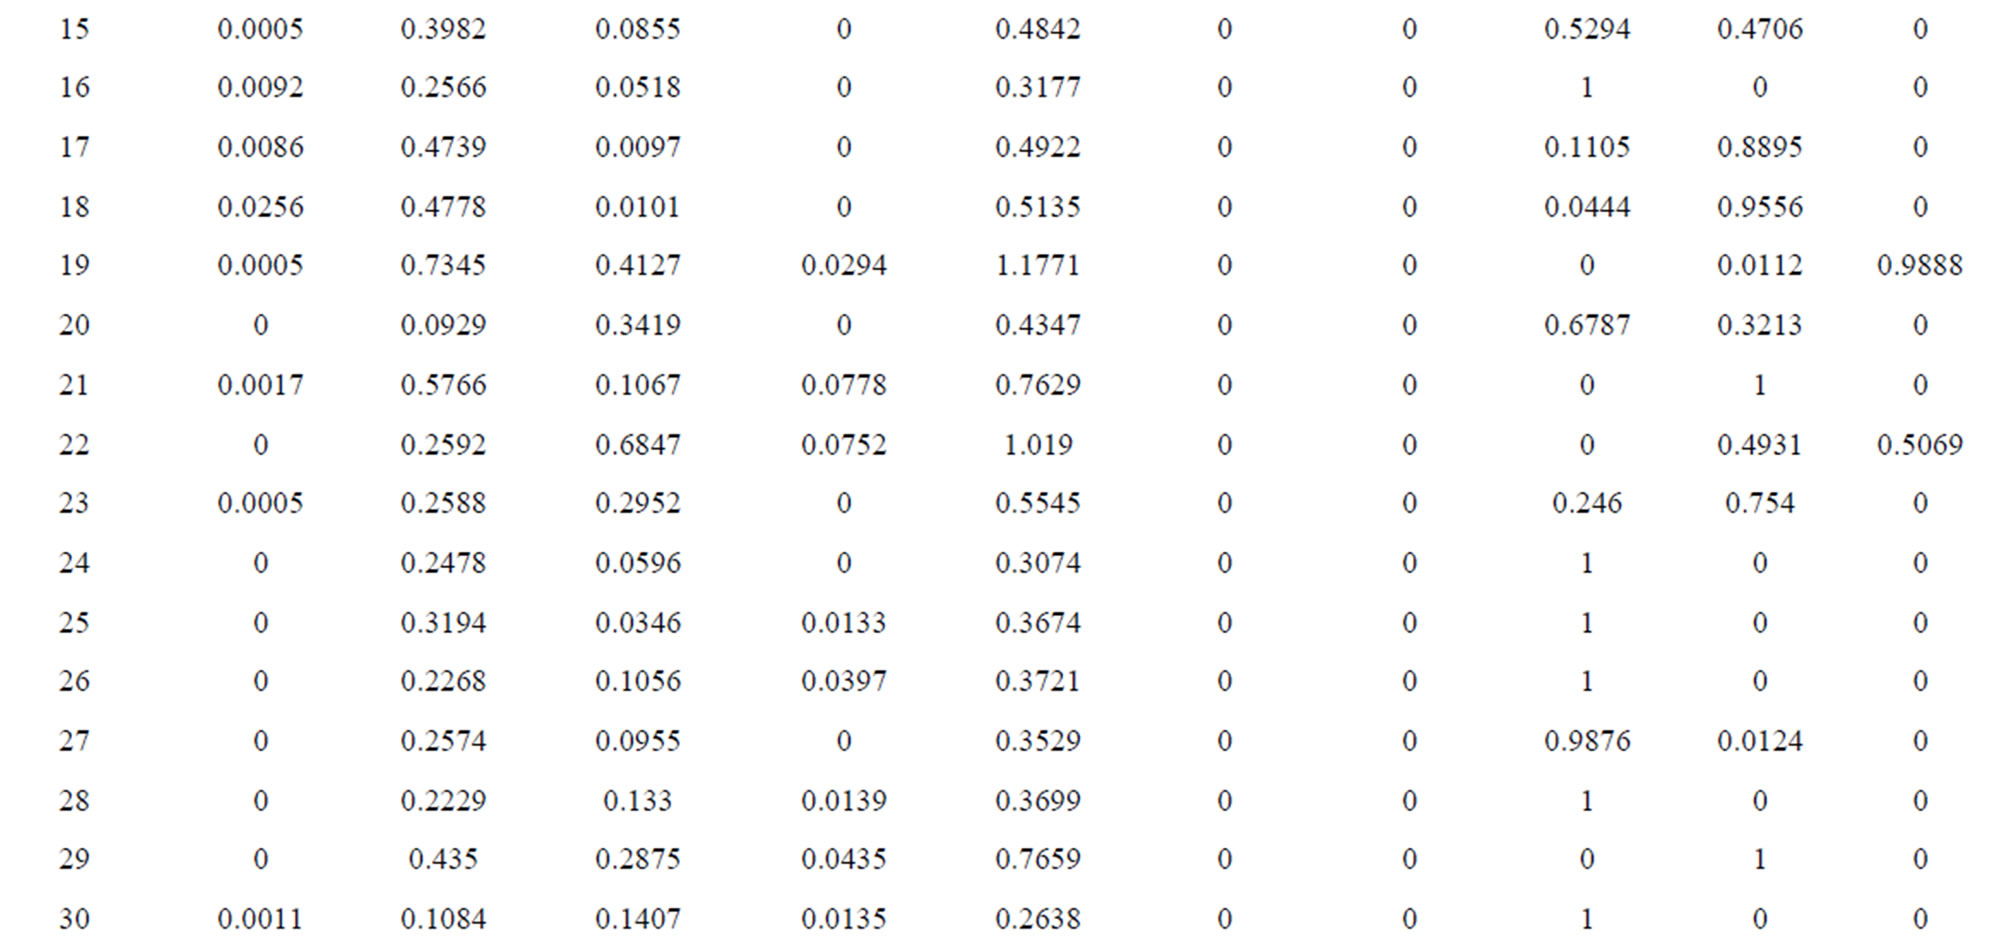
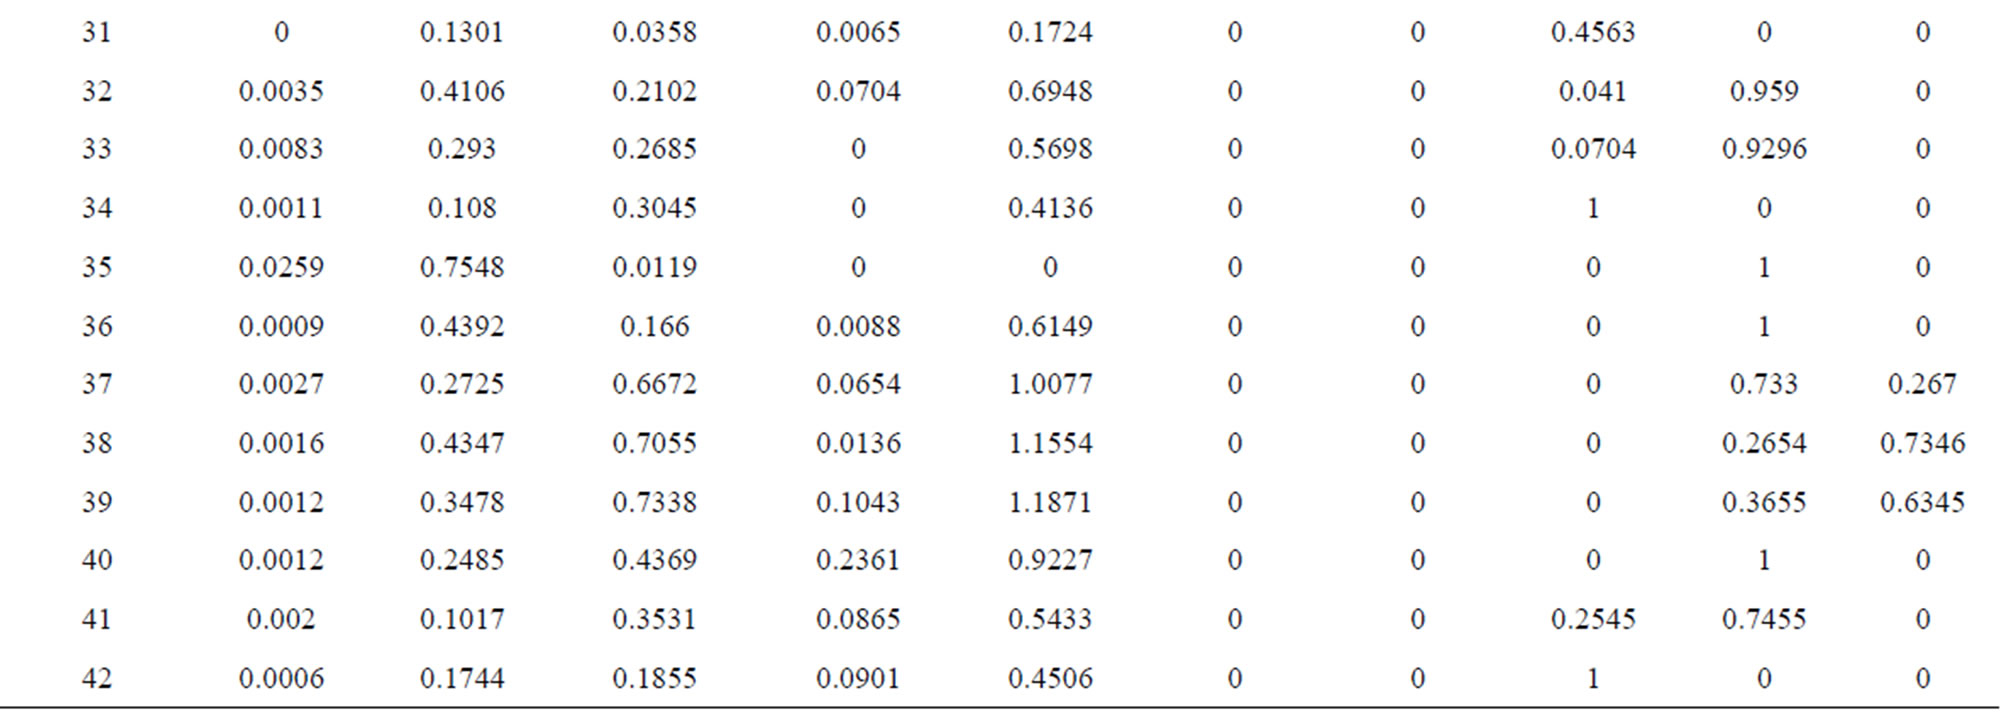
Table 5. Calculation results of NCR of the 42 water resources.
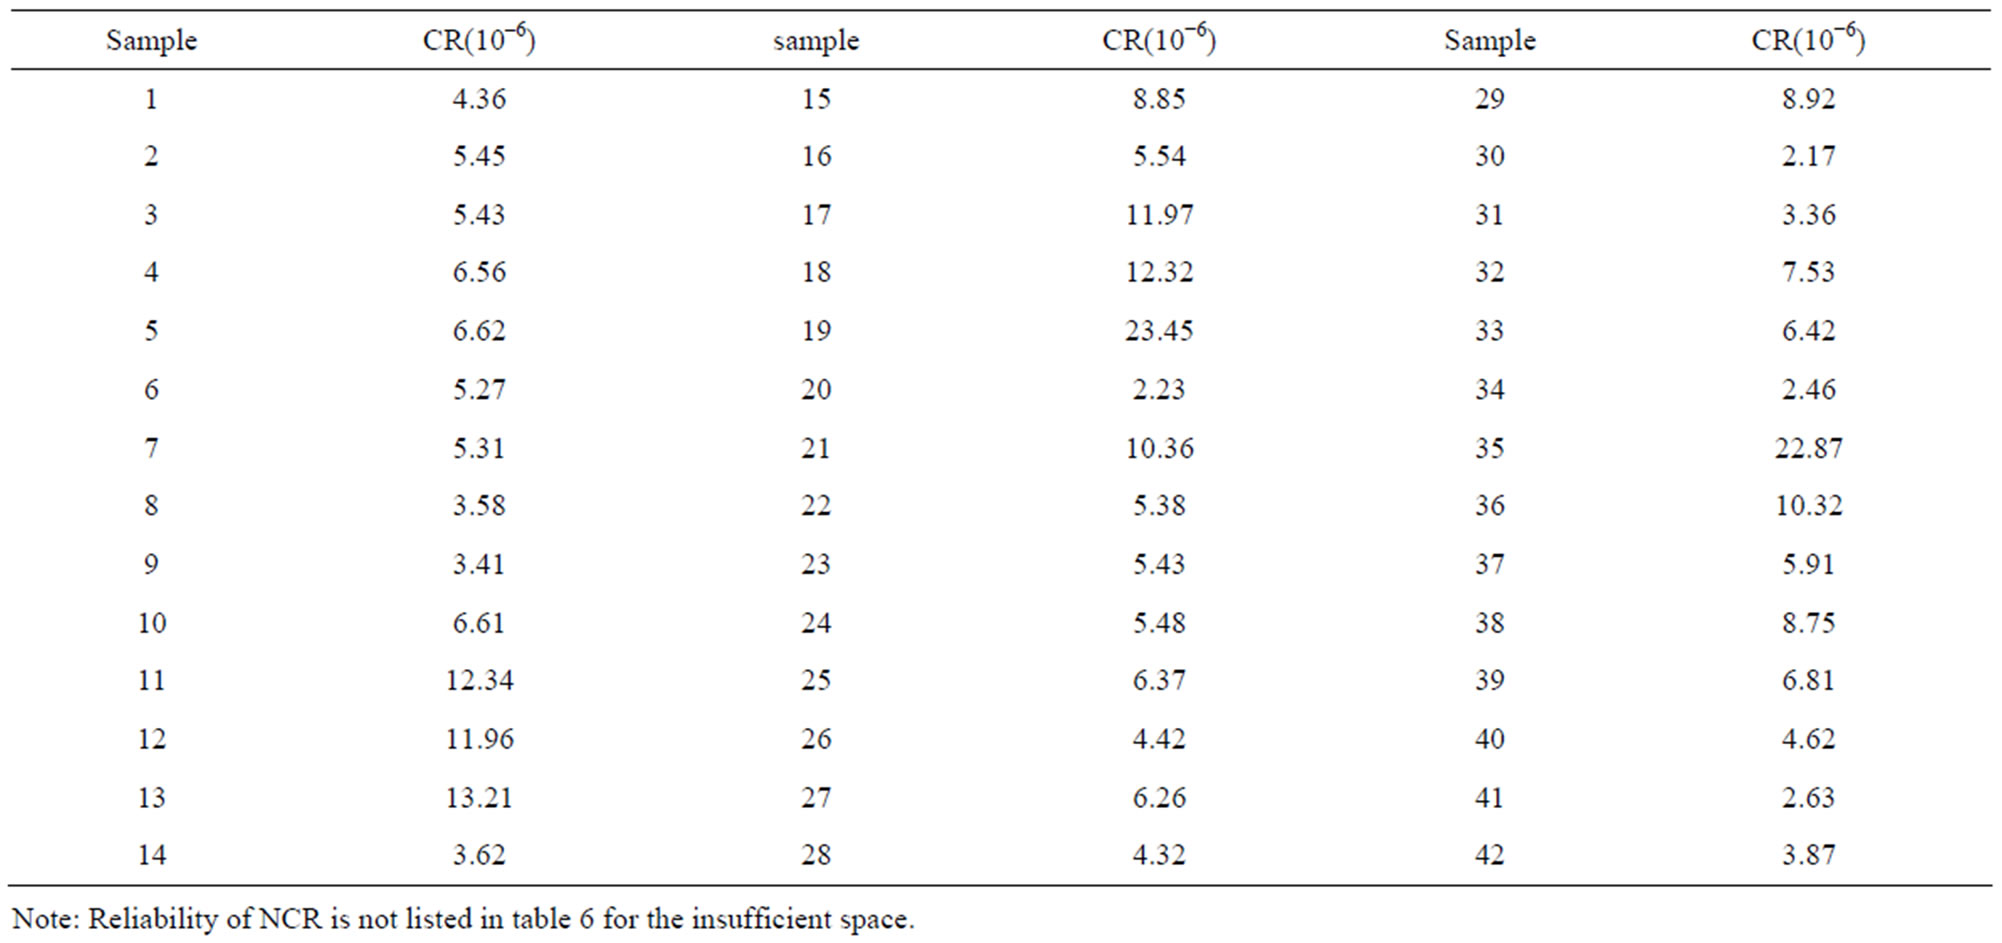
Table 6. Calculation results of CR of water resources.
fail to meet the standard.
3.2. CR Assessment
Risk management experience abroad indicates that it is acceptable the chemicals in drinking water run a CR of 1 × 10⁻⁶ to 1 × 10⁻⁴ [9,14]. Setting the strictest acceptable risk value 1 × 10⁻⁶ as the evaluation standard, and referring to Table 4, it can be seen that the total CR caused by pollutants in Mingshan County is 9.81 × 10⁻⁶, exceeding 9.81 times the standard and according to the MC-EPA model, the corresponding reliability of the total CR that exceed the standard 1 - 5 times, 5 - 10 times and 10 - 50 times are 12.21%, 58.9% and 28.89%. Referring to Table 6, the CR of all the 42 WR is above the standard, exceeding 1.17 to 22.45 times of the limit. Among the water resources, the CR of sample19 and 35 is 20 times over the standard. It is strongly suggested that relevant administrations implement an overall investigation on the causes for the Cr(VI) contamination of the drinking water quality in Mingshan County and carry out effective solution to solve the Cr(VI) pollution issue.
4. Conclusion
The NCR of the total water quality in Mingshan County is below “1”, which means the drinking water as a whole won’t have non-carcinogenic chronic toxic effect on the residents. However, the total NCR of sample No.11, 12, 19, 22, 37, 38 and 39 exceeds “1”. Protection measures of relevant administrations are in urgent need. The CR of the 42 WR all exceeds the standard 10−6 recommended by the US EPA, i.e. drinking water in Mingshan County is mainly contaminated by excessive Cr(VI), therefore it is highly recommended that relevant administrations lay emphasis on the investigation on causes for Cr(VI) contamination and implement measures to protect the WR and to ensure the drinking water safety. Many nondeterministic issues present in the evaluation system for HRWQ, such as the randomness and fuzziness of the information and the model. In this study, the information of those chemicals in water is transformed in to triangularfuzzy number and based on the data of chemicals to collect, plenty of simulation experiments are carried out to lower randomness of the HRA system. The MC-EPA model is developed by the application of the Monte Carlo method combined with the US EPA model. The evaluation system for the HAWQ of Mingshan County indicates the significance of the application of MC-EPA.
REFERENCES
- L. Y. Chai, Z. X. Wang, Y. Y. Wang, et al., “Ingestion Risks of Metals in Groundwater Based on TIN Model and Dose-Response Assessment: A Case Study in the Xiangjiang Watershed, Central-South China,” Science of the Total Environment, Vol. 408, 2010, pp. 3118-3124.
- E. Topuz, I. Talinli and E. Aydin, “Integration of Environmental and Human Health Risk Assessment for Industries Using Hazardous Materials: A Quantitative Multi Criteria Approach for Environmental Decision Makers,” Environment International, Vol. 37, 2011, pp. 393-403.
- J. Zhou, Y. You, Z. P. Bai, et al., “Health Risk Assessment of Personal Inhalation Exposure to Volatile Organic Compounds in Tianjin, China,” Science of the Total Environment, Vol. 409, No. 3, 2011, pp. 452-459. doi:10.1016/j.scitotenv.2010.10.022
- D. C. Dante, P. Paulina and M. Nestor, “Exposure to Inorganic Arsenic in Drinking Water and Total Arsenic Concentration in a Chilean Population,” Environmental Research, Vol. 98, No. 2, 2005, pp. 151-159. doi:10.1016/j.envres.2005.02.007
- K. L. Hu, Y. F. Huang, H. Li, et al., “Spatial Variability of Shallow Groundwater Level, Electrical Conductivity and Nitrate Concentration, and Risk Assessment of Nitrate Contamination in North China Plain,” Environmental International, Vol. 31, No. 6, 2005, pp. 896-903. doi:10.1016/j.envint.2005.05.028
- C. H. Fan, G. S. Wang, Y. C. Chen, et al., “Risk Assessment of Exposure to Volatile Organic Compounds in Groundwater in Taiwan,” Science of Total Environment, Vol. 407, No. 7, 2009, pp. 2165-2174. doi:10.1016/j.scitotenv.2008.12.015
- H. J. Jeong, W. T. Hwang, E. H. Kim, et al., “Radiological Risk Assessment for an Urban Area: Focusing on a Drinking Water Contamination,” Annual Nuclear Energy, Vol. 36, 2009, pp. 1313-1318.
- R. Z. Li, M. Shigeki, T. Q. Hong, et al., “Fuzzy Model for Two-Dimensional River Water Quality Simulation under Sudden Pollutants Discharged,” Journal of Hydrodynogy, Vol. 19, 2007, pp. 434-441.
- F. Q. Ni, G. D. Liu, S. C. Yang, et al., “Heath Risk Assessment Associated with the Rural Drinking Water Quality in the Western Edge of the Sichuan Basin,” Progress in Natural Science, Vol. 19, 2009, pp. 1281-1288 (in Chinese).
- F. Q. Ni, G. D. Liu, Y. S. Tan, et al., “Spatial Variation of Health Risk of Groundwater for Drinking Water Supply in Mingshan County, Ya’an City, China,” Water Science and Engineering, Vol. 3, No. 4, 2010, pp. 454-466.
- US EPA, “Risk Assessment Guidance for Superfund in Human Health Evaluation Manual (Part A),” EPA/541/ 1-89/002, December 1989, pp. 193-198.
- R. Zou and W. S. Lung, “Uncertainty Analysis for a Dynamic Phosphorus Model with Fuzzy Parameters,” Water Quality and Ecosystem Modeling, Vol. 1, No. 1-4, 2000, pp. 237-252. doi:10.1023/A:1013946902263
- E. G. Ronald and E. Y. Robert, “Analysis of the Error in the Standard Approximation Used for Multiplication of Triangular and Trapezoidal Fuzzy Number and the Development of a New Approximation,” Fuzzy Sets and Systems, Vol. 91, No. 1, 1997, pp. 1-13. doi:10.1016/S0165-0114(96)00118-2
- J. L. Jin, K. Y. Wu and R. Z. Li, “The Stochastic Simulation and Triangular Fuzzy Number Coupling Model of Water Environment Risk Evaluation,” Journal of Hydraulic Engineering, Vol. 39, 2008, pp. 1257-1261 (in Chinese).
- W. S. Wang, J. L. Jin and Y. Q. Li, “Stochastic Simulation Method for Hydrology and Water Resource,” Sichuan University Press, Chengdu, 2007 (in Chinese).
NOTES
*Corresponding author.