Journal of Water Resource and Protection
Vol. 3 No. 5 (2011) , Article ID: 4983 , 4 pages DOI:10.4236/jwarp.2011.35043
Hydro-Geochemical Characteristics of Groundwater beneath the Gaza Strip
1Ministry of Health, Public Health Laboratory, Gaza Shojaeya, Gaza Strip
2The Environmental Engineering Department, The Islamic University of Gaza, Al-Rimal, Gaza Strip
E-mail: mazar7@hotmail.com, halnajar@iugaza.edu.ps
Received February 24, 2011; revised March 28, 2011; accepted May 2, 2011
Keywords: Groundwater, Salinity, Piper Diagrams, Durov Diagram, Sea Intrusion
ABSTRACT
The main objective of the current research is to investigate the deterioration of groundwater quality due to the over-pumping in the coastal area of the Gaza Strip. One hundred and two (102) samples from 44 municipal water wells in the Gaza Strip were collected and analyzed for major cations like, Ca2+ and Mg2+ by Titration, Na+ and K+ by Flame photometer; anions like, Cl– and  by Titration,
  by spectrophotometer and
  by turbidity meter. The groundwater in the region mainly consists of NaCl,
  and
and . The saline load of groundwater is in first place controlled by chloride, sodium and calcium concentrations. The spatial changes of ionic ratios of rCa2+/(
 +
+ ) and the relationship between sodium and chloride in the coastal area indicate that the aquifer experienced seawater intrusion.
1. Introduction
The Gaza Strip is a narrow strip of land on the Mediterranean coast. It is approximately 41 kilometers long, and between 6 and 12 kilometers wide, with a total area of 378 square kilometers occupied by 1.4 million inhabitants [1,2]. The Gaza Strip has a temperate climate, with mild winter and dry hot summer subject to drought and an average rainfall of about 300 mm per year [3]. There are no permanent water bodies in the Gaza Strip, except for large-scale sewage ponds and sewage flowing through Wadi Gaza has become de facto hydraulic features [4].
Groundwater is one of the earth's most important recourses for human life. The water quality depends on the geological environment. Increased groundwater demand leads to a decline water level and deterioration of water quality [5,6]. The Gaza Strip entirely depends on groundwater for domestic, industrial and agricultural purposes, therefore, the groundwater is pumped from more than 4000 and 44 agricultural and domestic wells, respectively pumping around 155 million cubic meters (Mm3) a year [7]. While the current natural recharge is estimated to be 120 Mm3 candidate to decrease due to the expansion of urban areas and increase of surface run-off [8-10].
Groundwater is increasingly being subjected to over- -exploitation for agricultural, municipal and industrial uses increases the possibility of quality deterioration. The concentration of chemical elements in groundwater plays an important role in the classification and assessment of water quality. More than 90% of Gaza Strip residents use desalinated brackish water for their domestic use [11]. When the water resources are lacking, coastal aquifers become a very important source of water [12,13]. Additional problems such as the discharge of untreated or inadequately treated wastewater, improper chlorination process, agricultural runoff from farms and discharge of untreated sewage can all lead to the deterioration and contamination of groundwater in coastal aquifer and as a consequence health hazard [14,15]. Hydro-chemical study reveals the quality of water that would be suitable for irrigation, drinking and industrial purposes. Chemical classification also highlights the concentration of various predominant cations, anions and their interrelationships. The aim of the study is to determine the deterioration limits such as sea water intrusion if the over-exploitation continues in the future from the coastal aquifer.
2. Methodology
Groundwater samples (102 samples) were collected from 44 municipal wells during the year 2009-2010. The collected samples were analyzed for major cations such as, Ca and Mg by Titration, Na+ and K+ by Flame photometer; anions such as, Cl– and  by Titration, NO3– by spectrophotometer and
  by turbidity meter. The ionic balance was determined for the results of the major cations and anions calculated by Balance = C(meq/l) – A(meq/l) ∕ C(meq/l) + A(meq/l)*100.
Where C (meq/l) is the total cation mille-equivalents per liter. A (meq/l) is the total anions mille-equivalents per liter.
Each sampling site is characterized by a large number of chemical and physical variables, making the hydro geochemical study a multivariate problem. The multivariate statistical analysis is a quantitative and independent approach of groundwater classification allows to group of groundwater samples and the making of correlations between chemical parameters and groundwater samples. In this study correlation analyses and factor analyses were applied using Statistical Package of Social Studies (SPSS) version 14, used server software 9 to create contour lines of the concentrations of chemical elements in drinking water.
Piper Diagrams are one of the most useful ways of representing and comparing water quality. In the Piper Diagram cations, expressed as percentages of total cations in mill equivalents per liter, plots as a single point on the left triangle as shown in Figure 1.
The Durov Diagram is an alternative to the Piper Diagram; it plots the major ions as percentages of mill equivalents. The total both the cations and anions are set to 100% and the data points in the two triangles are projected onto a square grid which lies perpendicular to the third axis in each triangle.
Ionic strength is a characteristic of an electrolyte solution (a liquid with positive and negatively charged ions
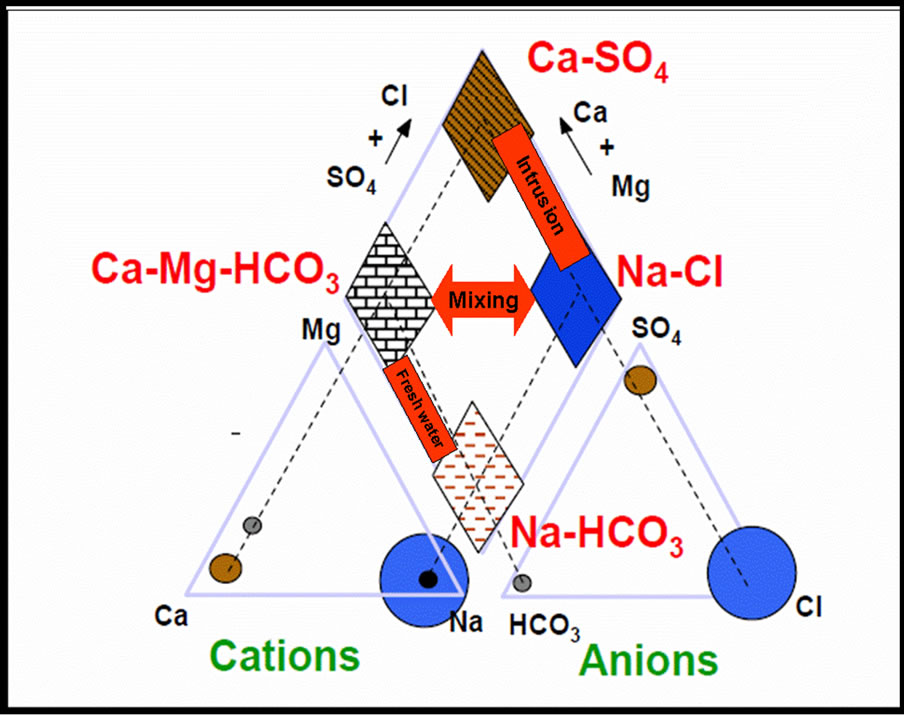
Figure 1. Piper diagram: Cations and anions are expressed as percentages of total in mill-equivalents per liter.
dissolved in it). It is typically expressed as the average electrostatic interactions among an electrolyte’s ions. Ionic strength is computed by using the formula Ι = 0, 5 ΣMi Zi , where Μi is the molar concentration of the i-th ion (mol/l) with charge Zi. Typical freshwater has ionic strength of less than 0.005.
The index of Revelle. is given by R = rCl-/(r – +
– + ), where r = meq/l. Freshwater has Revelle coefficient of less than 1 [16].
3. Results
The summary of the analytical results of groundwater in the study area is presented in Table 1, which shows the average maximum, minimum and standard deviation values for different geographical governorate. The data represented geographically, as the Gaza Strip is divided into five governorates (the north, Gaza, the middle area, Khanyouis and Rafah).
During the years 2009 - 2010, the water salinity of the domestic wells varied between 235 mg/L in the North and 6206 mg/L in Gaza governorate. The highest degree of salinity was shown in the northern Gaza and Khan Younis. The mean nitrate concentration is high at 199 mg/L and is attributed due to intensified agriculture activities and excess use of fertilizer. About 86% of the examined samples exceed the maximum permissible concentration of 50 mg/l set by the World Health Organization (WHO). Concentrations of sodium (Na+) and chloride (Cl–) vary respectively between 16 mg/L in north governorate and 1400 mg/l in Gaza governorate and from 43 to 3119 mg/l during the study period. The highest concentration levels characterize the wells situated in north, Gaza and Khan Younis. Most of the tested wells exceed the WHO limitation of 250 mg/l for chloride concentration. Concentration of sulfate varies between 0.9 mg/L at the north and 600 mg/L in Rafah governorates. The concentration of  in domestic wells varies from 131 to 601 mg/L, with a maximum records for Gaza governorate.
Calcium (Ca2+) concentrations ranged between 22 mg/Lin Khan Younis and 518 mg/l in north Gaza (Table 1). It is noted from the distribution of calcium in the governorates that the calcium concentration increases in the north of Gaza and the middle governorate. Magnesium (Mg2+) concentrations fluctuate between 12 mg/L in Rafah governorate and 287 mg/L in Gaza governorate and are always associated with magnesium and calcium to form the water hardness. Potassium (K) concentrations are relatively low compared to the concentrations of other cations, with values varying between 0.78 mg/L in North governorate and 30 mg/L in Gaza governorate.
3.1. Revelle Index
Groundwater from the coastal aquifer has values of

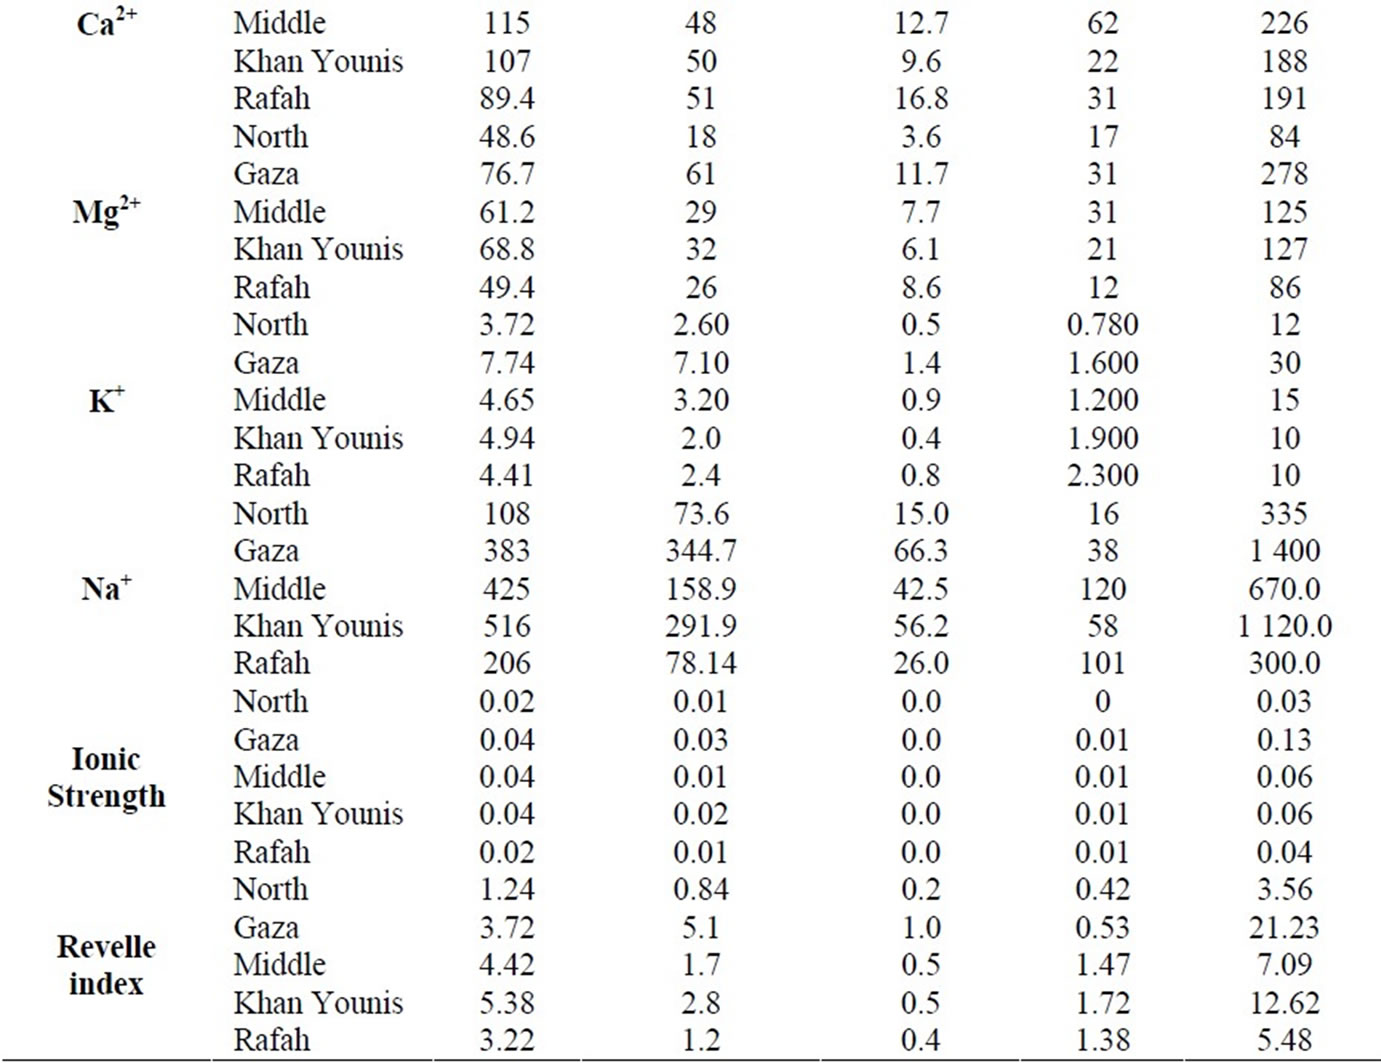
Table 1. Chemical parameters (mg/l) of the coasta aquifer in the five governorates.
HCO3/Cl ratio close to the seawater ratio indicating possible mixing with seawater, where groundwater becomes enriched with Cl that leads to decrease the value of this ratio where values ranged between 0.42 in the north and 21.3 in Gaza, The average concentration in the middle governorate is 4.4 and 5.3 in Khan Younis. Geochemical graphic analyses methods, principally Piper diagrams, have been widely used in groundwater studies to characterize large number of water chemical data. Major ions data was plotted on the Piper diagram as shown in Figure 2. The Piper classification of drinking water in the Gaza strip shows that 97% of the samples have sodium and chloride as the most dominant in all studied samples from the Gaza Strip municipal wells, see Table 2. By using Spatial analysis (ANOVA) for chemical parameters of the coastal aquifer in the Gaza strip, there are differences between the spatial regions, and these differences are statistically significant when p = 0.05, as shown in Table 3.
3.2. Correlation Matrix
The correlation matrix allows us to distinguish several relevant hydrochemical relationships. The contents of chloride, sodium, magnesium and sulphate are positively correlated to salinity with correlation coefficients of 0.982, 0.917, 0.683 and 0.904, respectively. These values indicate the interdependence of the total dissolved salt and major ion in drinking wells in Gaza strip as show in Table 4.
Indeed, a strong positive correlation was found between Na+ and Cl–, Ca2+ and Mg2+ and it can also be deduced that for most of the groundwater samples these parameters originate from a common source. Magnesium and chloride are not highly interrelated among themselves (r = 0.640). This interrelationship indicates that the hardness of the water is temporary in nature.
4. Discussion
Seawater intrusion is influenced by numerous features of the aquifer, which may include the lithology, groundwater flow paths and anthropogenic activity (pumping). In addition, saline intrusion on fresh groundwater systems, produces a distinct geochemical signature. The mixing of different water types can induce reactions which lead to a water composition that is different from a conservative mixture [17]. Sodium and chloride are the dominant ions in seawater, however, ion exchange occurs when this
Figure 2. Piper diagram presenting the water chemistry of domestic wells in the strip.
saline water comes into contact with a fresh groundwater system where the clays are dominated by Calcium. When seawater intrudes into a coastal fresh groundwater aquifer, the following exchange reaction takes place
Na+ + 1/2 Ca2+ – X2↔Na+ – X + 1/2Ca2+
where X indicates the soil/sediment exchanger [17].
4.1. Seawater-Freshwater Interaction
It was found that the correlations between Cl and/with the major components of seawater (Na and ) were strong (Cl-Na, r = 0.931; Cl-SO4, r = 0.894); indication of seawater influence on the groundwater salinity and the complexity of the hydro-chemical components of groundwater.
The fact that the salinization of the groundwater in the Gaza strip was due to seawater intrusion based on the presence of Cl– and the strong correlations between those parameters. The effect of salinization of the groundwater was classified using the Cl/ ratios, which includes groundwater having < 0.5 Cl/
 ratios for unaffected, 0.5 - 6.6 for slightly and moderately affected and groundwater having Cl/HCO3 ratios > 6.6 for strongly affected. as show in Figure 3 [16].
The majority of the samples has Revelle coefficient values greater than one and ionic strength values greater than 0.005, indicating seawater intrusion.
The Mg2+/Ca2+ ratio (in meq/L) increases with the proportion of seawater in the mixture, since the ratio of seawater is close to 5, whilst in freshwater it tends to be less than 1 (Figure 4) indicating also seawater intrusion. Values of Ca2+/Mg2+ and Ca2+/Na+ are much more than those of seawater, which may be due to enrichment of Ca by dissolution of carbonate minerals in the aquifer matrix and/or depletion of Na caused by cation exchange during mixing with saltwater Figure 5.
Researchers who consider groundwater modeling to study the status of the ground water beneath the Gaza strip could reach to the conclusion of sea water intrusion [12,18,19]. In the current research new chemical parameter also lead to the same conclusion.
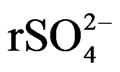
4.2. Water Type
The water is of various hydrochemical types as illustrated by the Durov diagram in Figure 6: some sample of drinking water located in box 1, SO4 dominates, or anion discriminate and Ca dominant, Ca and SO4 dominant, frequently indicates a recharge water in gypsiferous deposits, otherwise a mixed water or water exhibiting simple dissolution may be indicated. In box 2, No dominant anion or cation, indicates water exhibiting simple dissolution or mixing. Box 3, Cl dominant anion and Na

Table 2. Geographical distribution and percentage of the identified hydro-chemicals of drinking wells in the Gaza strip.
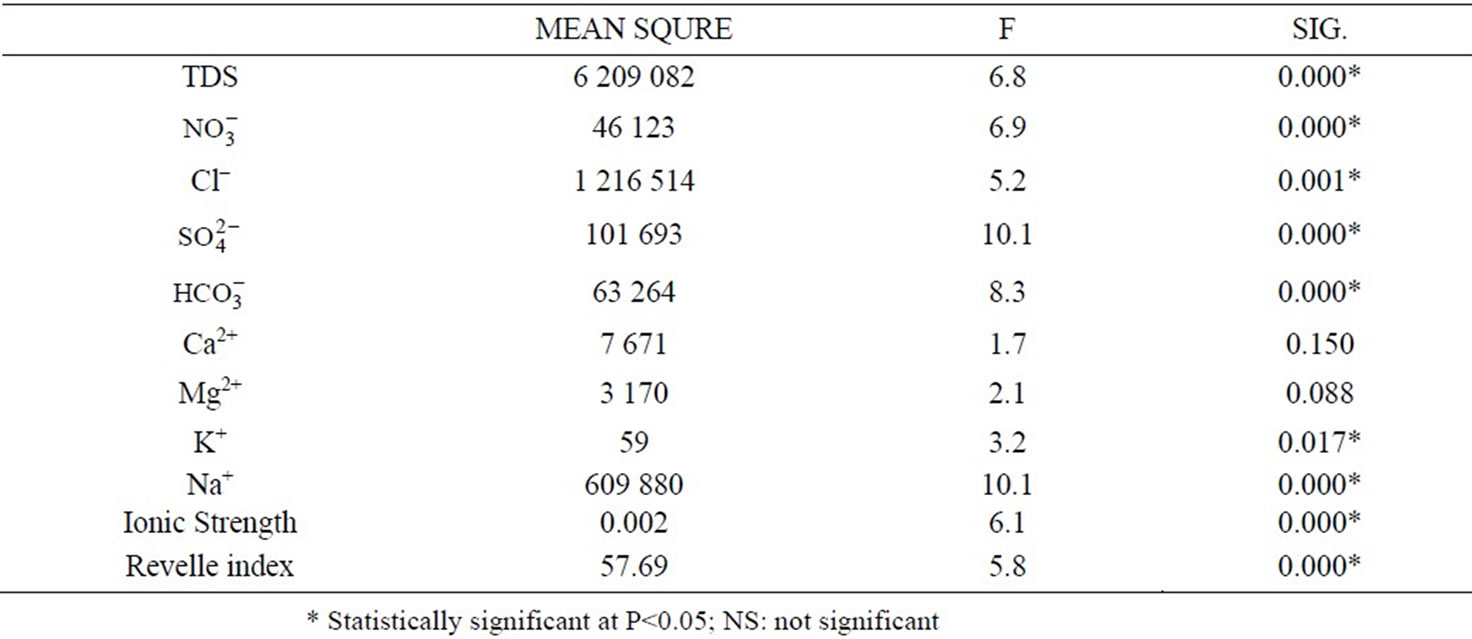
Table 3. Spatial analysis (ANOVA ) for chemical parameters of the coastal aquifer in the Gaza strip.
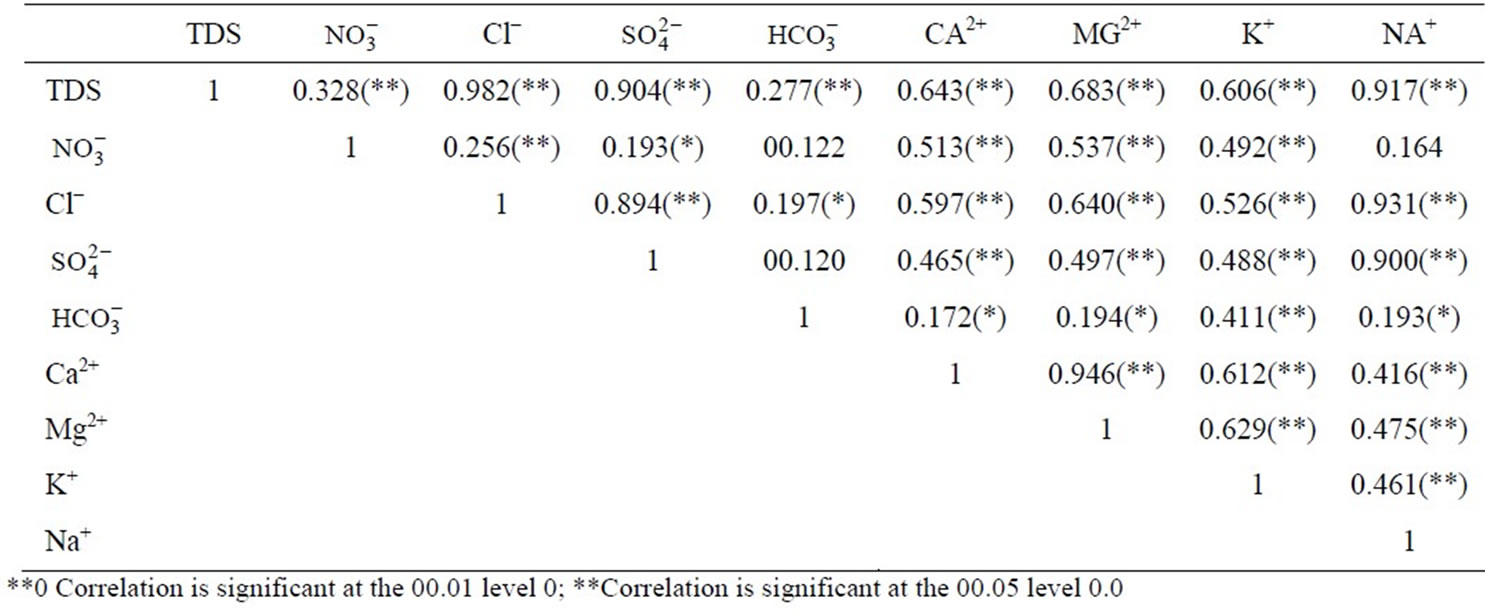
Table 4. Correlation matrix for chemical parameters.
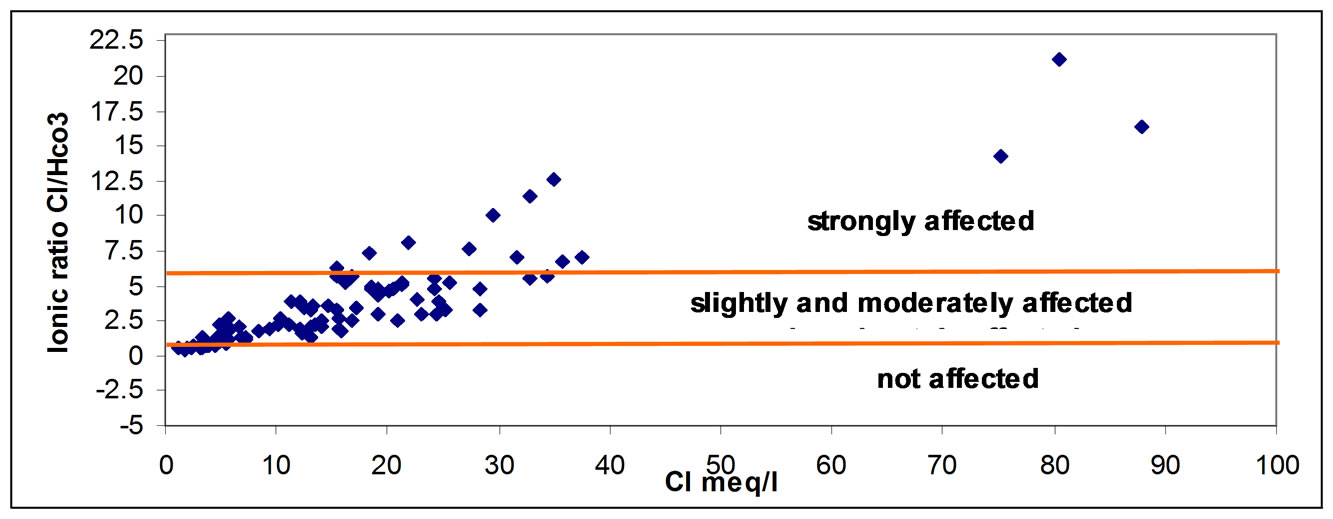
Figure 3. Ionic ratio of Cl/HCO3 versus Cl concentration.

Figure 4. Ionic ratio of Ca/Mg versus Ca concentration.

Figure 5. Ionic ratio of Ca/Na versus Ca concentration.
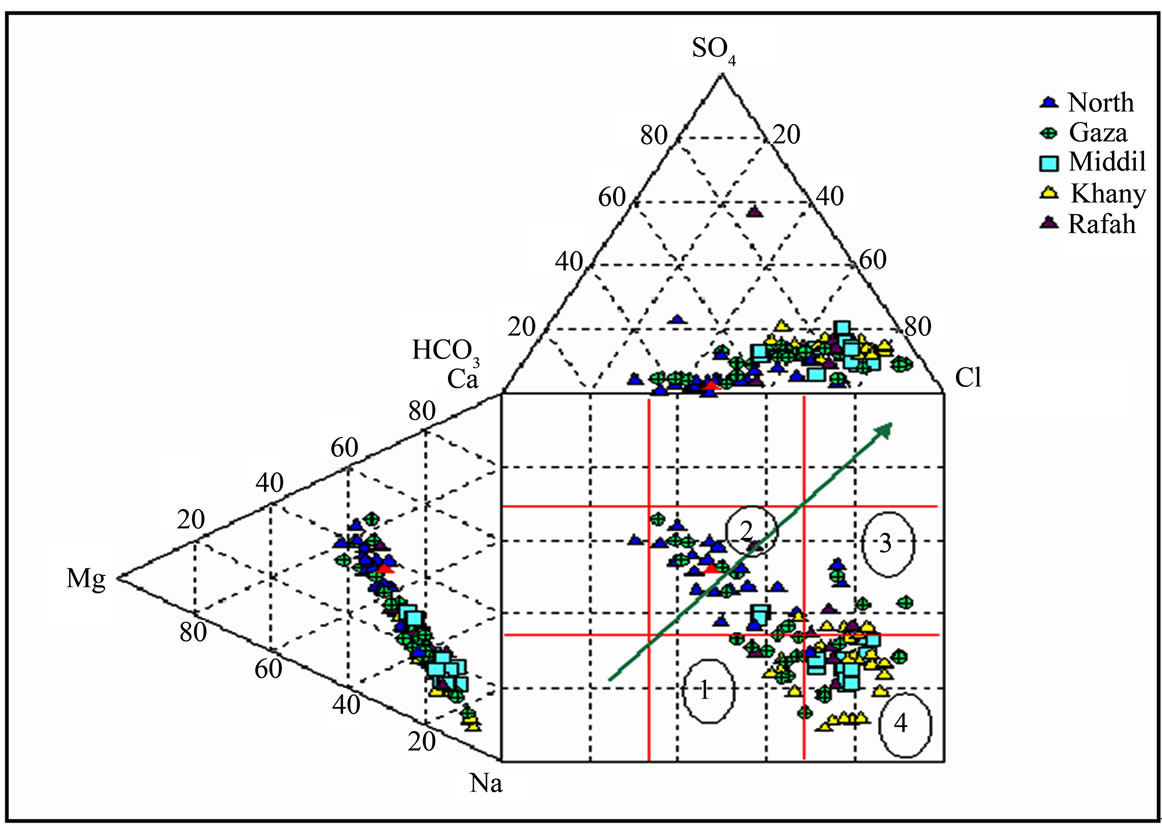
Figure 6. Durov diagram, meq % (Gaza strip).
dominant cation, indicate that the ground water be related to reverse ion exchange of Na-Cl waters. Box 4, Cl and Na dominant frequently indicate end-point waters. Qannam [20]. Ca-Mg-HCO3 (freshwater of recent infiltration), Na-HCO3 (this type indicates ion-exchange phenomena and characterizes a transition zone).
This quality of water is found in domestic wells in the northern Gaza, where the soil is sandy and the area is ideal for recharging aquifer and rainfall in this region are estimated at 400 mm per year and Na-Cl (typical brackish water in which the ions Na+ and Cl– predominate). The quality of water in the Middle governorate, Khan Younis and Rafah is salty and this is due to the direction of water in the aquifer from the east to the west and overlap sea water into coastal aquifer [21]. This reason behind the salinization of water due to the over pumping of groundwater in coastal aquifers reduces the groundwater level and induces seawater intrusion. Sheikh Radwan group of wells in the area of Gaza city is most vulnerable to seawater intrusion and that the large number of pumping rates, where the rate of pumping from Sheikh Radwan wells is account for 18 million cubic meters per year [22]. Figure 7 describes the hydrochemical facies of drinking water in Gaza Strip.
4.3. Correlation Matrix
The correlation between Na+ and Cl– however shows around 0.931 which is interpreted as a result of seawater intrusion. The Na-Cl correlation shows the influences of seawater and groundwater mixing. Ca2+ often occur when seawater intrudes fresh groundwater. The characteristic cation-exchange process that takes place when seawater intrudes a coastal fresh water aquifer.
There is a positive correlation of Ca2+ with Mg2+ in the groundwater of the area. These elements, Ca2+ and Mg2+, correlate positively with TDS, EC, K+ and .The positive correlation between Ca2+ and Mg2+ (0.946) is attributed to the precipitation of aragonite, dolomite and calcite [17]. Precipitation takes place during the cation exchange process which is the later effect from the seawater intrusion into the aquifer. The lower concentration of Ca2+ compared to Na+, is a result from the cation exchange process that occurs naturally when seawater intrudes into the aquifer system.
The positive and significance correlation of K+ with both Cl and  which is generally very high in the sea may be interpreted on the light of seawater intrusion as well.
5. Conclusions
Chloride, sodium and calcium concentrations are the main contributors to the salinity of the groundwater beneath the study area. Seawater intrusion is indicated through the analysis of the spatial changes of ionic ratios of rCa2+/( + r
+ r ) and the relationship between sodium and chloride in the coastal area of the Gaza Strip in the year 2009-2010. Additionally, understanding
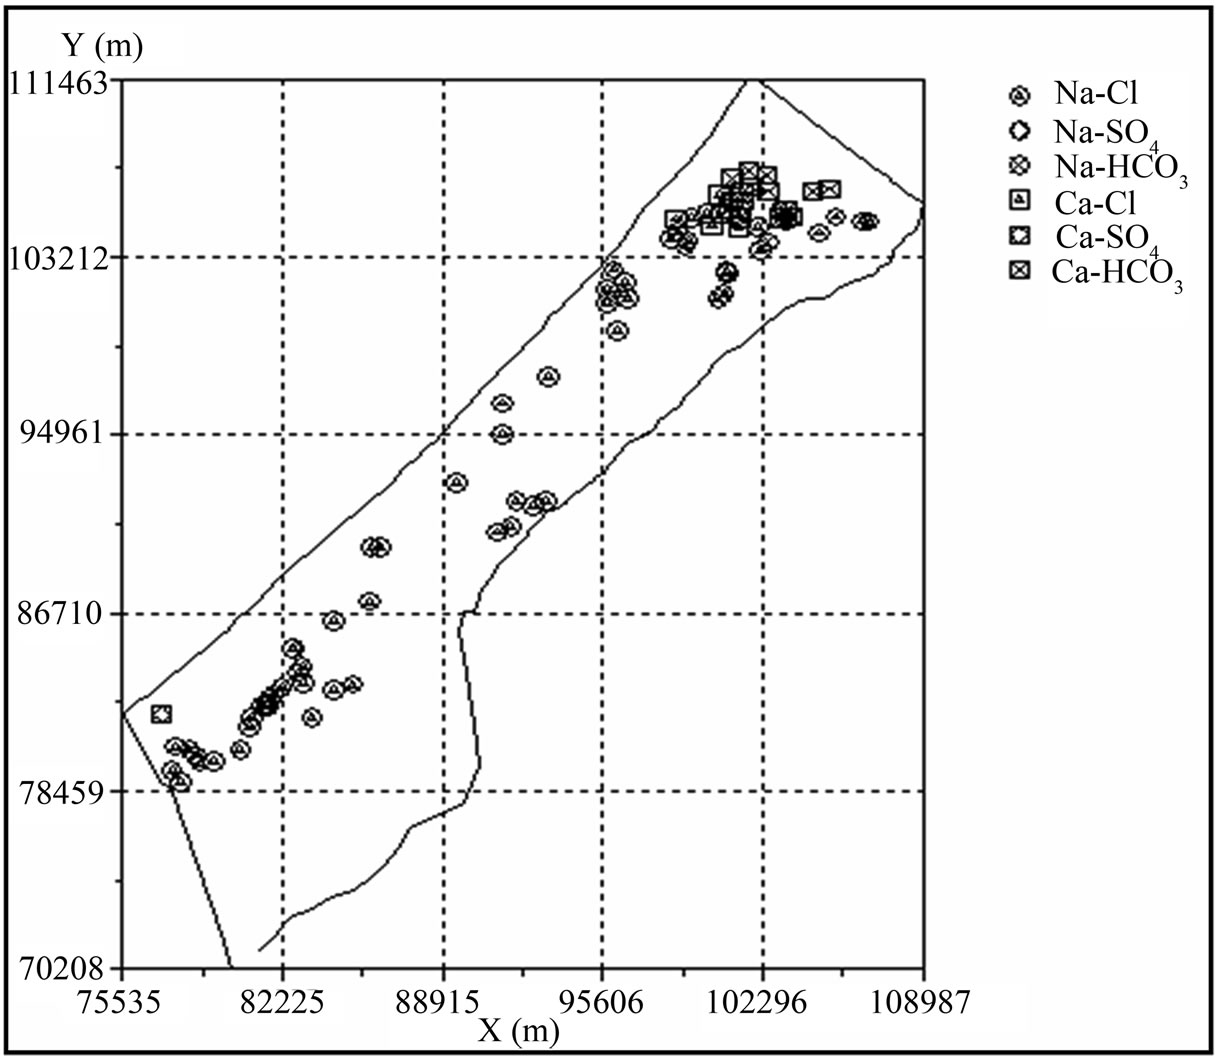
Figure 7. Hydro-chemical facies of drinking water in the Gaza Strip.
correlation matrix between the chemical elements of drinking water and compared with sea water, it is found that there is a strong correlation between chloride, calcium, magnesium, sodium, and this was due to seawater intrusion. However, a deeper understanding of the hydrogeology and hydro-geochemistry is required to properly assess the origin, nature and mobility of solutes within this aquifer system.
REFERENCES
- Palestinian Central Bureau of Statistics, “Summary Statistics (1997-2015),” Gaza Strip, 2006.
- Ministry of Planning, Palestinian National Authority, “Regional Plan of Gaza Governorates 2005 - 2015,” 2006.
- Ministry of Agriculture, “Input-Output Gross Margin and Profit Per Dunum in the Gaza Strip,” 2003.
- United Nations Environment Programme, “Environmental Assessment of the Gaza Strip, Following the Escalation of Hospitalities in December 2008 – January 2009,” Renouf Publishing Co. Ltd., Ottawa, 2009.
- B. Shomar, “Groundwater Contaminations and Health Perspectives in the Developing World Case Study: Gaza Strip,” Environmental Geochemistry and Health, Vol. 33, No. 2, 2010, pp. 189-202. doi:10.1007/s10653-010-9332-8
- Palestinian Water Authority, “Summary of Palestininan Hydrologic Data 2000-Volume 2: Gaza,” Report, Palestine, 2000.
- H. Al-Najar, “Urban Agriculture and Eco-Sanitation: The Strategic Potential toward Poverty Alleviation in the Gaza Strip,” Royal Institution of Chartered Surveyors Research, Vol. 7, No. 7, 2007, pp. 9-22.
- S. M. Hamdan, U. Troeger and A. Nassar, “Stormwater Availability in the Gaza Strip, Palestine,” International Journal of Environment and Health, Vol. 1, No. 4, 2007, pp. 580-594. doi:10.1504/IJENVH.2007.018582
- A. R. Khalaf, H. M. Al-Najar and J. T. Hamad, “Assessment of Rainwater Run off Due to the Proposed Regional Plan in the Gaza Governorates,” Journal of Applied Sciences, Vol. 6, No. 13, 2006, pp. 2693-2704. doi:10.3923/jas.2006.2693.2704
- H. Al-Najar and A. J. Adeloye, “The Effect of Urban Expansion on Groundwater as a Reneable Resource in the Gaza Strip,” Royal Institution of Chartered Surveyors Research, Vol. 5, No. 8, 2005, pp. 7-21
- A. Hilles and H. Al-Najar, “Brackish Water Desalination is the Merely Potable Water Potential in the Gaza Strip: Prospective and Limitations,” Journal of Environmental Science and Technology, Vol. 4 No. 2, 2011, pp. 158- 171. doi:10.3923/jest.2011.158.171
- Q. Khalid, et al., “Optima Extraction of Groundwater in the Gaza Coastal Aquifer,” Journal of Water Resource and Protection, Vol. 1, No. 4, 2009, pp. 249-259.
- A. Shaheeda, “The Hydrochemical Characteristics of Groundwater in the Incomati Estuary,” Master’s Thesis, University of the Western Cape, Cape Town, 2007.
- A.-S. Mohammed and H. Al-Najar, “Disinfiction Process of Water Supply System in the Gaza Strip Between Real Practice and WHO Limitations,” Research Journal of Environmental Sciences, Vol. 5, No. 5, 2011, pp. 414-423. doi:10.3923/rjes.2011.414.423
- A. Nassar, K. Tubail and S. Afifi, “Attitutes of Farmers toward Sludge Use in Gaza Strip,” International Journal of Environmental Technology and Management, Vol. 10, No. 1, 2009, pp. 89-101. doi:10.1504/IJETM.2009.021580
- R. Revelle, “Criteria for Recognition of Sea Water in Ground Water,” Transactions of American Geophysical Union, Vol. 22, 1941, pp. 593-597.
- C. A. J. Appelo and D. Postma, “Geochemistry, Groundwater and Pollution,” A.A. Balkema Publishers, Rotterdam, 1996.
- K. A. Qahman and Y. Zhou, “Monitoring of Seawater Intrusion in the Gaza Strip, Palestine,” 1st International Conference of Saltwater Intrusion and Coastal Aquifers Monitoring, Modeling and Management, Essaouira, 23- 25 April 2001, pp. 1-23.
- Metcalf and Eddy, “The Gaza Coastal Aquifer Management Plan – Task 3 Appendix A,” USAID, Contract No. 294-C-99-00038-00, 2000.
- Q. Ziad. “A Hydro Geological, Hydrochemical and Environmental Study in Wadi Al Arroub Drainage Basin, South West Bank, Palestine,” Freiberg On-line Geosciences, Vol. 9, 2003, pp. 1-211.
- A. Vengosh, W. Kloppmann, A. Marei, Y. Livshitz, A. Gutierrez, M. Banna, C. Guerrot, I. Pankratov and H. Rana, “Sources of Salinity and Boron in Gaza Strip: Natural Contaminant Flow in the Southern Mediterranean Coastal Aquifer,” Water Resources Research, Vol. 41, 2005, pp. 1-20. doi:10.1029/2004WR003344
- Palestinian Water Authority, “Agricultural and Municipal Water Demand in Gaza Governorates for Year 2005,” Report, 2005.