iBusiness
Vol.3 No.4(2011), Article ID:9154,11 pages DOI:10.4236/ib.2011.34050
Data Mining and Exploratory Data Analysis for the Evaluation of Job Satisfaction
![]()
1Department of Business Strategy and Quantitative Methods, Second University of Naples, Capua, Italy; 2Department of Business Strategy and Quantitative Methods, Economics Faculty, Second University of Naples, Capua, Italy.
Email: {rosaria.lombardo, ermelinda.dellavalle}@unina2.it
Received August 20th, 2011; revised September 29th, 2011; accepted October 17th, 2011.
Keywords: Customer Relationship Management, Relationship Value Management, Job Satisfaction, Social Enterprise, Data Mining, Ordered Multiple Correspondence Analysis
ABSTRACT
In this paper we face off the relationship value management which is a theme in the relationship marketing literature gaining increasing attention in the last decade. The main aim of this study is to evaluate job quality and in particular employees’ satisfaction of non-profit enterprises by using, among different exploratory data analysis tools, ordered multiple correspondence analysis which is a part of corporate data mining. We focus attention on Ordered Multiple Correspondence Analysis (OMCA), recently proposed in statistical literature, to monitor (dis) satisfaction in different times or spaces. In particular we present a new strategy based on OMCA which allows to deal with ordered variables (Likert items) taking into account other qualitative information of job (kind of job contract, type of incentives, etc.) affecting the overall satisfaction of employees.
1. Introduction
In the broader context of knowledge discovery in databases, data mining is the analysis of large observational data sets to explore relationships that are useful to data owner. Data mining typically deals with data that have already been collected for some purpose.
In the relationship marketing context of for-profit and non-profit enterprises [1,2], the theoretical model of relationship value management (RVM) has gained great emphasis in the last decade. The value produced by an organization (conveyed as economic or social capital) and its maximization depends on the ability of the organization itself to manage efficiently and effectively the relationships between the various stakeholders (beneficiaries, community, workers and purchasers). In this context, the measure of that value is directly connected to the quality of social utility services. As consequence, stressing the relational aspect of job quality (JQ), we give a major relevance to the roles of workers in relation to the beneficiaries of the social services.
In this paper we focus attention on the job quality [3,4] in social cooperatives [5-7], which are the most common kind of non-profit social enterprises in Italy.
Since the beginning of their development, social cooperatives have been perceived as totally different from ordinary enterprises or traditional cooperatives [8-10]. The distinctive, largely recognized, characteristics of the social cooperatives are the high social utility [11,12], the active involvement of different stakeholders into the governance [13], the relationships of customers with all the other stakeholders [14-16]. This paper points out the examination of specific relationships between cooperatives and workers and in particular we stress the existence of a psychological contract [17-19] of workers with cooperatives which causes high levels of job satisfaction (JS) despite low salaries. Indeed, only when the relationship between employee-owner is not merely based on economic reasons, the relational approach and the organizational context become functional and essential to improve enterprises value, while the work duties and the economic aspect become less important [20]. In particular, we describe and interpret the quality of the work as a combination of objective and subjective features that allow to highlight the multidimensional characteristics of the job quality.
In order to analyse the job quality, we propose to consider, among different exploratory data mining tools, Multiple Correspondence Analysis (MCA) [21] and in particular Ordered MCA [22,23] (OMCA), recently proposed in literature. OMCA allows to analyse qualitative or subjective information of large survey data where a question/variable is regarded as a set of ordered category points (Likert items), adding information about the structure and association of the variables characterizing the JS and about the individual satisfactions. It can be seen as an useful tool to monitor the job satisfaction over time or in cross section, to support decision making in customer-centric planning tasks [24]. Further OMCA will be probed as a training tool for early warning system (EWS) which produces signal for possible enterprise risks coming from the lost of enterprise value.
Before introducing some technical aspects of OMCA analysis, in Sections 2 we briefly discuss the theoretical background of social enterprises marking the analysis of job satisfaction to achieve job quality and improve enterprise value. In Section 3, we introduce OMCA for nominal and ordered variables. Finally in the last section, we illustrate the applicability of OMCA to evaluate job satisfaction on a real data-set [25].
2. Theoretical Background
In many countries and notably in European countries such as Italy and Spain, social activism has played an important role in creating entrepreneurial ventures with social aims [26]. During the last decade, non-profit entrepreneurial organizations and social entrepreneurship have been hot topic issues in many countries [27,28], from the USA to the old and new EU countries [29,30]. In social enterprises motivations, incentives and satisfaction of workers play a fundamental role. The focus is on the so-called internal customer, that is the worker, because the quality of work plays a strategic role in the quality of the social enterprise as well in the enterprise value. In the framework of Relationship Value Management [31] with respect to the nonprofit social sector [32] (see Figure 1), we state that the quality of the social enterprise depends on the quality of goods and services offered to the different parties involved in the enterprise activity, not only to the end-users, but also to the workers, to sponsors and communities where the enterprise acts.
As the value produced by an organization (conveyed as economic or social capital) is closely connected with the management of the relations between the various parties (employers, beneficiaries, community, employees and purchasers), it becomes of prime interest to monitor the job quality by ordered multiple correspondence analysis, which allows to capture early warning signals of losing value. We enhance OMCA as a data analysis tool suitable to support decision making in customercentric planning tasks.
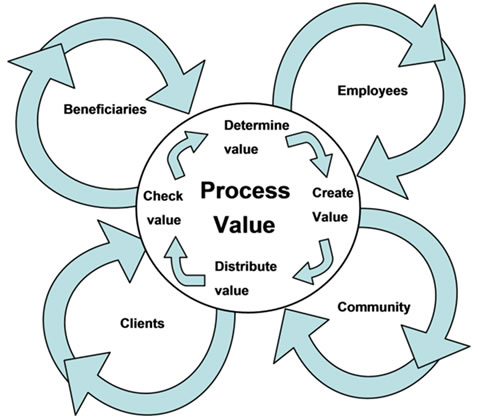
Figure 1. Social relationship value management model.
In literature, the JS has been related to extra work effort and enterprise performance [33-35]. The typical measure of JS implies the computing of a single global index (overall JS) usually constructed after using a multi-item questionnaire [36]. The questionnaire considers subjecttive facets of the JQ (e.g. the relations with coworkers, superiors and clients, the involvement into the organization, the acknowledgement of the work, the transparency of organization procedures) and objective aspects of the JQ (wages, hours schedule, job stability and autonomy). As a matter of fact, working activity is characterized by work exchanges, human relationships and personal motivations (such as interest and involvement in work, wishes to realize professional and human objectives contributing to the collective well-being).
Further, the job satisfaction is related to many other conceptual variables such as distributive and procedural fairness, level of autonomy and degree of job complexity, which contribute to the existence of a psychological contract between employees and their organization.
By OMCA, we propose to evaluate JS via worker clustering, indeed we automatically compute the percentages of employees that declare their own level of satisfaction. In the following section, OMCA will be briefly introduced.
3. Ordered Multiple Correspondence Analysis for the Evaluation of Job Satisfation
In general in service quality evaluations, in particular in customer and job satisfaction studies, we observe categorical variables whose categories are ordered. To analyse variables with ordered categories, we describe a confirmatory approach to multiple correspondence analysis (MCA), i.e. ordered multiple correspondence analysis [22,23].
OMCA maintains all the features of exploratory MCA, and allows for additional information about the structure and association of the ordered categories. As graphical results, we obtain the same categorical variable graphical display of MCA, but we add information on the relationships between the variable categories. Furthermore, we get more informative individual graphical representations than MCA plots, as the individuals are automatically clustered in so many groups as the number of the ordered categories of the responses to questionnaires.
Technically ordered MCA is based on the singular value decomposition (SVD) and on the bivariate moment decomposition (BMD). Specifically, it performs a hybrid decomposition of the indicator super-matrix, which implies computing the orthogonal polynomials and the singular vectors, by means of the bivariate moment decomposition [37] and the singular value decomposition, respectively. The computation of orthogonal polynomials for the ordered categorical variables is a key point of the analysis, we refer to a general recurrence formula to generate them, that you can find in Beh [37] and in Lombardo and Meulman [22]. As highlighted by Emerson, the decomposition by orthogonal polynomials was originally introduced in experimental design, where the set of polynomials is orthogonal over a set of points with arbitrary spacing (scale points) and weighting (marginal frequencies). After computing the orthogonal polynomials for each variable, we construct the super-matrix of the orthogonal polynomials  of dimension
  whose block-diagonal elements are the orthogonal polynomial matrices
 , (related to the p number of ordered variables) while the off-diagonal elements are null. In the last decades the use of orthogonal polynomials has been spread out over applications for ordered twoway and three-way correspondence analysis [38-42].
Through the use of orthogonal polynomials that are associated with ordered categorical variables, the partition allows to analyze and decompose the total inertia (of the cloud of points) in terms of linear, quadratic and higher order polynomial components. Not only the total inertia, but also the contribution to the inertia by each singular value can be partitioned in orthogonal polynomial components, showing the contribution of the dominant ones (linear, quadratic, cubic, etc). After computing the orthogonal polynomials with respect to the marginal distribution of the p ordered categorical variables and forming the diagonal super-matrix , the hybrid decomposition (HD) for MCA indicator super-matrix
  can be applied (see for detail [22]). At the heart of the analysis lies the matrix
 by means of its definition the total inertia (sum of the diagonal elements of the matrix
 ) can be expressed as
The (m,vk)th value of  defines the contribution of the vkth-order bivariate moment between the categories of the kth ordered variable to the mth principal axis. When v = 1, the element
  describes the importance of the location component for the kth variable on the mth axis of a classical MCA plot. Therefore, the overall location component of the categories of the kth variable can be determined by calculating
 .
.
If this component is significant, then there is a signifycant variation in the location of those categories. The quadratic component of the categories can be calculated by  which reflects the spread of the categories of the k.th variable. The case for p = 2 ordered variables considers two sets of orthogonal polynomials [23].
Using the HD implies computing the singular vectors for the individuals and the orthogonal polynomials for the ordered categorical variables. Therefore, the total inertia of the contingency table is not only partitioned into polynomial components, but can also be partitioned into m singular values and singular vectors. To test for statistically significant components in the decomposition of the total inertia using , the mathematical equivalence between the inertia and the Pearson chi-squared statistic is considered. Indeed, Bekker and de Leeuw [43] show that the total sum of squares of the Burt matrix can be written as the sum of squares of all non-diagonal sub-matrices plus the sum of squares of all diagonal matrices. Note that the sum of squares of a diagonal matrix of the Burt matrix equals its trace and the sum of squares of a non-diagonal sub-matrix equals the Pearson chi-squared statistic divided by n. So the total sum of squares of the resulting matrix can be expressed in function of the element of the
  matrix and it can be shown that is asymptotically chi-square distributed (for details see [22]).
Under similar conditions, due to the relationship between the bivariate moment  and the eigenvalue
 , we assume the bivariate moment values are chi-square distributed as well.
As the hybrid partition involves singular vectors and polynomial components, the inertia can be partitioned in terms of linear, quadratic and higher order components. In fact, one of the main advantages in OMCA is that not only the total inertia, but also the inertia associated with the mth singular vector can be partitioned into the sum of squares of the bivariate moments. As shown before, these are defined by the elements of the matrix . Differently from the matrix of singular values, the matrix
  is not diagonal. The non-zero off-diagonal associations between the row and column categories allow us to identify important structures in the data not otherwise detected. The inertia accounted for by the first axis is partitioned in terms of polynomials components, and establishing the relationship between
  and
and we check the statistical significance of the components. In practice, when the linear component is dominant, then the representation using polynomials allows us to visualize the linear trend in the categories along the first polynomial axis. Unlike classical factorial analysis, the first and second polynomial axis are not necessarily the most important; for example, it may happen that the cubic or the forth polynomial is significant, while the linear and quadratic ones are not.
To display the association among variable categories and to enhance the interpretation of the graphical display, a plotting system based on the orthogonal polynomials is employed. In these plots the dimensional style of interpretation is always valid. This applies to one axis at a time and consists in using the relative positions of one set of points on an axis giving the dimension a conceptual name. First, we will focus on the representation of the categories.
To compute category coordinates related to the  matrix, we consider the super-matrix of orthogonal polynomials. The computed coordinates for the categories in OMCA are identical to the coordinates obtained from classical MCA. As consequence the plot interpretation does not change: those categories that do not contribute to the association between the variables, will lie close to the origin of the correspondence plot, similarly, the distance of category points further from the origin indicates the relative importance of that variable to the association structure of the variables.
One of the possibilities of standard MCA is to represent categories and individuals simultaneously in the same map; but, if the number of objects is very large, the joint plot does not give a very clear display of the association between individuals and categories. The standard graphical display, which uses standardized coordinates for the individuals, leads to a scatter of points with very often no apparent pattern or structure (except for the so called horse-shoe that points to a very dominant first dimension). Therefore, coordinates for individuals are often left out from a multiple correspondence analysis. Unlike classical MCA coordinates, the unit coordinates obtained by using orthogonal polynomials are automatically arranged in distinct clusters, thereby giving a simple structure and classification of the units. Assuming that all variables consist of the same number of ordered categories (as in data consisting of Likert items) such that jk = j for all k = 1,2, ···, p, and that these categories are assigned equivalent scores to reflect the ordinal structure of the variable they belong to, the OMCA units plot will consist of j clusters of units. This particular feature makes very attractive OMCA to monitor (dis)satisfaction of each employee cluster in different time or spaces. Further, as in questionnaires there is more information given by nominal categorical variables (example: employee’ status, job contract, education level, etc.), we propose to take into account this qualitative information by splitting the data in so many sets as the number of nominal categories and applying the hybrid decomposition, on which OMCA is based, to each data set.
In the following section we give an example of the strategy of analysis using different ordinal and nominal variables.
4. JS in the Social Cooperatives
At first to describe the context of the JS survey, we present some information of the social cooperatives in Campania region (Italy). Successively we fix our attention on the relationship between objective facets (worker status, job contract, incentives) and satisfaction, then on the subjective ones (motivations, fairness, autonomy, complexity, loyalty) and satisfaction.
4.1. The Social Cooperatives in Campania
The social cooperatives active in Campania country on December 31, 2009 are 1500 (data source: Company Register Book). In order to better analyse the territorial distribution, given the different demographic weight of the provinces, we can observe the presence of the cooperatives at local level confronted to the resident population (obtained through the proportion between the number of the cooperatives and the resident population per 100.000 inhabitants). The higher presence of social cooperatives was found in province of Benevento (Figure 2).
In particular according to the company register book of all the social cooperatives operating in Caserta province, only the 0.2% have adopted, during the year 2009, the status of social enterprise on the basis of the D.Lgs 155/06. The knowledge of the law results insufficient as we can see in Figure 3.
With regard to the distinction of social cooperatives according to the typology in Caserta province, we can see that of the 259 cooperatives present in the province, only 20% operate in the “socio-sanitary” sphere in cooperation with the public sanitary enterprise (A.S.L./CE). In
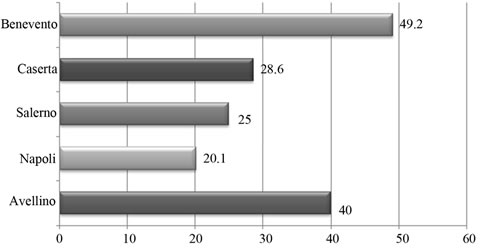
Figure 2. Social cooperatives of Caserta province.
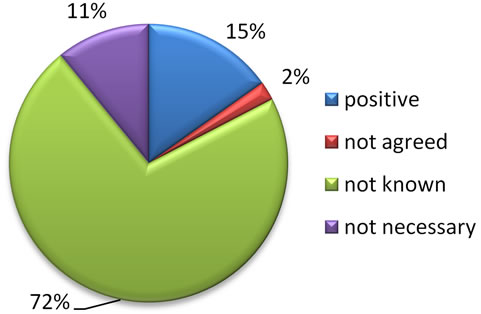
Figure 3. Social cooperatives operating in Caserta province —Knowledge of law 155/06.
the survey of JS conducted by the Economics Faculty of the Second University of Naples [25], the sample has been represented by 92% social cooperatives operating into the socio-sanitary field. We can observe (Figure 4) that the percentage of cooperatives which provide sociosanitary and educational services, called of type “A”, is the 41%, and the percentage of cooperatives which carry out productive activities in order to integrate disadvantaged people into the labor market, called of type “B”, is only the 7%. Finally the social cooperatives of mixed type (that is types “A” and “B” together) represent the 52% of the total. The JS questionnaire has been submitted to 427 non-disadvantaged workers, distinguishing between business partners (52%) and not partners (48%). Moreover, the 77.5% of the workers has got a short-term contract and only the 22.5% has got a longterm contract.
After this brief description of the survey context, we wonder if the job satisfaction is more influenced on the level of autonomy, job complexity and distributive and procedural fairness rather than on salaries.
As the study about the quality of the job involves a multiplicity of variables needed to define the objective and subjective JS facets, then a large number of OMCA analysis have been performed.
4.2. The Relations between JS and the Objective Facets
At the beginning OMCA has concerned the study of the workers’ overall satisfaction (including all the variables that identify the aspects of the extrinsic and intrinsic satisfaction) compared to the worker status of partner or non-partner. Each variable presents four ordered categories classified from 1 to 4 (not at all satisfied, little satisfied, satisfied, highly satisfied). Observe that in all OMCA analysis, we have considered the extrinsic and intrinsic satisfaction variables plus the overall satisfaction variable (E1-organization, E2-stability, E3-retribution, E4-autonomy, I1-relations with users, I2-relations with superiors, I3-aknowledgement, I4-involvment, I5- transparency, C1-general job satisfaction). The main difference among all OMCA analysis concerns the selected sub-set of workers on which the various analysis have been performed. The first OMCA analysis has concerned the partner workers. In particular we look at the study of satisfaction among business partners and not-partners. The automatic clustering of workers, which represents one of the advantageous results of OMCA, is reported in Table 1. We see that the higher percentage of workers, who appear to be highly satisfied, are business partners (46% vs 29.1% non-partners).
The four percentages of business partners of Table 1 are linked to graphical displays of OMCA, i.e. Figures 5 and in particular in Figure 5, we represent the association among the variable categories, which has been determinant of the numerousness of the four partners’ clusters, while in Figure 6, we look at the graphical representation of the four partners’ clusters of Table 1.
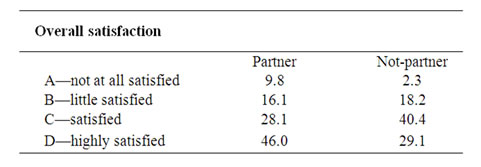
Table 1. OMCA status of partner or not-partner.
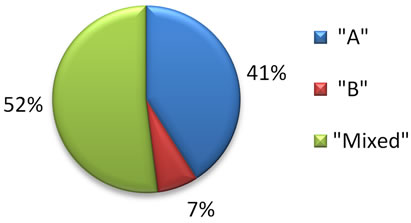
Figure 4. Distinction of social cooperatives according to the typology.
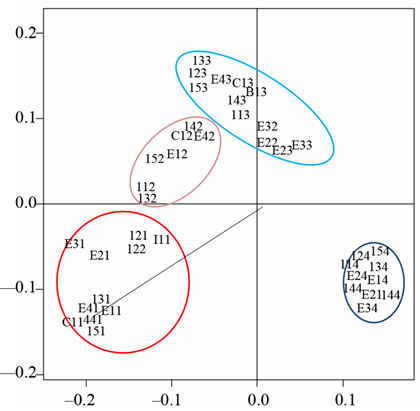
Figure 5. OMCA plot of variable categories.
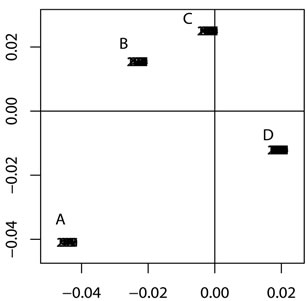
Figure 6. OMCA plot of individual cluster. A = not at all satisfied; B = little satisfied; C = satisfied; D = highly satisfied.
As each variable presents four ordered categories classified from 1 to 4, then the numbers considered into the labels of Figure 5 are two: the first one shows the demand/variable and the second one shows the category (being the scale from 1 to 4 we can identify four main levels: not at all satisfied, little satisfied, satisfied, highly satisfied; for example if the answer to the extrinsic satisfaction variables is highly satisfied, we have to consider the categories with the following labels E14, E24, E34, E44). In Figure 5, we see that there is a strong association among the categories when the answer is highly satisfied (category 4) and for this reason we can say that this cluster (group 4) presents an high homogeneity, while we note a weak homogeneity (greater variability) in clusters 1 and 2, indeed when the answer is not at all satisfied or little satisfied (category 1 and 2) then variable categories show an higher dispersion, (note that the coordinate values of these categories on the second axis are very different in Figure 5).
So if it is true that the dissatisfaction is expressed when all the extrinsic and intrinsic satisfaction features are valued with scale point 1, then the dispersion of the categories suggests that the association among the variables with category 1 (or scale point 1) is less strong if compared with the association among the variables with category 4 (scale point 4, IV quadrant). So we can argue that the motivations of dissatisfaction are well distinct. More specifically, we note the furthest position of E21 (stability) and E31 (retribution), compared with E11 (organization) and E41 (autonomy) which are strongly related with C11 (general dissatisfaction about the present job).
Furthermore, we observe that the intrinsic satisfaction variables I21 (not at all satisfied in the relationship with the superiors), I11 (not at all satisfied in the relationship with the users) are well distinct from I31 (not at all satisfied about the acknowledgment), I41 (not at all satisfied about the involvement) and I51 (not at all satisfied about the transparency of relationships), which are strongly associated with C11 (general dissatisfaction about the present job).
In synthesis the general dissatisfaction about the present job has been caused by complaints on the organization, on the autonomy, on the acknowledgment, on the involvement and on the transparency rather than on stability, on retribution and on relationships with users and superiors.
These first results confirm that the job satisfaction is related to the level of autonomy rather than on salaries.
As pointed out above, Figure 6 shows the four clusters of partners automatically created in connection with the four categories, in particular we indicate with letter A the group not at all satisfied of workers, with B the little satisfied cluster, with C the satisfied one and with D that highly satisfied. Clearly the numerousness of those clusters is indicated in Table 1.
By decomposing the inertia of the first and the second axis, the linear and the quadratic components turn out to be important for the interpretation of the variable categories dispersion above considered. The statistically significant components of the inertia to each axis are identified with three levels of significance: 0.01 (***), 0.05 (**), 0.10 (*). Table 2 shows the significant components of the first and second axis; the linear and the quadratic inertia components result highly significant (137.72*** and 88.94***). Further with reference to the inertia contribution, the variables more important are C1 (overall satisfaction of the present job), which explains the 25.2% of the total inertia; I3 (acknowledgement) with the 24.6%; followed by I5 (transparency) with the 23.9% and by E4 (autonomy) with the 23.8%.
Successively to check in detail the influence of other job objective variables on the overall satisfaction, OMCA analysis on JS have been performed with regard to the contract of work (full-time and part-time). In order to summarize, instead of reporting more graphics and tables concerning the association of the variable categories considered, we only report the table linked to the automatic classification of workers obtained through OMCA. In Table 3 we can observe the percentages of the 4 clusters with reference to the contract of work.
We can read that the percentage of satisfied/highly satisfied workers is higher in case of voluntary part-time contract than obligatory part-time contract (77.9% vs 46.8%). But it is also true that the percentage of satisfied/highly satisfied workers is large among the full-time workers (73.9%). Once again we can say that the level autonomy of workers plays an important role to job satisfaction.
Moreover, bearing in mind the importance of incentives into economics theory, the last analysis concern the study of satisfaction with regard to the offered incentives (monetary and not) to the workers. Table 4 reports the percentages of the satisfied workers in relation to the incentives.
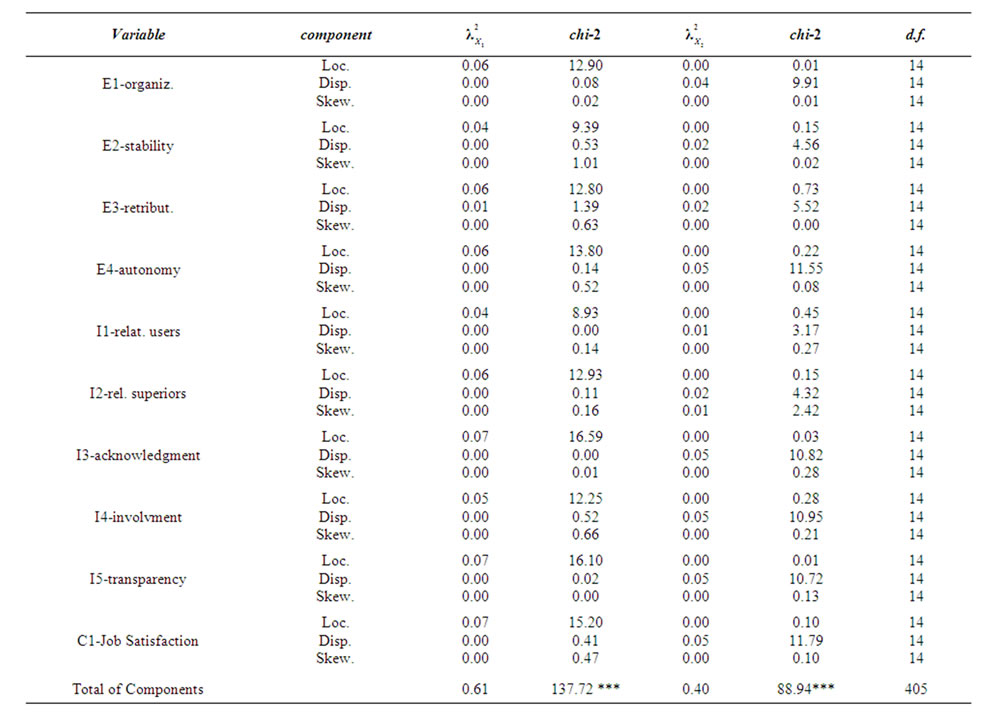
Table 2. OMCA Inertia of the first two axes, decomposition in terms of polynomial components.
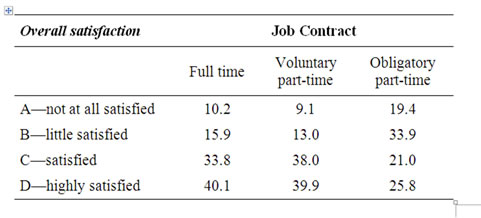
Table 3. OMCA job contract by overall satisfaction.
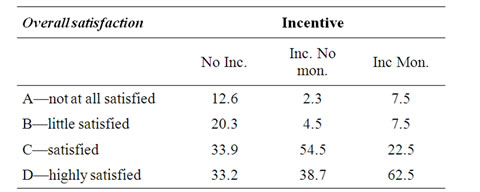
Table 4. OMCA kind of incentives by overall satisfaction.
Concerning the incentives, we can say that generally workers are more satisfied in presence of incentives. We also note that the percentage of highly satified workers is higher when the incentives are monetary (62.5%), but the total of satisfied/highly satisfied workers is higher when the incentives are not-monetary (about 93.2% vs 85%). In synthesis not-monetary incentives create more satisfaction among workers than monetary one.
4.3. The Relations between JS and the Subjective Facets
In order to analyse in detail the workers’ feeling of autonomy and complexity (intrinsic aspects of JQ), we perform OMCA to know the common consideration about autonomy (two questions) and complexity (four questions). In Table 5 we report the numerousness of workers’ feeling autonomy and complexity as absent, little, enough or high in their own cooperatives. In particular, the 55.3% of workers complains about ab-sence/little autonomy (handling the relationship with the users, resolving work problems in full autonomy) and finally the 75.4% considers the job enough/high complex (strong responsibilities, high rhythms, unexpected decisions, high level competences).
At last we look at the variables related to the distributive equity (i.e. the perception of the balance of the relationship between what a worker gives and what he gains) and those related to the procedural equity (i.e. the perception of the existence of a system of rules that controls the relationship between the workers and the cooperative; three questions). We asked the workers how they feel the procedural and distributive fairness: absent, little, enough, high (four ordered variable categories).
In Table 6 are reported the numerousness of the four clusters of employees who valued the procedural equity and the distributive equity. It is worth noting that only the 38.6% feels enough/high the distributive equity in their own job relationship, while the majority (almost the 84.6%) considers the equity enough/high in the procedural sense.
As consequence, the cooperative governance should give more efforts to improve the distributive fairness to reach an high level of job satisfaction.
All the analysis results confirms in plain that the job satisfaction in social cooperatives is more influenced by the autonomy, complexity, fairness rather than by salaries.
Stressing the association between workers’ satisfaction and motivations, we analyse by OMCA these data and, in Table 7, we present the percentages of the satisfied workers in relation to the ex-ante motivations. With reference to the ex-ante motivations, three main different motivations have been considered that in forward will be labeled as M1, M2 and M3. We distinguish workers who claimed to have been attracted towards cooperatives because of the chance to satisfy personal needs of retribution and occupation (M1); from workers eager to help people in trouble (M2); and finally workers motivated to share ideals and values of cooperatives (M3). Focusing on the high motivated workers, as in the previous OMCA analysis we automatically classify workers in 4 clusters corresponding to the four different levels of satisfaction (Table 7). We read that the higher percentages of satisfied/highly satisfied workers are reported when the ex-ante motivations are of social kind (M3 and M2).
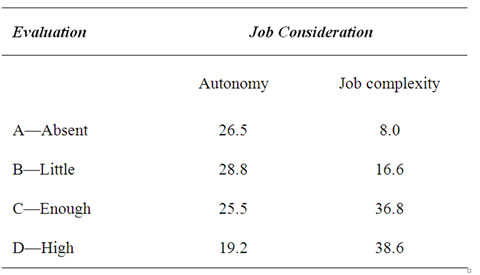
Table 5. OMCA job autonomy and complexity.
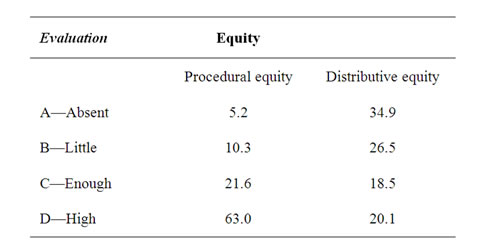
Table 6. OMCA distributive and procedural equity evaluation.
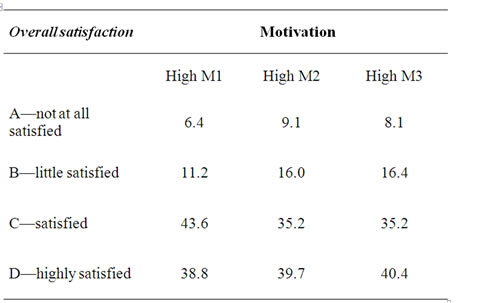
Table 7. OMCA motivation by overall satisfaction.
In conclusion highlighting loyalty as relevant facet of the job quality, we shared between intrinsic and extrinsic satisfaction questions. The individual clusters are reported in Tables 8 and 9, respectively. Concerning workers with loyalty intentions, both the intrinsic (relationships with the users, superiors, involvement and transparency of cooperative organization) and the extrinsic satisfaction (stability, retribution, organization, autonomy) is logically higher than satisfaction of not-loyal workers (90.6% vs 52.9% and 84.7 vs 38.6, respectively).
Whereas, it is interesting to observe that not-loyal workers (as well loyal workers) report more satisfaction when we consider intrinsic aspects than extrinsic facets, 52.9% vs 38.6%, (90.6% vs 84.7%) respectively. We can resume that the percentage of the loyal employees satisfied/ highly satisfied is higher when we investigate about the intrinsic satisfaction and it is lower with regards to the extrinsic satisfaction, nevertheless the same happens when we look at the not-loyal employees.
These findings confirm the economic theory that underlines the importance of the intrinsic facets of the JQ rather than the extrinsic ones.
5. Conclusions
The Job Satisfaction (JS) is usually used as a proxy variable of the JQ in enterprises, especially in the social services sector [12,13,26] and consequentially it can be seen instrumental to create enterprise value.
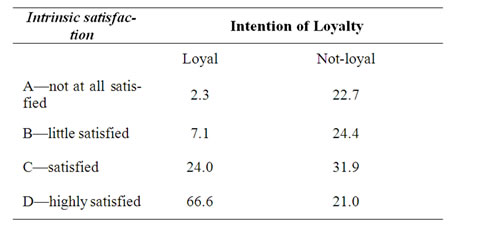
Table 8. OMCA loyalty and Intrinsic satisfaction.
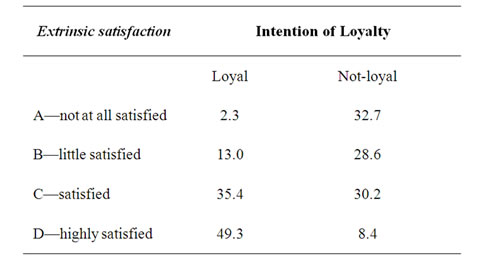
Table 9. OMCA loyalty and extrinsic satisfaction.
There are different factors (or variables) of objective and subjective nature which play a role in the complex study of the job quality inside social enterprises, characterized by a peculiar model of industrial relations [27]. In this paper we have presented a new strategy of JS analysis based on OMCA tool, to inquire if the job satisfaction in social cooperatives is more influenced by the autonomy, complexity, fairness rather than by salaries. Checking that the objective facets of the job quality (contract, wages, economics politics) are less influent on the job satisfaction than the subjective ones (relationships, motivations, fairness, autonomy, complexity, loyalty). The survey data on the JQ has concerned the socio-sanitary cooperatives of Caserta province (Italy) and different OMCA analysis have been performed.
Recently presented in literature, OMCA [22] has been shown to be an useful tool to monitor (dis)satisfaction in different times or spaces and support decision making in customer-centric planning tasks. Further as instrument of early warning system (EWS), OMCA has allowed to give signals of possible enterprise risks coming from the lost of job quality and satisfaction.
Shortly in socio-sanitary cooperatives of Caserta, the different analysis of JS by OMCA have shown that the percentages of satisfied/highly satisfied workers are in all cases higher than the percentages of those not at all/little satisfied. The causes of dissatisfaction have been mainly motivated by organizational problems and by a lack of autonomy rather than retribution and stability (coherently with the labor economic theory), but also by a lacking acknowledgment for the accomplished work. Satisfaction analysis cannot leave out of consideration the knowledge of workers’ expectations and of ex-ante motivations [26]. If we look at the OMCA results compared with management politics [15], we can say that workers mainly complain about the absence or the shortage of distributive equity principles (fair retribution according to the educational qualification, the commitment/stress, etc.) rather than about procedural equity principles (simple guidelines, information to workers, respect for the word given).
In synthesis the job satisfaction in social cooperatives is more influenced by autonomy, complexity, fairness rather than by salaries, highlighting the importance of the intrinsic facets of JS rather than the extrinsic ones.
REFERENCES
- A. Payne, S. Holt and P. Frow, “Integrating Employee, Customer and Shareholder Value through an Enterprise Performance Model: An Opportunity for Financial Service,” International Journal of Bank Marketing, Vol. 18, No. 6, 2000, pp. 258-273. doi:10.1108/02652320010358689
- A. Payne, S. Holt and P. Frow, “Relationship Value Management: Exploring the Integration of Employee, Customer and Shareholder Value and Enterprise Performance Models,” Journal of Marketing Management, Vol. 17, No. 7-8, 2001, pp. 785-817. doi:10.1362/026725701323366827
- M. Manisera, “Un’analisi Esplorativa Della Qualità del Lavoro Nelle Cooperative Sociali,” In: M. Carpita, Ed., La qualità del lavoro nelle cooperative sociali. Misure e Modelli Statistici, Franco Angeli, Milano, 2009, pp. 37- 72.
- E. Brentari and S. Golia, “Misure Oggettive Della Qualità del lavoro Soggettiva Nelle Cooperative Sociali,” In: M. Carpita, Ed., La Qualità del Lavoro Nelle Cooperative Sociali. Misure e Modelli Statistici, Franco Angeli, Milano, 2009, pp. 95-125.
- A. Thomas, “The Rise of Social Cooperatives in Italy, Voluntas,” International Journal of Voluntary and Nonprofit Organizations, Vol. 15, No. 3, 2004, pp. 243-263. doi:10.1023/B:VOLU.0000046280.06580.d8
- A. Codini, “Le Cooperative Sociali—Assetti di Governance e Aspetti di Gestione,” Franco Angeli, Milano, 2007.
- P. Venturi and F. Zandonai, “La Nuova Normativa: Una rivoluzione Mancata?” In: C. Borzagha and F. Zandonai, Eds., Impresa sociale in Italia, Donzelli Editore, Roma, 2009, pp. 9-18.
- C. Travaglini, “Cooperativa Sociale Come Azienda Collaborativa Multistakeholder,” Impresa Sociale, Vol. 31, No. 1, 1997, pp. 1-15.
- A. Lionzo, “La Cooperativa Sociale,” Franco Angeli, Milano, 2001.
- M. Carpita, “La Qualità del Lavoro Nelle Cooperative Sociali. Misure e Modelli Statistici,” Franco Angeli, Milano, 2009.
- C. Borzaga and A. Ianes, “L’economia Della Solidarietà Storia e Prospettive Della Cooperazione Sociale,” Donzelli Editore, Roma, 2006.
- S. Depedri, “Motivazioni ed Incentivi,” In: M. Demozzi and F. Zandonai, Eds., Impresa Sociale di Comunità. Strumenti per la Creazione e la Gestione, Trento, 2007, pp. 236-248.
- J. A. Kerlin, “Social Enterprise in the United States and Europe: Understanding and Learning from the Differences,” Voluntas, Vol. 17, No. 3, 2006, pp. 247-263. doi:10.1007/s11266-006-9016-2
- P. F. Drucker, “They’re Not Employees, They’re People,” Harvad Business Review, Vol. 80, No. 2, 2002, pp. 70-77.
- R. E. Freeman, A. C. Wicks and B. Parmar, “Stakeholder Theory and the Corporate Objective Revisited,” Organization Science, Vol. 15, No. 3, 2004, pp. 364-369. doi:10.1287/orsc.1040.0066
- E. C. Tortia, “Worker Well-Being and Perceived Fairness: Survey-Based Findings from Italy,” The Journal of Socio-Economics, Vol. 37, No. 5, 2008, pp. 2080-2094. doi:10.1016/j.socec.2007.10.005
- C. Argyris, “Understanding Organizational Behavior,” Dorsey Press, Homewood, 1960.
- D. M. Rousseau, “The Problem of the Psychological Contract Considered,” Journal of Organizational Behavior, Vol. 19, No. S1, 1998, pp. 665-672. doi:10.1002/(SICI)1099-1379(1998)19:1+<665::AID-JOB972>3.0.CO;2-X
- N. Anderson and R. Schalk, “The Psychological Contract in Retrospect and Prospect,” Journal of Organizational Behavior, Vol. 19, No. S1, 1998, pp. 637-647. doi:10.1002/(SICI)1099-1379(1998)19:1+<637::AID-JOB986>3.0.CO;2-H
- D. M. Rousseau, “Promises in Action: Psychological Contracts in Organizations,” Sage, Newbury Park, 1995.
- M. Greenacre, “Theory and Applications of Correspondence Analysis,” Academic Press, London, 1984.
- R. Lombardo and J. Meulman, “Multiple Correspondence Analysis via Polynomial Transformations of Ordered Categorical Variables,” Journal of Classification, Vol. 27, No. 2, 2010, pp. 191-216. doi:10.1007/s00357-010-9056-6
- R. Lombardo and E. J. Beh, “Simple and Multiple Correspondence Analysis Using Orthogonal Polynomials,” Journal of Applied Statistics, Vol. 37, No. 12, 2010, pp. 2101- 2116. doi:10.1080/02664760903247692
- S. Lessman and S. Vob, “A Reference Model for Customer Centric Data Mining with Support Vector Machines,” European Journal of Operational Research, Vol. 199, No. 2, 2009, pp. 520-530. doi:10.1016/j.ejor.2008.12.017
- E. D. Valle, “L’analisi Multidimensionale dei dati: La qualità Del Lavoro Nelle Cooperative Sociali,” Thesis in Statistics, Unpublished Work, Facoltà di Economia della Seconda Università degli Studi di Napoli, February 2010.
- Y. Stryjan, “The Practice of Social Entrepreneurship: Notes towards a Resource Perspective,” In: C. Steyaert, and D. Hjorth, Eds., Entrepreneurship as Social Change: A Third Movements in Entrepreneurship Book, Edward Elgar Publishing, Cheltenham, 2004, pp. 35-56.
- C. Borzaga and J. Defourny, “The Emergence of Social Enterprise,” Routledge, London, 2001.
- H. Anheier and A. Ben Ner, “The Study of the Nonprofit Enterprise: Theories and Approaches,” Kluwer Academc/ Plenum Publishers, New York, 2003.
- L. M. Salamon and H. K. Anheier, “WP of the Johns Hopkins Comparative Nonprofit Sector Project,” Baltimore, 1997.
- M. Nyseen, “Social Enterprise,” Routledge, London, 2006.
- A. Payne and S. Holt, “Diagnosing Customer Value: Integrating the Value Process and Relationship Marketing,” British Journal of Management, Vol. 12, No. 2, 2001, pp. 159-182. doi:10.1111/1467-8551.00192
- M. Carpita and E. Poli, “Statistica per l’impresa Sociale di Qualità,” Rivista di Economia e Statistica per il Territorio, Vol. 3, 2007, pp. 91-108.
- M. Bertrand and S. Mullainathan, “Do People Mean What They Say? Implications for Subjective Survey Data,” American Economic Review, Papers and Proceedings, Vol. 91, No. 2, 2001, pp. 67-72. doi:10.1257/aer.91.2.67
- C. D. Fisher, “Why Do Lay People Believe That Satisfaction and Performance Are Correlated? Possible Sources of a Commonsense Theory,” Journal of Organizational Behavior, Vol. 24, No. 6, 2003, pp. 753-777. doi:10.1002/job.219
- D. J. Schleicher, J. D. Watt and G. J. Greguras, “Reexamining the Job Satisfaction-Performance Relationship: The Complexity of Attitudes,” Journal of Applied Psychology, Vol. 89, No. 1, 2004, pp. 165-177. doi:10.1037/0021-9010.89.1.165
- S. Highhouse and A. S. Becker, “Facet Measures and Global Job Satisfaction,” Journal of Business and Psychology, Vol. 8, No. 1, 1993, pp. 117-127. doi:10.1007/BF02230397
- E. J. Beh, “Simple Correspondence Analysis of Ordinal Cross-Classifications Using Orthogonal Polynomials,” Biometrical Journal, Vol. 39, No. 5, 1997, pp. 589-613. doi:10.1002/bimj.4710390507
- D. J. Best and J. C. W. Rayner, “Nonparametric Analysis for Doubly Ordered Two-Way Contingency Tables,” Biometrics, Vol. 52, No. 3, 1996, pp. 1153-1156. doi:10.2307/2533077
- E. J. Beh, B. Simonetti and L. D’Ambra, “Partitioning a Non-Symmetric Measure of Association for Three-Way Contingency Tables,” Journal of Multivariate Analysis, Vol. 98, No. 7, 2007, pp. 1391-1411. doi:10.1016/j.jmva.2007.01.011
- R. Lombardo, E. J. Beh and L. D’Ambra, “Non-Symmetric Correspondence Analysis for Doubly Ordered Contingency Table,” Computational Statistics & Data Analysis, Vol. 52, No. 1, 2007, pp. 566-578. doi:10.1016/j.csda.2006.12.040
- R. Lombardo, “Data Mining and Explorative Multivariate data Analysis for Customer Satisfaction Study,” In: A. S. Koyuncugil and N. Ozgulbas, Eds., Surveillance Technologies and Early Warning Systems: Data Mining Applications for Risk Detection, Information Science Publishing, Hershey, 2010, pp. 243-266. doi:10.4018/978-1-61692-865-0.ch013
- R. Lombardo, “Data Mining and Multiple Correspondence Analysis via Polynomial Transformations,” Proceeding of COMPSTAT, Paris, 23-27 August 2010, pp. 1302-1310.
- P. Bekker and J. de Leeuw, “Relations between Various Forms of Nonlinear Principal Component Analysis,” In: J. L. A. van Rijckevorsel and J. de Leeuw, Eds., Component and Correspondence Analysis, John Wiley & Sons, Chichester, 1988, pp. 1-33.