Journal of Geographic Information System
Vol.6 No.4(2014), Article
ID:49076,11
pages
DOI:10.4236/jgis.2014.64033
Spatial Pattern of Land Cover Change Using Remotely Sensed Imagery and GIS: A Case Study of Omo-Shasha-Oluwa Forest Reserve, SW Nigeria (1986-2002)
Oludare H. Adedeji*, Clement O. Adeofun
Department of Environmental Management and Toxicology, Federal University of Agriculture, Abeokuta, Nigeria
Email: *hakeemdare1222@yahoo.co.uk
Copyright © 2014 by authors and Scientific Research Publishing Inc.
This work is licensed under the Creative Commons Attribution International License (CC BY).
http://creativecommons.org/licenses/by/4.0/


Received 16 June 2014; revised 13 July 2014; accepted 8 August 2014
ABSTRACT
Spatial patterns of land cover changes in the Omo-Shasha-Oluwa Forest Reserves were conducted on Landsat TM and ETM+ imageries of 1986 and 2002 using remote sensing and GIS techniques. Extent of tree plantation (Gmelina arborea) grew from about 145 sq. km in 1986 to about 322 sq. km in 2002 (122% increase). The natural forest declined from about 2569 sq. km in 1986 to about 2253 sq. km by 2002, while the non-forest areas increased by some 5% from 341 km2 in 1986 to about 490 km2 by 2002. Land cover pattern and its changes in the study area are linked to both natural and anthropogenic processes such as illegal logging, demand for soft wood for industries and expansion of settlements. The conversion of natural forest into monoculture plantations should be discouraged because they do not give room for biodiversity. Specific forestry and environmental laws and regulations that significantly address landscape changes in reserved and protected areas should be enforced to reduce activities that negatively affect the forest reserves. There is also the need to develop a wider and more integrated GIS system of the forest and other land resources in the country to assist different kinds of planning and management activities.
Keywords:Classification, Land Cover Change, Change-Detection, GIS, Landsat TM and ETM+, Remote Sensing, Omo-Shasha-Oluwa Forest Reserve

1. Introduction
Land use and land cover changes all over the world are accelerating and causing widespread environmental problems and thus need to be mapped [1] [2] . Change in land cover is regarded as a single and most important variable of global change affecting ecological systems [3] [4] with an impact on the environment that is at least associated with climatic change [5] . Land cover change is a common phenomenon in all parts of the world. Such changes may be rapid (e.g. clearing of forest for agriculture) or relatively slow (e.g. tree damage and death due to acid rain) [6] , and may affect both socio-economic and ecological conditions [7] . According to Phat et al. [8] , the 21st century has brought new challenges for forest management and forest ecosystems. This potentially constitutes an extremely important tool for dealing with climate change, in addition to the ameliorative actions of people [9] . The spatial dimensions of land use and land cover need to be known at all times to enable policymakers and scientists to be sufficiently equipped to take informed decisions on land resources. Therefore, a wide range of scientists and practitioners, including earth systems scientists, land and water managers as well as urban planners seek information on the location, distribution, type and magnitude of land use and land cover change [10] [11] . In the tropical rain forests of south western, Nigeria has come under intense pressure due to rapid growth in population and economy of the country. Forest reserves established in the beginning of the 1920s such as the Omo-Shasha-Oluwa reserves were not spared from uncontrollable removal of the forest products causing rapid changes in the land cover pattern in these areas. The natural vegetation of the reserves has been destroyed and converted at a rapid rate from excessive logging, conversion to forest plantations (Gmelina arborea) and farming. Excessive uncontrolled hunting for the commercial bush meat trade [12] was also decimating their wildlife populations. Despite the immense advantages of forests, agencies and organizations have reported great forest losses due to unfavourable forestry practices all over the world [13] .
Mapping of land use/cover and its change provides in-valuable information for managing land resources and for projecting future trends of land productivity [14] . Land use and land cover change-detection and mapping are an important requirement for a range of environmental applications, including land use planning, landscape monitoring, natural resources management and habitat assessment [15] -[17] . These changes have impacts on the ecological stability of the forest regions and, thus identifying and investigating the status of a resource such as the forest cover which is a crucial part in resource management and monitoring at local or global perspectives [18] . Remote sensing (RS) and geographic information systems (GIS) have proved to be some of the most accurate means of measuring the extent and pattern of changes in land cover patterns over time [19] -[21] . The techniques also provide viable source of data from which updated land cover information can be extracted efficiently and cheaply in order to monitor the changes in the land cover [22] -[24] . The aim of the study is to apply GIS and remote sensing techniques to detect the spatial pattern of changes in forest land cover during the years 1986 to 2002 at Omo-Shasha-Oluwa Forest Reserve Area in South Western part of Nigeria. The specific objectives are: 1) to identify the changes that have occurred within the period covered by the images, 2) to determine the amount and rate of changes within the period of study, and 3) to highlight the possible causes of these changes and suggest possible solution to arrest the trend.
2. Material and Methods
2.1. Study Area
Omo-Shasha-Oluwa Forest Reserve, is situated in the south western part of Nigeria, is located on Latitude 4o to 4˚57'N and Longitude 6˚30' to 7˚21'E (Figure 1). The area covers about 3066 km2 and comprises the cluster of contiguous forest reserves that lie on the boundaries of eastern Ogun, western Ondo and southern Osun States. These are the Omo, Oluwa, Shasha, Ife and Ago-Owu Forest Reserves. They are collectively referred to as the Omo-Oluwa-Shasha forest complex, from the names of the three largest reserves: Omo (1325 km2), Oluwa (827 km2), and Shasha (310 km2). The area has a mean annual rainfall of about 2050 mm and mean monthly temperature of about 27˚C. The natural vegetation, which was previously lowland tropical rainforest (moist evergreen type), have been reduced to secondary forest, thickets and varying degree of fallow regrowth or annual and perennial crops, except in some parts of the forest reserves.
With the exception of the 640 hectare Strict Nature Reserve, now a Biosphere Reserve at the centre of the Omo forest reserve, most of the forest in the study area are disturbed with a substantial parts converted to tree plantations (Gmelina arborea). The plant families with the most abundant individuals include Araceae, Compo-
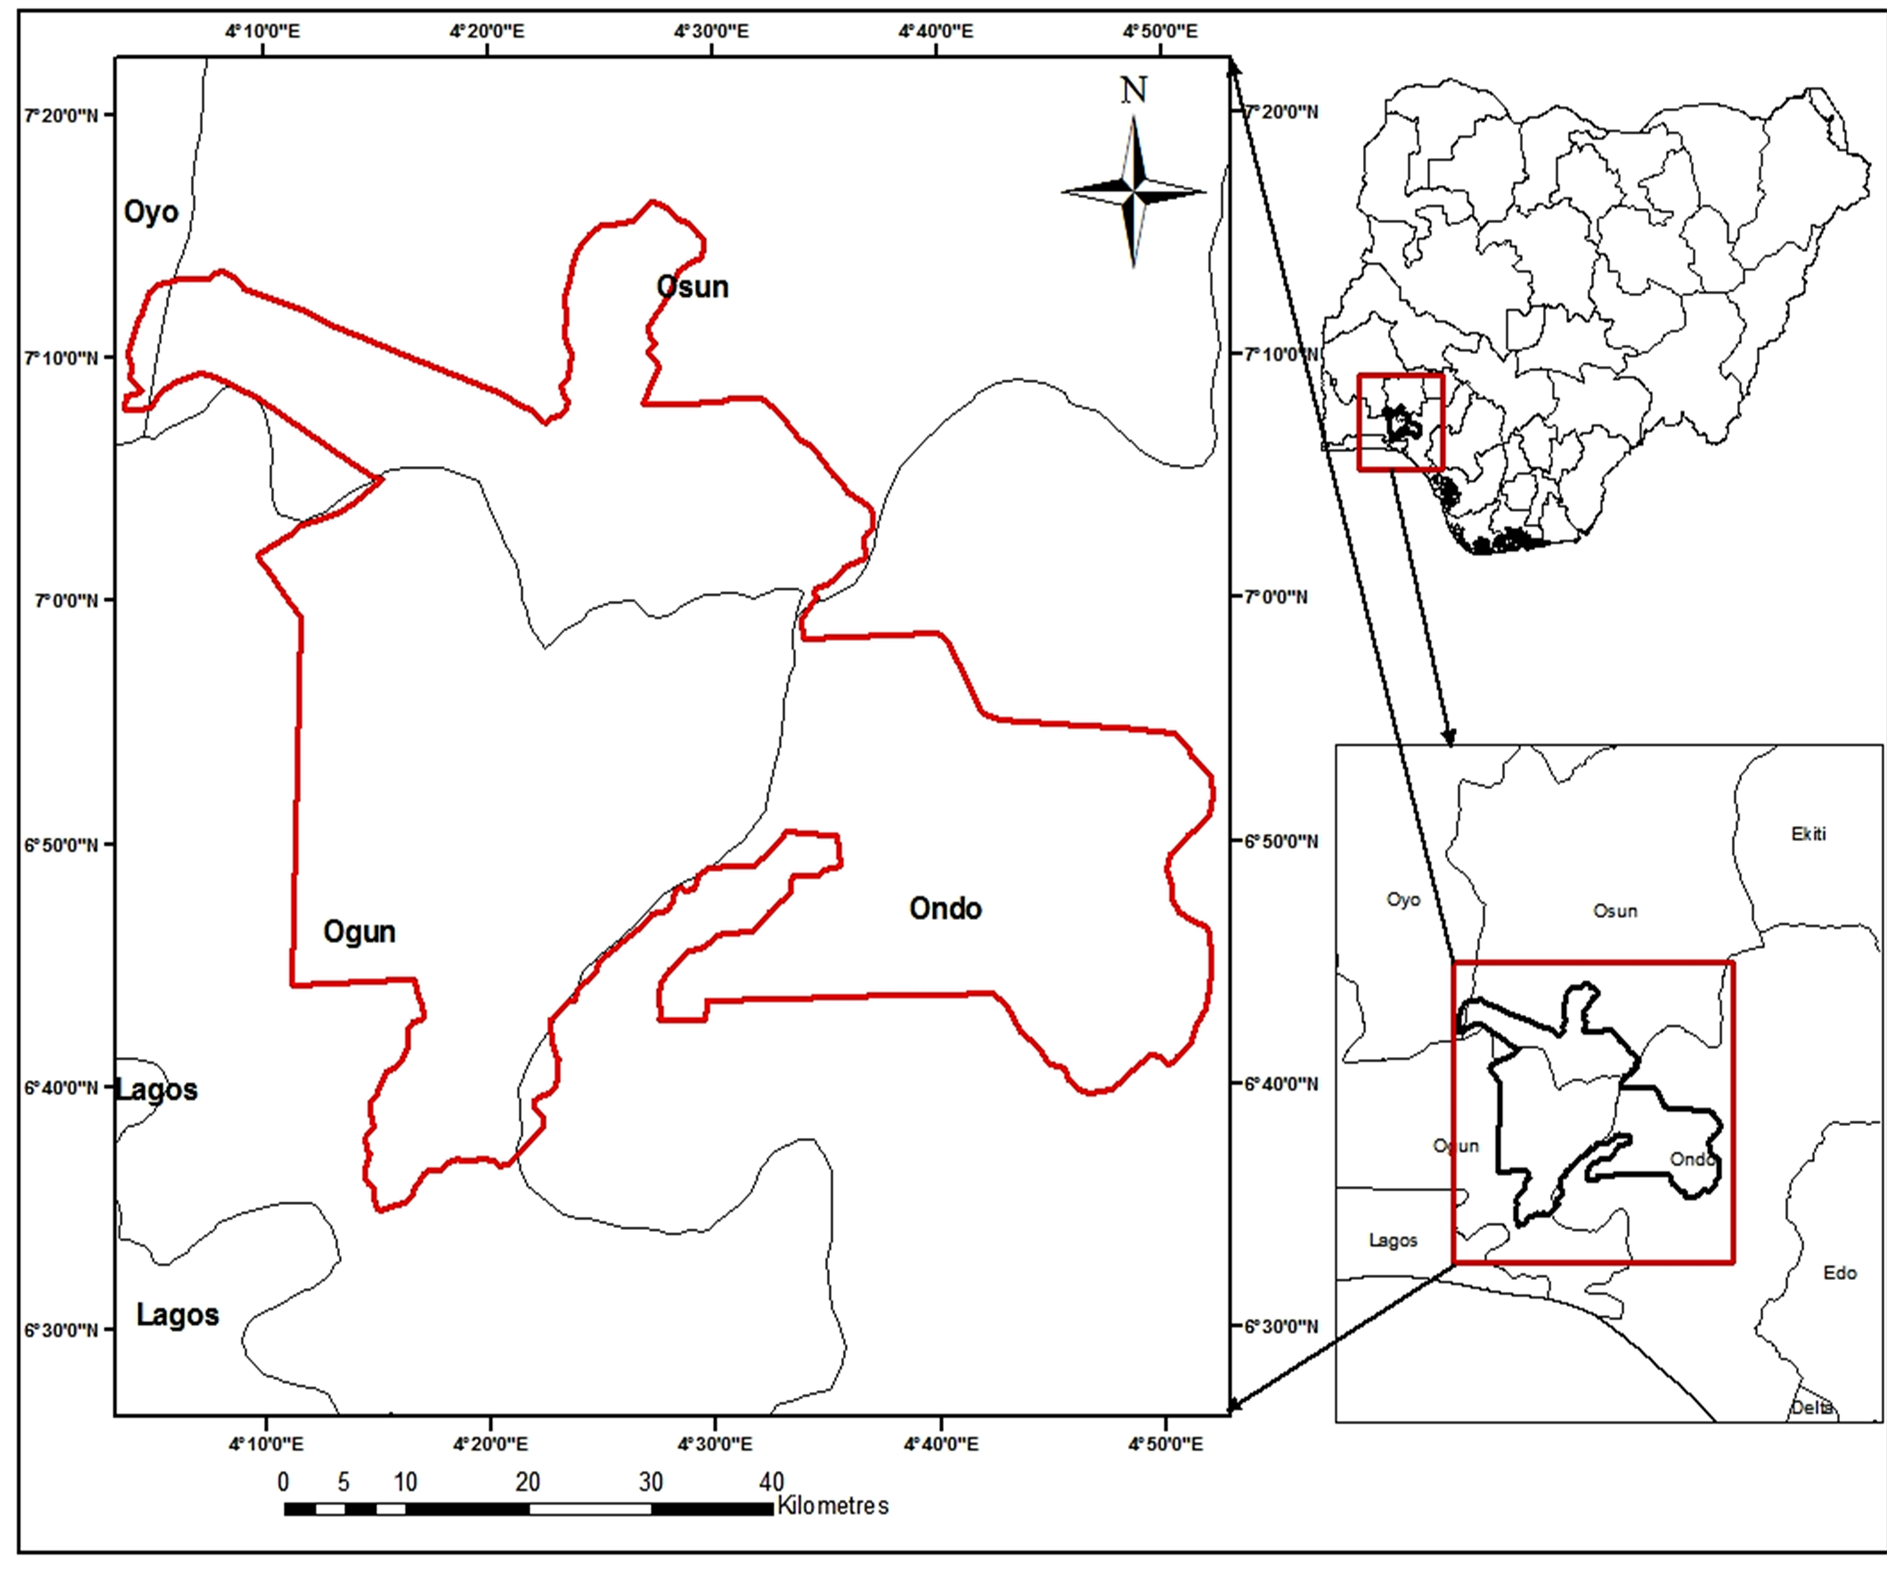
Figure 1. Location of the Omo-Shasha-Oluwa Forest Reserves in Southwestern, Nigeria.
sitae, Ebenaceae, Lilliaceae, Papilionoideae, Poaceae, Rubiaceae and Violaceae. The most common tree species include Diospyros spp., Nauclea diderrichii, Drypetes spp., Strombosia pustulata, Rinorea dentata and Voacanga Africana [25] .
2.2. Acquisition of Images
In this study, a Landsat TM image of 17th December 1986 and a Landsat ETM+ image of 3rd January 2002 were downloaded from the USGS Global Land Cover Facility (ftp.glcf.umd.edu/data/lands). The two images were taken from the same season in order to avoid the influence of seasonal changes in the forest. The images also represents some of the few periods when the area is cloud free. The images were already georeferenced and orthorectified with the UTM Zone 31N Coordinate on the WGS 84 reference system.
2.3. Image Masking
The images covered area larger than the area of interest, so there is the need to make a subset of the images to show only the area of interest (i.e. the Omo-Shasha-Oluwa Forest Reserve). For this purpose, the shapefile of the area of interest was digitized on a thematic map of the area which had earlier being georeferenced to the same coordinate with the satellite images. The shapefile was then use to make a mask that was used to extract the area of interest boundary from the images in the data preparation (mosaicking) tool using the software. The extracted area of interest and the original images have the same geographical projection, which makes the overlaying operations in ArcMap easy.
2.4. Classification
The supervised classification method using the maximum-likelihood classifier (MLC) was used to classify the images into the various land cover categories. Maximum-likelihood classifier assumes that the each class in each band can be described by a normal distribution [26] [27] . Digital image-processing software ERDAS Imagine (v. 9.3) [28] was used to process, analyse and integrate the spatial data and geographic information to achieve the objectives of the research. Visualization and change-detection maps were done using ArcGIS 9.3.1 software. The images were each classified separately into forest and non-forest. The forest areas were further classified as natural (closed) forest and plantation, while the non-forest areas. Ancillary data such as Google Earth image, topographic map, plantation map, soil map and others were was used for visual interpretation of the land cover classes. Figure 2 shows the flowchart of the steps and procedure in the study.
2.5. Accuracy Assessment
The promotion of classification accuracy has been always the focus of the research on abstracting the information on vegetation coverage types with the method of remote sensing classification [29] . The accuracy of the resulting thematic map was quantified using ground referenced data [30] . The three land cover types (natural or closed forest, tree plantation, and non-forest) were further validated based on the in-situ assessment of the site carried out during the fieldwork and ground truthing exercise using GPS. The overall classification accuracy, producer’s accuracy, and the user’s accuracy were then estimated [31] [32] . Three forest land cover categories were identified and classified in the study. Overall accuracy for the 1986 and 2002 imageries were 93% and 89% respectively, with Kappa of 70% and 65%.
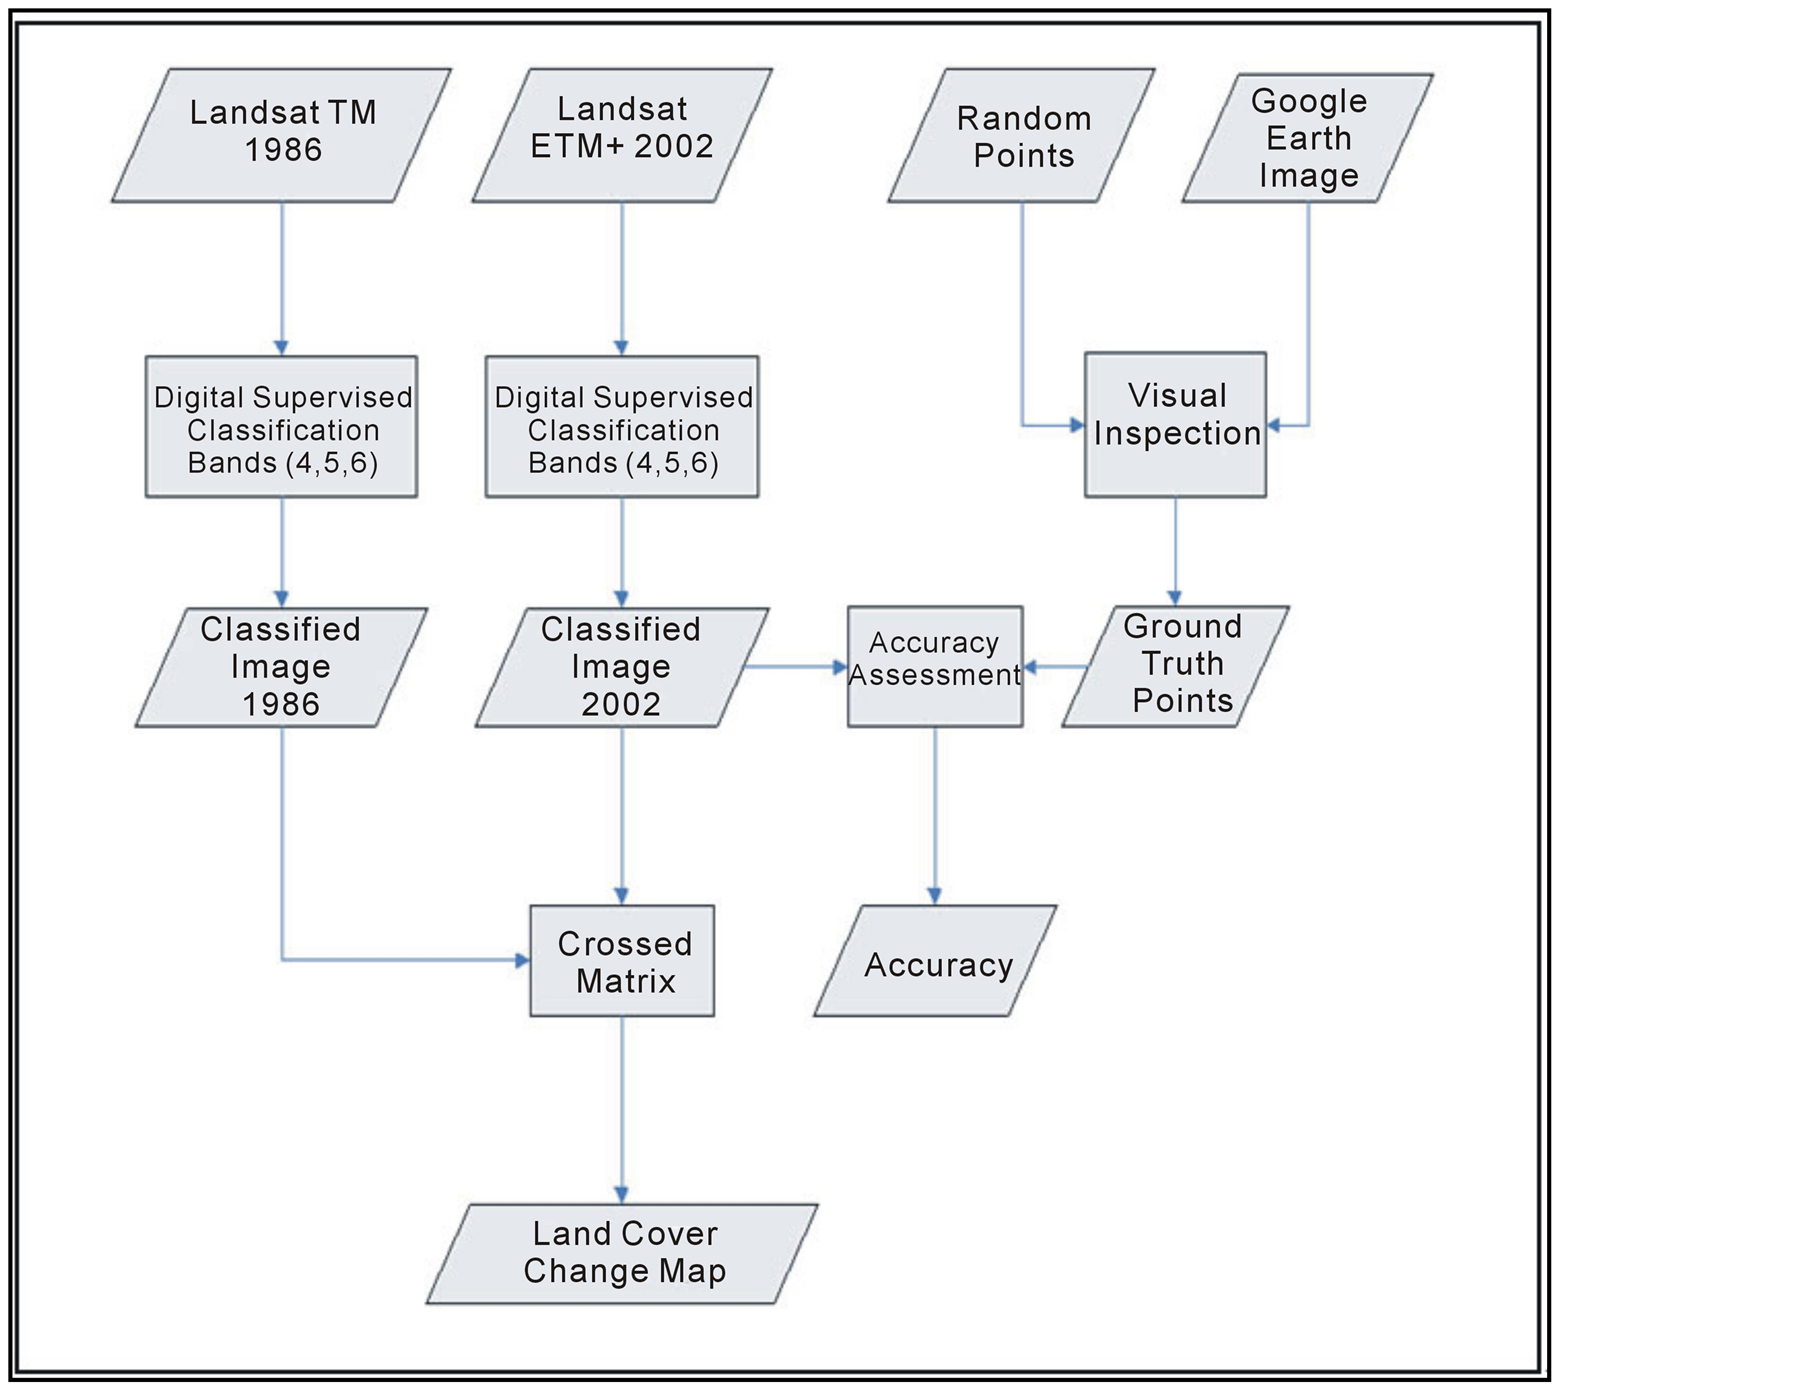
Figure 2. Flowchart showing the steps and procedure in the study.
2.6. Cross Matrix and Change Map
The classified images of 1986 and 2002 were crossed and a matrix obtained using the ERDAS software to identify what has changed between the two years. The amount of changes that have occurred and the direction of changes were calculated and the final land cover change map produced in the GIS environment.
3. Results
Classification and Land Cover Change
The study revealed that natural forest which covers about 2569 sq. km in 1986; have being reduced considerably 2253 sq. km by 2002. This shows a decrease in forest cover by about 10% of total land cover (Figure 3). The spatial extent of the plantation from about 144 sq. km in 1986 to around 322 sq. km in 2002, is a 6% increase. The area covered by non-forest (mostly bare and logged area) also increased by some 5% from 341 km2 in 1986 to about 490 km2 by 2002. Figure 4 shows the Landsat TM image of 1986 17th December 1986 and a Landsat ETM+ image of 3rd January 2002, while Figure 5 shows the classified maps of showing the land cover in the Omo-Shasha-Oluwa Forest Reserve for the study periods. The classified images shows the three land cover classes identified from the Landsat images, with the forest covering a larger percentage in the two periods under the study. The changes in the various land use and land cover categories (in sq. km) during the periods between 1986 and 2002 are shown in Figure 3. Figure 6 shows the land cover change map of the Omo-Shasha-Oluwa Forest Reserve between 1986 and 2002. It shows what land cover type change to other land cover types.
No change in land cover was observed in some parts of the study are within the study period. For example, 2059 sq. km of the land cover remained forest (i.e. about 73.8% of the original land cover in 1986. In addition, 176 and 60 sq. km of the area remained plantation and non-forest respectively between 1986 and 2002 (Table 1 and Figure 6) Changes were observed in other areas where about 303 and 207 sq. km of the area covered by natural forest changed to non-forest and plantation respectively. Furthermore, 121 and 55 sq. km of the previously non-forest area changed to forest and plantation respectively. Other changes that occurred in the area between 1986 and 2002 were also shown in Table1 About 12 sq. km of the plantation area in 1986 changed to non-forest in 2002, while some 73 sq. km of the plantation areas changed to forest. During this period, the natural forest declined by 316 sq. km or 12% (of the total forest cover) which was a change in the negative direction, while the plantation increased by more than twice its actual size in 1986 by 122%. Table 2 reveals the direction of the changes (positive or negative).
4. Discussions and Interpretation
Most land cover changes from 1986 to 2002 involve the conversion of the natural forest into monoculture tree
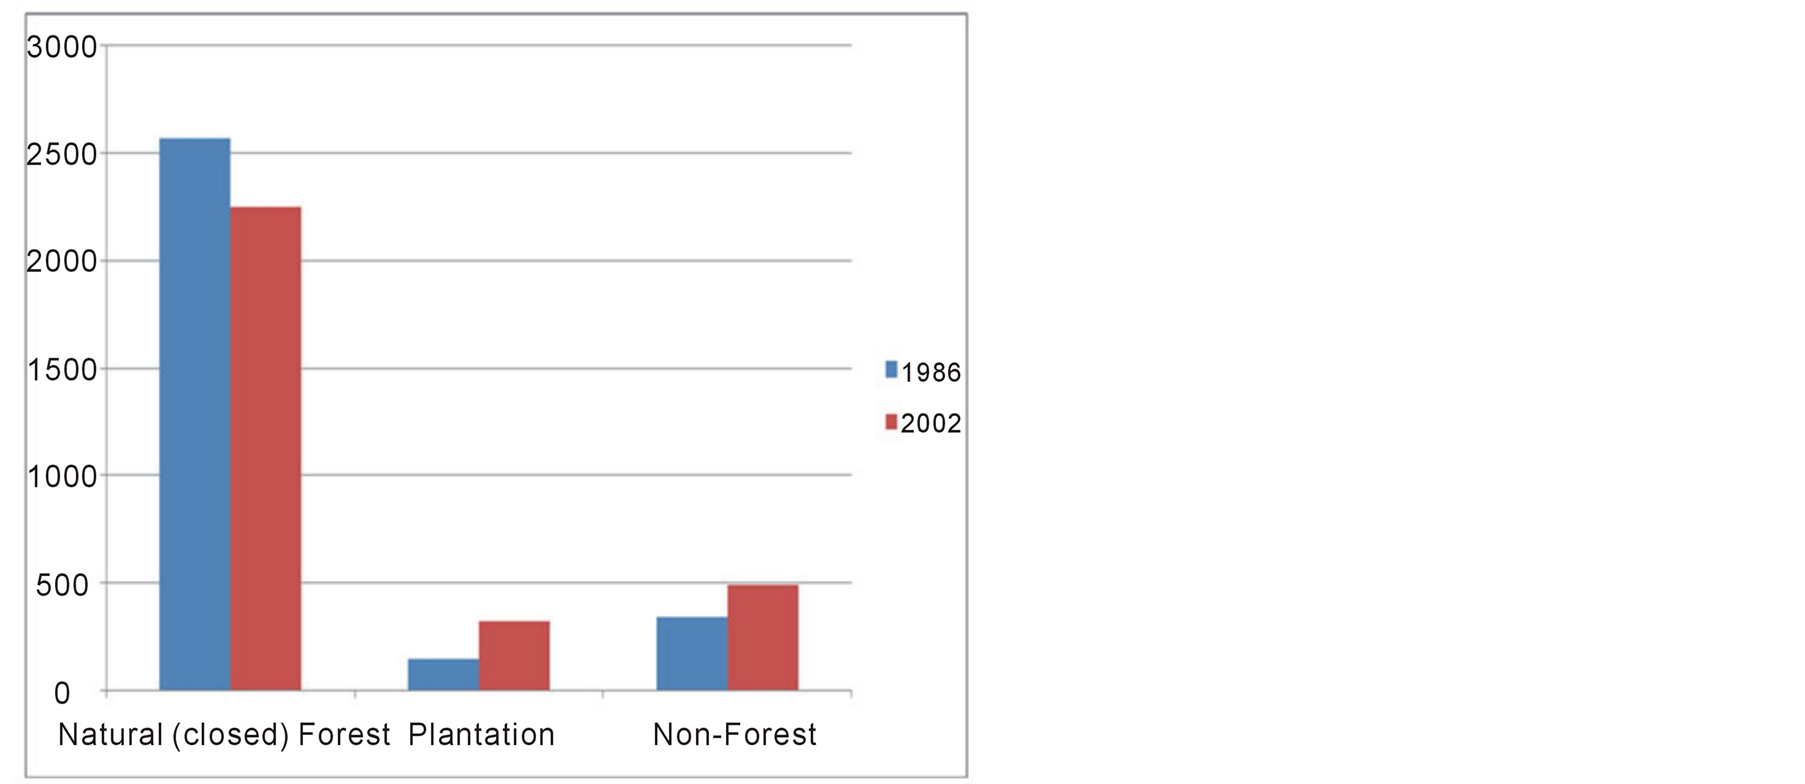
Figure 3. Amount of land cover classes in Omo-Shasha-Oluwa Forest Reserve 1986 and 2002 (sq. km).
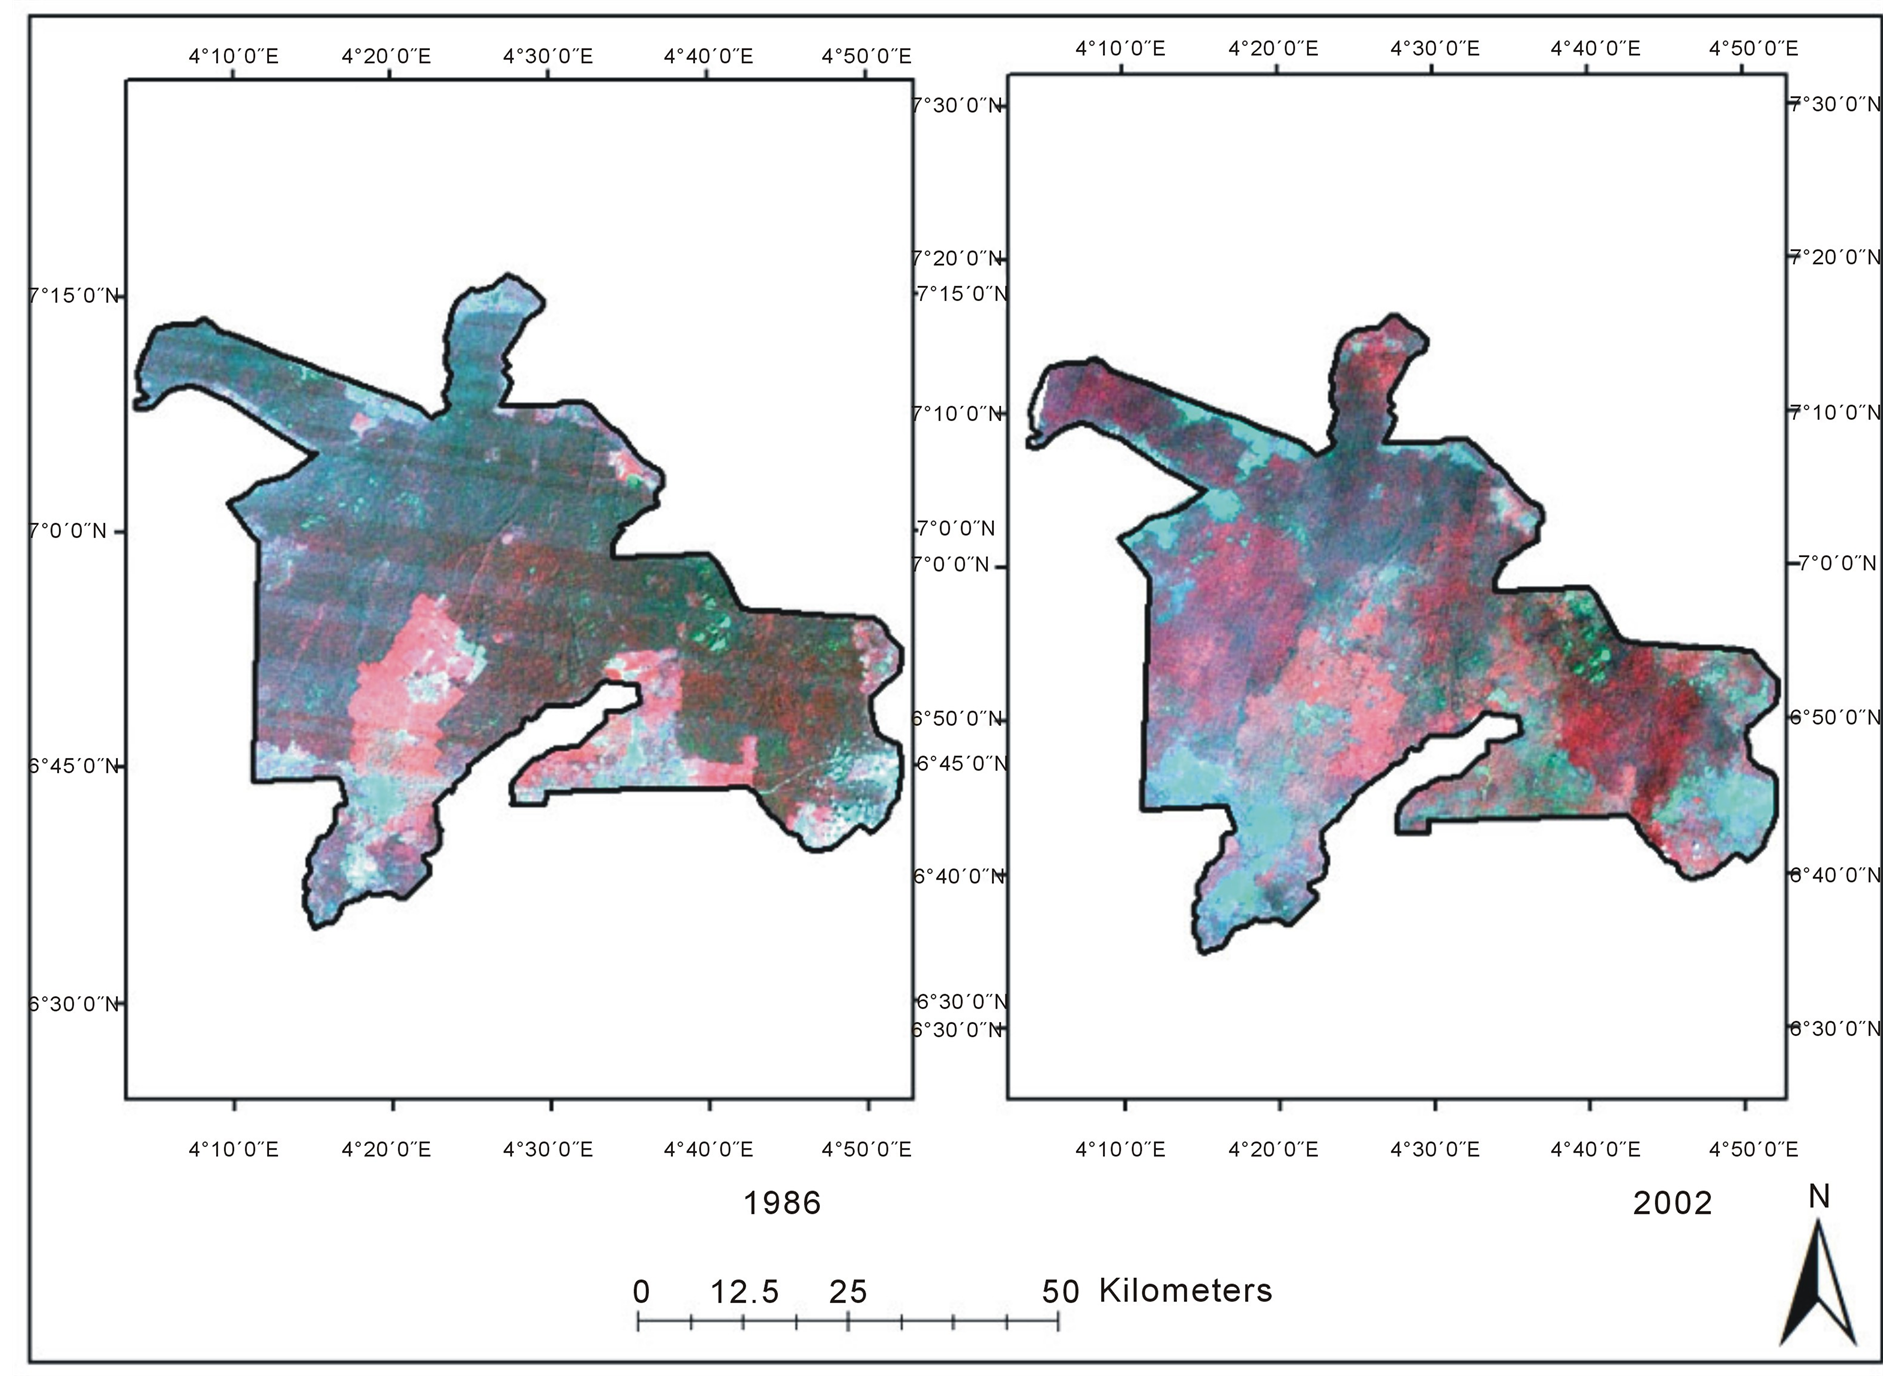
Figure 4. Landsat TM (1986) and Landsat ETM+ (2002) images of the study area.
plantation mainly of Gmelina arborea, which was introduced since the 1920s. The natural forest declined from about 2569 sq. km in 1986 about 2253 sq. km by 2002. Much of the changes took place in the Oluwa and Omo sections of the study area. One important qualitative change is the conversion of natural forest-to-forest plantations; however, these changes may have implications for biological diversity as well as the future productivity and use of the forest [33] . Previous studies in the Oluwa and Omo forest reserves areas revealed large-scale conversion of the original natural forest to monoculture plantations of fast-growing exotic tree species Gmelina arborea in a programme assisted by loans from the World Bank and the African Development Bank [34] . The plantation increased by 122% between 1986 and 2002. It was estimated that as of 1996, about 184 sq. km (89% of total plantations) and 245 sq. km (91% of total plantations) of Gmelina have been established in Oluwa and Omo, respectively [35] . From the result of this study it can be seen that the Gmelina arborea plantation expanded from about 145 sq. km in 1986 to 322 sq. km in 2002 (i.e. 122% increase). Other studies revealed that maximum mean annual volume increment (MAIv) in a natural tropical forest in Nigeria is 5 m3∙ha−1∙year−1, while that of a Gmelina arborea (exotic species) plantation is 51 m3∙ha−1∙year−1 [36] .
It can be seen that there were conscious efforts to extent the plantation area for the planting of exotic, fast growing trees species like Gmelina arborea [35] . A large part of the reserve, which was a good repository of plant and animal species, was dereserved for the establishment of monoculture plantations. Among the factors responsible for the increasing trend of global forest plantation estate, their ability to produce high amount of biomass within a relatively short period of time and their fast growth rate are the most notable. Forest plantations such as Gmelina possesses the capacity of producing between 3 and 10 times greater commercial biomass (timber) per ha than natural forests [37] . Over the years, Gmelina has emerged as the dominant plantation species in Oluwa and Omo forest reserves [38] . However, about 73 sq. km of the plantation areas in 1986 changed to forest in 2002 probably because of secondary regrowth of the forest species after removal of plantation trees. The area covered by non-forest (mostly bare and logged area) also increased by some 5% from 341 km2 in 1986
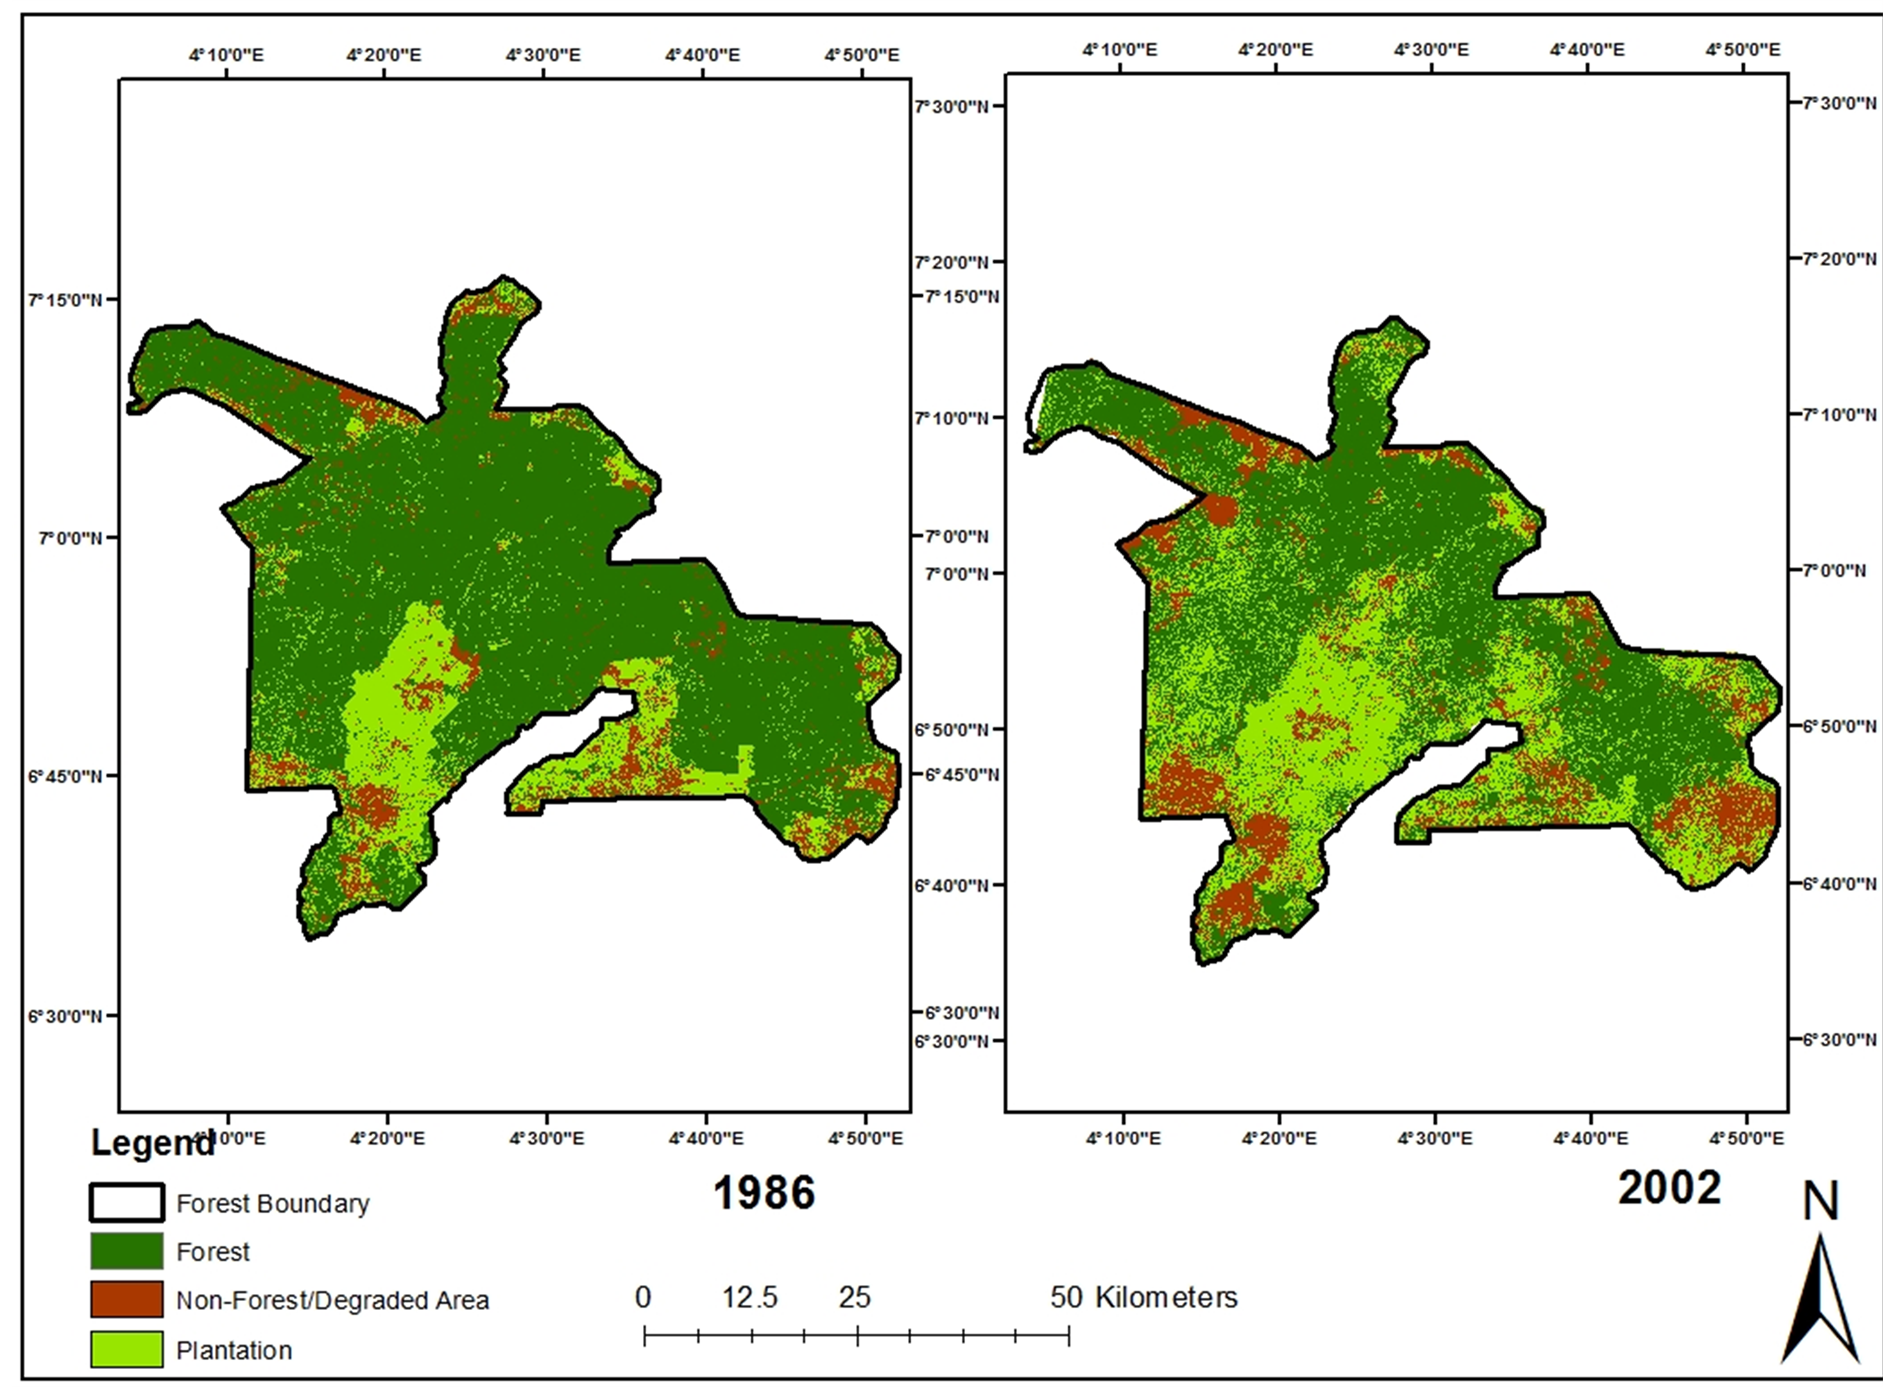
Figure 5. Classified images of 1986 and 2002 showing the land cover classes.
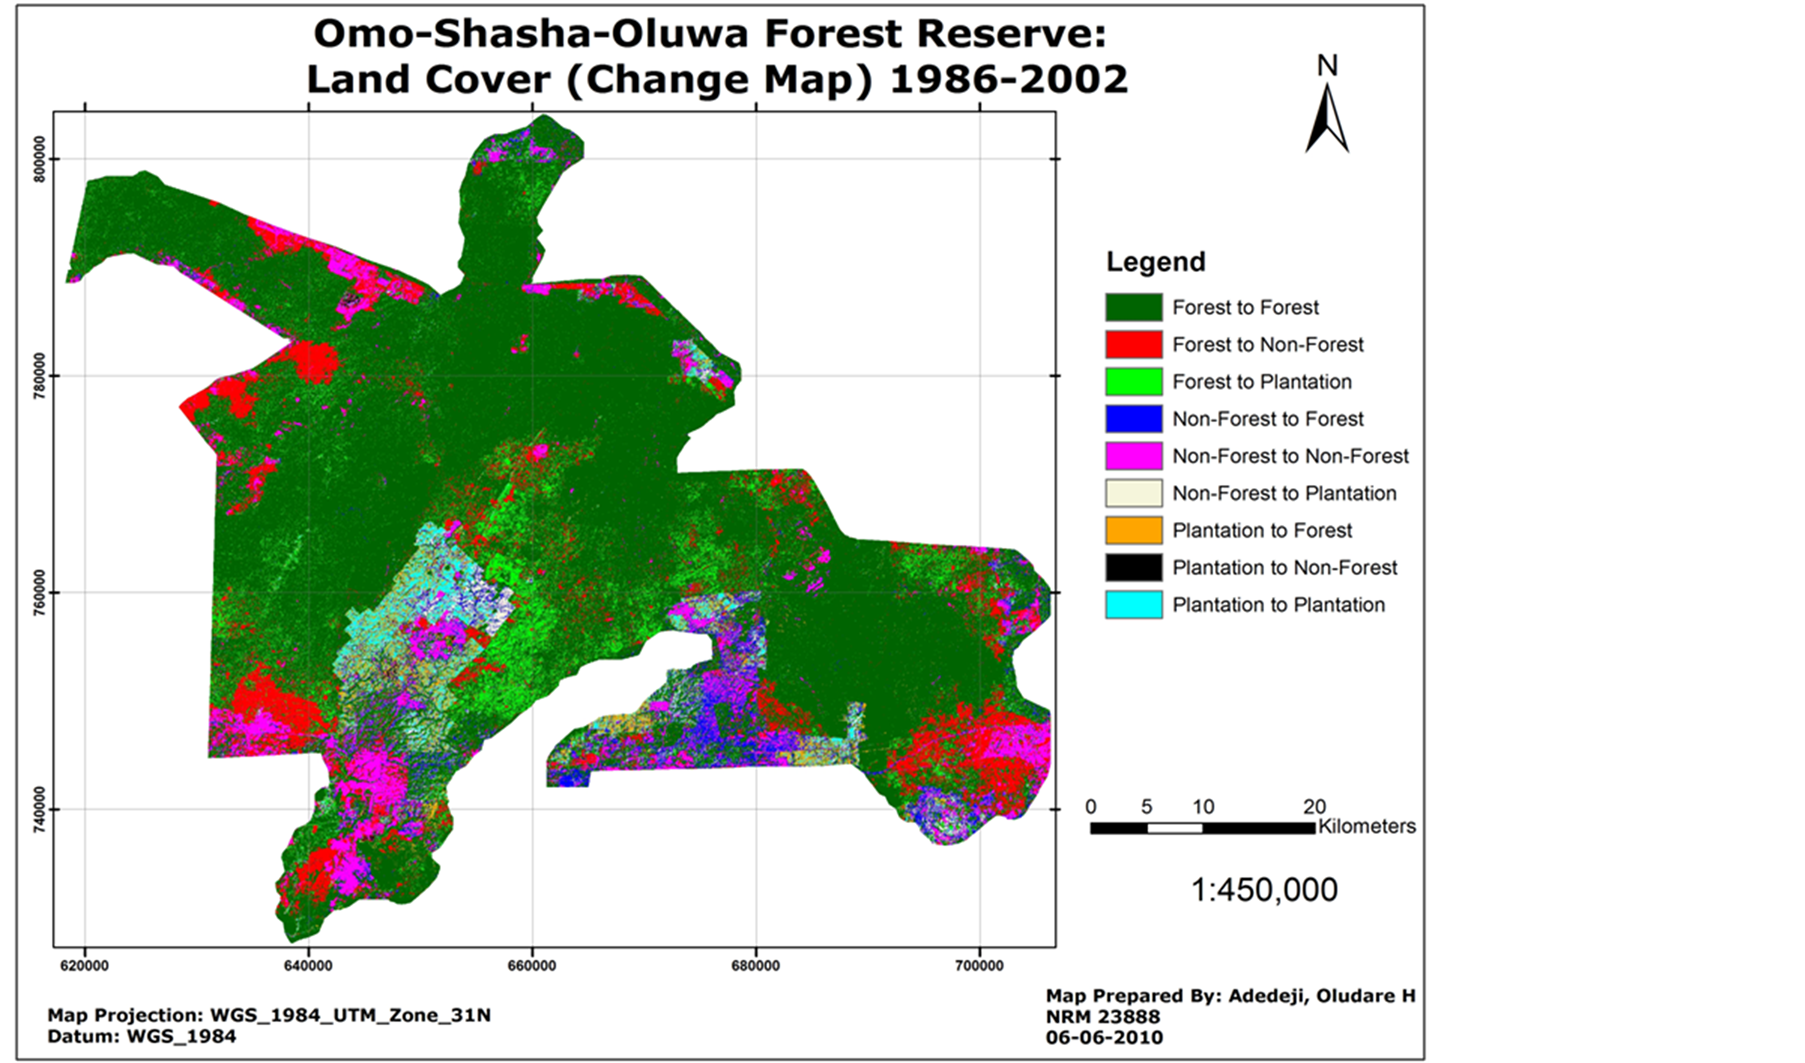
Figure 6. Land cover change map of Omo-Shasha-Oluwa Forest Reserve.

Table 1. Land cover changes of Omo-Shasha-Oluwa forest Reserve (1986 and 2002) (From-To).
Note: No changes are highlighted in bold, while the others are changes.
Table 2. Direction of changes of Omo-Shasha-Oluwa Forest Reserve (1986 and 2002).
Note: + = Increase; − = decrease.
to about 490 km2 by 2002 as a result of cutting down of the natural forest and even the plantation trees. Although the analysis of land cover suggests that more than half of Ago-Owu part of the reserve is still forested, it was found out that this forest is highly fragmented [12] . There was a progressive reduction in the forest cover in recent years in the Omo-Shasha-Oluwa Forest Reserve. In a similar study carried out in the study area in 2008, Oates et al. [12] estimated total area of remaining natural forest in the reserves to be 1125 km2 (about 112,500 hectares) which is just about 40% of the reserve area. Although there was a general increase in the size of the plantation, some parts of the plantation have been degraded due to cutting of the Gmelina arborea trees for industrial wood products because about 12 sq. km of the plantation changed to non-forest between 1986 and 2002. Land cover conversions have potential consequences such as changes in the soil conditions, and the geomorphology of the area, increase runoff and sedimentation of the river system [39] [40] . Logging cause the degradation of the area in which road tracks constructed to transport the logged wood expose the land and lead to accelerated soil erosion. A recent occurrence in the area is the illegal conversion of some plots in the reserve into cocoa plantation and production of food crops like cassava, which has far-reaching implication on the forest conservation policy.
5. Conclusions
Using the Landsat images of 1986 and 2002, the analysis revealed that land cover in the Omo-Shasha-Oluwa Forest Reserve has changed over the years. Three categories of land cover in the area are natural forest, plantation (Gmelina arborea) and non-forest. These land cover categories were identified and mapped for the period captured by the images. The results showed that the forest decreased by about 12%, while Gmelina arborea plantation expanded from about 145 sq. km in 1986 to 322 sq. km in 2002 (i.e. 122% increase). Conversion of the natural forest to plantation was a result of the slow regeneration habit of natural forest, fear of its total disappearance and the determination of the forestry subsector to meet the increasing demand for wood. More areas were left bare after the removal of the timber thus exposing them to agents of climate. The results of this study profile and highlight the land cover change dynamics in the Omo-Shasha-Oluwa Forest Reserve, Nigeria. It shows the need to promote the protection of existing natural environments as much as possible and ensure sustainable use of resources. Based on the trend of land cover changes detected in this study, there is the need to discourage the conversion of natural forest into plantations of fast growing exotic species such as Gmelina arborea because monoculture plantation cannot mimic the natural forest and do not give room for biodiversity which is important to natural resource management.
Forest policy makers should therefore, intensify the management of tropical natural forest by controlling the intensity of tree harvesting, improving logging practice and stopping illegal felling and thus reducing the damage to rainforest structure and biodiversity. Renewed efforts at managing the remaining tropical rainforests in the area should be encouraged by having important and up-to-date land use/land cover information for management and planning of land resources. Specific forestry and environmental laws and regulations that significantly address landscape changes in reserved and protected areas should be enforced to reduce activities that negatively affect the forest reserves. Developing a wider and more integrated GIS system of the forest and other land resources in the country is crucial for the planners, governmental authorities and other decision makers for different kinds of planning and management activities. Remote Sensing and GIS are versatile techniques that can be applied as effective measure to generate data and information for sustainable development. This is more so in the face of rapid resource depletion such as the forests. Therefore, we need to prudently manage these delicate resources with proper planning and sustainable forest resource management. Efforts should be made to develop capacity of building in the application of RS and GIS tools and methods for forest inventory and mapping and monitor changes of forest land occupation overtime.
Acknowledgements
The authors wish to thank several contributors, in particular, Odufuwa Bashir for reading through the manuscript and making useful contributions. We appreciate the contributions of Drs. Eduard Westinga and Dr. Michael Weir of ITC, the Netherlands for their great support and knowledge shared.
References
- Ringrose, S., Vanderpost, C. and Maheson, W. (1997) Use of Image Processing and GIS Technique to Determine the Extent and Possible Causes of Land Management/Fenceline Induced Degradation Problems in The Okavango Area, Northern Botswana. International Journal of Remote Sensing, 18, 2337-2364.
- Jensen, J.R. (2000) Remote Sensing of the Environment: An Earth Resource Perspective. Prentice Hall, Saddle River.
- Zhou, Q., Li, B. and Kurban, A. (2008) Trajectory Analysis of Land Cover Change in Arid Environment of China. International Journal of Remote Sensing, 29, 1093-1107.
- Fichera, C.R., Modica, G. and Pollino, M. (2012) Land Cover Classification and Change-Detection Analysis Using Multi-Temporal Remote Sensed Imagery and Landscape Metrics. European Journal of Remote Sensing, 45, 1-18.
- Skole, D.L. (1994) Data on Global Land Cover Change: Acquisition, Assessment and Analysis. In: Turner II, W.B., Ed., Changes in Land Use and Land Cover: A Global Perspective, Cambridge University Press, Cambridge, 437-471.
- Skidmore, A.K. (2002) Land Use and Land Cover. Marcel Dekker, Inc., New York.
- Aspinall, R. (2006) Editorial. Journal of Land Use Science, 1-4.
- Phat, N.K., Knorr, W. and Kim, S. (2004) Appropriate Measures for Conservation of Terrestrial Carbon Stocks— Analysis of Trends of Forest Management in Southeast Asia. Forest Ecology and Management, 191, 283-299. http://dx.doi.org/10.1086/261763
- Cai, W.W., Song, J.L., Wang, J.D. and Xiao, Z.Q. (2011) High Spatialand Temporal-Resolution NDVI Produced by the Assimilation of MODIS and HJ-1 Data. Canadian Journal of Remote Sensing, 37, 612-327.
- Weng, Q. (2002) Land Use Change Analysis in the Zhujiang Delta of China Using Satellite Remote Sensing, GIS and Stochastic Modelling. Journal of Environmental Management, 64, 273-284. http://dx.doi.org/10.1006/jema.2001.0509
- Singh, N. and Kumar, J. (2012) Urban Growth and Its Impact on Cityscape: A Geospatial Analysis of Rohtak City, India. Journal of Geographic Information System, 4, 12-19. http://dx.doi.org/10.4236/jgis.2012.41002
- Oates, J.F., Ikemeh, R.A., Ogunsetan, A. and Bergl, R.A. (2008) A Survey of Rain Forests in Ogun, Ondo and Osun States in Southwestern Nigeria to Assess Options for Their Sustainable Conservation. Nigerian Conservation Foundation, Lagos.
- FAO (1997) State of the World’s Forests, 1997. Food and Agriculture Organization of the United Nations, Rome. http://www.fao.org/forestry
- Al-Bakri, J.T., Salahat, M., Suleiman, A., Suifan, M., Hamdan, M.R., Khresat, S. and Kandakji, T. (2013) Impact of Climate and Land Use Changes on Water and Food Security in Jordan: Implications for Transcending “The Tragedy of the Commons”. Sustainability, 5, 724-748. http://dx.doi.org/10.3390/su5020724
- Brooks, A.M., Furse, M.T. and Fuller, R.M. (Eds.) (2000) An Assessment of the Land Cover Map of Great Britain with Headwater Streams Catchments of Four Main River Systems in England and Wales. Wiley and Sons, Chichester.
- Wang, L., Chen, J., Gong, P., Shimazaki, H. and Tamura, M. (2009) Land Cover Change Detection with a Cross-Correlogram Spectral Matching Algorithm. International Journal of Remote Sensing, 30, 3259-3273. http://dx.doi.org/10.1080/01431160802562164
- Chen, Z.H. and Wang, J.F. (2010) Land Use and Land Cover Change Detection Using Satellite Remote Sensing Techniques in the Mountainous Three Gorges Area, China. International Journal of Remote Sensing, 31, 1519-1542. http://dx.doi.org/10.1080/01431160903475381
- Mar?al, A.R.S., Borges, J.S., Gomes, J.A. and Da Costa, J.F.P. (2005) Land Cover Update by Supervised Classification of Segmented ASTER Images. International Journal of Remote Sensing, 26, 1347-1362. http://dx.doi.org/10.1080/01431160412331291233�
- Lillesand, T., Kiefer, R. and Chipman, J. (2003) Remote Sensing and Image Interpretation. 5th Edition, Wiley, New York, 784.
- Warner, T.A. (2011) Kernel-Based Texture in Remote Sensing Image Classification. Geography Compass, 5, 781-798. http://dx.doi.org/10.1111/j.1749-8198.2011.00451.x
- Quan, B., Xiao, Z., R?mkens, M., Bai, Y. and Lei, S. (2013) Spatiotemporal Urban Land Use Changes in the Changzhutan Region of Hunan Province in China. Journal of Geographic Information System, 5, 136-147. http://dx.doi.org/10.4236/jgis.2013.52014�
- Franklin, J., Woodcock, C.E. and Warbington, R. (2000) Digital Vegetation Maps of Forest Lands in California: Integrating Satellite Imagery, GIS Modeling, and Field Data in Support of Resource Management. Photogrammetric Engineering and Remote Sensing, 66, 1209-1217.
- Coppin, P., Jonckheere, I., Nackaerts, K., Muys, B. and Lambin, E. (2004) Digital Change Detection Methods in Ecosystem Monitoring: A Review. International Journal of Remote Sensing, 25, 1565-1596. http://dx.doi.org/10.1080/0143116031000101675
- Fichera, C.R., Modica, G. and Pollino, M. (2012) Land Cover Classification and Change-Detection Analysis Using Multi-Temporal Remote Sensed Imagery and Landscape Metrics. European Journal of Remote Sensing, 45, 1-18. http://dx.doi.org/10.5721/EuJRS20124501
- Okali, D.U.U. and Ola-Adams, B.A. (1987) Tree Population Changes in Treated Rainforest at Omo Forest Reserve, South-Western Nigeria. Journal of Tropical Ecology, 3, 291-313. http://dx.doi.org/10.1017/S0266467400002297
- Foody, G.M. (2002) Status of Land Cover Classification Accuracy Assessment. Remote Sensing of Environment, 80, 185-201. http://dx.doi.org/10.1016/S0034-4257(01)00295-4
- Otuke, J.R. and Blaschke, T. (2009) Land Cover Change Assessment Using Decision Trees, Support Vector Machines and Maximum Likelihood Classification Algorithms. International Journal of Applied Earth Observation and Geoinformation, 12, S27-S31.
- ERDAS (2003) Erdas Field Guide. 7th Edition, Leica Geosystems, GIS and Mapping LLC, Atlanta.
- Congalton, R.G. (1991) A Review of Assessing the Accuracy of Classifications of Remotely Sensed Data. Remote Sensing of Environment, 37, 35-46.
- Whithcomb, J., Moghaddam, M., McDonald, K., Kellndorfer, J. and Podest, E. (2009) Mapping Vegetated Wetlands of Alaska Using L-Band Radar Satellite Imagery. Canadian Journal of Remote Sensing, 35, 54-72. http://dx.doi.org/10.5589/m08-080
- Tso, B. and Mather, M.P. (2001) Classification Methods for Remotely Sensed Data. Taylor and Francis, London.
- Congalton, R.G. and Green, K. (2009) Assessing the Accuracy of Remotely Sensed Data: Principles and Practices. CRC Press Taylor and Francis Group, Boca Raton.
- FAO (2005) Global Forest Resources Assessment 2005. Progress towards Sustainable Forest Management. Rome, FAO Forestry Paper 147.
- Isichei, A.O. (1995) Omo Biosphere Reserve, Current Status, Utilization of Biological Resources and Sustainable Management (Nigeria). Working Papers of the South-South Cooperation Programme on Environmentally Sound Socio-Economic Development in the Humid Tropics. UNESCO, Paris.
- Adekunle, V.A.J. (2006) Conservation of Tree Species Diversity in Tropical Rainforest Ecosystem of South-West, Nigeria. Journal of Tropical Forest Science, 18, 91-101.
- Onyekwelu, J.C., Mosandl, R. and Stimm, B. (2006) Productivity, Site Evaluation and State of Nutrition of Gmelina arborea Plantations in Oluwa and Omo Forest Reserves, Nigeria. Forest Ecology and Management, 229, 214-227. http://dx.doi.org/10.1016/j.foreco.2006.04.002
- Evans, J. and Turnbull, J.W. (2004) Plantation Forestry in the Tropics. 3rd Edition, Oxford University Press, London.
- Ojo, L.O. (2004) The Fate of a Tropical Rainforest in Nigeria: Abeku Sector of Omo Forest Reserve. Global Nest: The International Journal, 6, 116-130.
- Bradley, B.A. and O’Sullivan, M.T. (2011) Assessing the Short-Term Impacts of Changing Grazing Regime at the Landscape Scale with Remote Sensing. International Journal of Remote Sensing, 32, 5797-5813. http://dx.doi.org/10.1080/01431161.2010.507680
- Warner, T.A., Almutairi, A. and Lee, J.Y. (2009) Remote Sensing and Land Cover Change. In: Warner, T.A., Nellis, M.D. and Foody, G.M., Eds., The SAGE Handbook of Remote Sensing, SAGE, London, 459-472. http://dx.doi.org/10.4135/9780857021052.n33
NOTES

*Corresponding author.