Health
Vol.6 No.15(2014), Article
ID:48705,8
pages
DOI:10.4236/health.2014.615230
Patient Perceptions of Current Disease Control in Poorly Controlled Diabetes
Anjali Gopalan1,2,3, Haley Moss4, Yuanyuan Tao2, Jingsan Zhu2, Kevin Volpp1,2
1The Philadelphia VA Medical Center, Philadelphia, USA
2The Perelman School of Medicine, The University of Pennsylvania, Philadelphia, USA
3The Robert Wood Johnson Clinical Scholars Program, The University of Pennsylvania, Philadelphia, USA
4New York University School of Medicine, New York, USA
Email: agopalan@upenn.edu
Copyright © 2014 by authors and Scientific Research Publishing Inc.
This work is licensed under the Creative Commons Attribution International License (CC BY).
http://creativecommons.org/licenses/by/4.0/


Received 9 June 2014; revised 26 July 2014; accepted 7 August 2014
ABSTRACT
Background: Studies suggest that patients do not understand the hemoglobin A1c value (A1c). However, clinicians may communicate information about glycemic control in other ways. Given this, this study evaluates patients’ understanding of current diabetes control, independent of the A1c, and the factors affecting this understanding. Method: Cross-sectional survey of patients with poorly controlled diabetes seen in urban clinics in fall of 2010. Results: 177 people completed the survey. 73.5% were women, 83.0% were African-American and the average age was 56.5 years. 80.2% of respondents reported having had diabetes for at least five years. 39% reported past participation in a diabetes education course. Average A1c was 9.9(S.D. 1.7)%; no differences were noted based on income, education, disease duration, or complication history. 23.7% described their disease control as “good” or “excellent” in spite of an average A1c of 9.5% (1.2). Notably, most of this group reported diabetes for over five years and did not differ in history of diabetes-related complications or educational attainment compared to those with more accurate perceptions of control. Conclusion: The high proportion of participants who reported “good” or “excellent” control in spite of mean A1c greater than 9.5% raises serious questions about the effectiveness of current communication methods for patients with poorly controlled diabetes.
Keywords:Diabetes, Hemoglobin A1c, Patient Education, Patient-Provider Communication

1. Introduction
Diabetes management, arguably more than many other chronic diseases, requires a high level of patient understanding and comprehension. Patients must master a variety of complex skills, including medication dosing, insulin adjustments, and blood sugar tracking to manage their disease on a daily basis. Achieving ideal glycemic control relies to some degree on health literacy. Unfortunately poor health literacy is highly prevalent amongst individuals with diabetes and has been shown to be associated with worse glycemic control and increased diabetes-related complications [1] . Previous work has also suggested that better understanding of disease management targets, specifically accurate understanding of hemoglobin A1c (A1c) value, is associated with better glycemic control [2] [3] . Such studies have estimated that only 25% of patients with diabetes have an accurate understanding of the A1c value [2] [4] .
However, the A1c value may be only one type of feedback provided by clinicians about glycemic control and thus studies that focus specifically on understanding of the A1c as a marker of understanding may underestimate actual patient knowledge and understanding [5] . In this study, we examine general perceptions of glycemic control, independent of knowledge of the A1c, amongst patients with poorly controlled diabetes, and the demographic and other factors associated with low levels of understanding.
2. Method
Following approval from the study site institution’s institutional review board, we conducted telephone surveys as part of baseline data collection for a randomized-controlled trial. The randomized-controlled trial tested the use of alternative information formats to the A1c in providing feedback regarding glycemic control to patients with diabetes [6] . For the study, we enrolled individuals seen at three internal medicine practices at an urban academic medical center that predominantly serve an African-American population. Potentially eligible patients were identified in the electronic medical record based on a history of poorly controlled diabetes defined by an A1c value of greater than 8% within six weeks of enrollment. We excluded anyone who reported being pregnant or who had a documented cognitive impairment. Informed consent was obtained from all individuals prior to survey administration.
The survey contained several categories of questions including demographic information (age, sex, race, level of education, and individual annual income); and personal diabetes history (time since diagnosis, current diabetes treatment regimen and any history of diabetes-related complications). Given the contention that patients’ health literacy mediates accurate understanding of diabetes control and related health outcomes [7] , we assessed patient numeracy, an important component of health literacy needed to comprehend numeric values like the A1c. For this assessment, we used the Schwartz numeracy assessment tool, which is comprised of three questions assessing participant ability to handle basic numerical scenarios (example “Imagine that we flip a fair coin 1000 times. What is your best guess about how many times the coin would come up heads in 1000 flips?”) [8] . The numeracy score was the number of questions that participants were able to answer correctly, so the minimum score was zero and the maximum score was three. Participants were also screened for depression via the Whooley Depression Screening Tool [9] . We assessed participants’ understanding of disease severity and disease management goals, including perceptions of disease severity, assessments of their current disease control and their level of concern for future disease related complications using a 5-point Likert scale with response items ranging from “excellent” to “terrible” and “not at all” to “extremely”.
This study was funded by the CMU Penn Roybal Center and the funding source played no role in the study’s design, conduct, or reporting.
Analysis
Descriptive statistics were used to describe the demographic and diabetes-related characteristics of the survey participants. Chi-squared analysis (or the Fisher’s exact test, when appropriate) was used to assess the relationship of these characteristics with participants’ enrollment A1c values. Given our aim to examine the accuracy of patients’ understanding of their current diabetes control and future diabetes-associated risk, the primary outcomes examined were the relationships between subjects’ self-reported perceptions of their disease control and disease-associated complication risk and their measured A1c values at time of study enrollment. We focused our comparisons on those participants who were in the top two categories with those in the bottom two categories on the 5-point scale for self-described level of control and personal complication risk. For example, we compared those describing their control as ‘excellent” or “good” to those describing their current control as “poor” or “terrible”. Comparisons were made using ANOVA analysis and chi-squared analysis as appropriate. We hypothesized a significant inverse relationship between self-perceptions of glycemic control and A1c, with A1c for those who reported “poor” or “terrible” control being higher than for those who reported “good” or “excellent” control. In regards to perceptions of risk for future diabetes-related complications, we hypothesized a significant positive relationship between A1c and reported risk, with those who reported having the lowest level of risk having the lowest A1c values. In the examination of the relationship between demographic factors such as education level and income and diabetes-related factors such as length of disease or a history of diabetes-related complications, we used proportional odds models to predict the effect of these baseline participant characteristics on two main outcomes, perception of current diabetes control and perception of future risk for diabetes-related complications. This statistical approach was done since the possible responses for these two variables were ordered categories (e.g. “terrible”/”poor” to “good”/”excellent”) [10] .
3. Results
Between May 2010 and November 2010, 177 participants were enrolled in the study (Table 1). 73.5% of participants were women, 83.0% were African-American and the average age was 56.5 years. The population was relatively low income, with 52.4% reporting incomes less than $20,000 per year and only 13.1% had self-reported annual incomes greater than $50,000 per year. The majority (80.2%) reported having had diabetes for at least five years and 39% reported having participated in a formal diabetes education class. 53.1% of enrolled participants had a positive depression screen (answering yes to at least one of the two questions of the Whooley screening tool). About 50% of the sample reported getting “mostly C’s” or “mostly D’s and F’s” while in school. The numeracy of enrolled participants was quite low, with 90% of respondents answering none or only one of the Schwartz assessment tool questions correctly. Only 1 participant of the 177 answered all three numeracy questions correctly.
The average A1c of enrolled participants at baseline was 9.9(1.7)% (Table 1). There was no statistically significant difference in A1c values at enrollment based on gender, with the average enrollment A1c for enrolled men being 10.1(1.7)% compared to 9.8(1.7)% for women (p = 0.3). We noted no difference in enrollment A1c’s based on ethnicity with White participants having an average enrollment A1c of 9.5(1.4)% compared with 10(1.8)% for African-Americans and 9.4(1)% for others (p = 0.37). Lower income and lower education level were not associated with higher enrollment A1c values (p = 0.13 and p = 0.58, respectively). A self-reported personal history of disease-related complications was not associated with participants’ A1c values at the time of enrollment, with those reporting a history of disease-related complication having an average A1c of 10.1(1.7)% compared to 9.7(1.7)% for those who denied a history of prior complication (p = 0.07). Time since diabetes diagnosis and completion of a diabetes education course were also not associated with participant A1c values at enrollment (p = 0.19 and p = 0.3, respectively).
Glycemic control among those who described their current level of control as “poor” or “terrible” was in fact suboptimal, as this group had a mean hemoglobin A1c of 10.2(1.8)%. Among participants who deemed their current level of control as “moderate” and those reporting “good” or “excellent” control, actual control was slightly better but remained clinically far from optimal, as the mean A1c value within these group were 9.8(1.8)% and 9.5(1.2)%, respectively (p = 0.02) for difference between “poor/terrible” and “good/excellent” groups (Table 2 and Figure 1).
We compared the characteristics of participants with differing perceptions regarding current control, i.e., the 24% reporting “good” or “excellent” control versus the 37% reporting “poor” or “terrible” control (Table 2). Participant ethnicity, income, and educational level did not correlate with positive or negative perceptions of current control. There was no difference in rates of having taken a diabetes education course between the two groups (33.3% vs. 44.6%, p = 0.25). Participants who described their current diabetes control as “poor” or “terrible” were more likely to have a positive depression screen than their counterparts who thought their control was good or excellent (50% vs. 70.8%, p = 0.03) (Table 2). Notably, there was no relationship between a positive depression screen and a history of disease-related complications or a participant’s A1c value at the time of study enrollment (Table 1). Reported grades in school were not associated with self-described glycemic control (p = 0.7).
Regarding the relationship between reported perceptions of future diabetes-related complication risk and enrollment A1c value, the 63.6% of enrolled participants who reported being “very” or “extremely” concerned about complications had an average A1c of 10.0(1.6)%, slightly higher, though arguably not clinically significant

Table 1. Participant characteristics and baseline hemoglobin A1c values (SD).
ap-value is for the difference between A1c values between the categories for the corresponding participant characteristic.
Table 2. Participant characteristics based on perception of current level of diabetes control (SD).
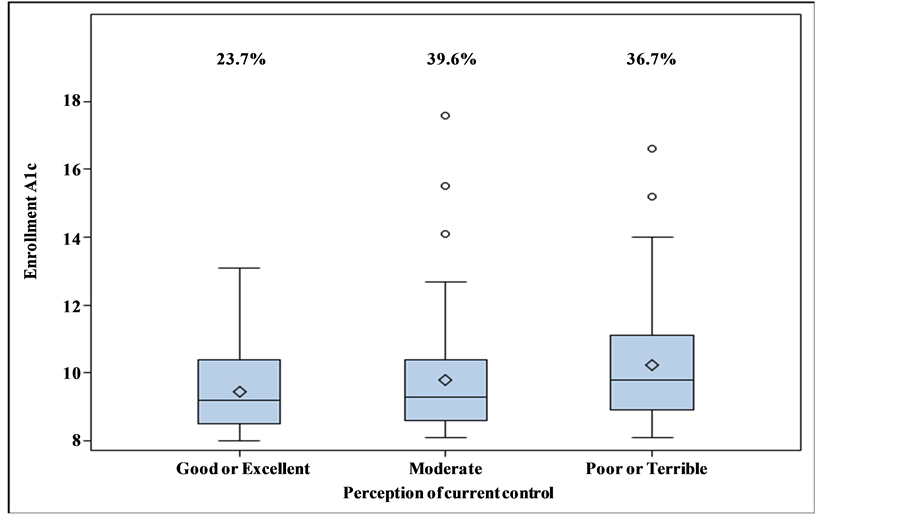
Figure 1. Participant perceptions of current diabetes control and the relationship of this perception with enrollment hemoglobin A1c values. Percentages indicate the percentage of participants reporting each of the levels of current diabetes control on the x-axis below (e.g., 23.7% described their current diabetes control as “Good” or “Excellent”).
than the 21% of participants reporting little to no concern regarding future complications who had an average A1c of 9.3(1.2)% (p = 0.03 for difference, Figure 2). High versus low concern regarding future disease-related complications was not associated with education, income or a reported history of complications. Similar to those participants with more negative perceptions of current diabetes control, higher concern regarding future complications was associated with a positive depression screen (p = 0.03). We noted a correlation between participants’ reported perceptions of current control and their perceptions of future diabetes-related complication risk, with those with more positive impressions of current diabetes control being less concerned regarding future complication risk (p < 0.0001), as would be appropriate.
We could not examine the degree to which numeracy scores were associated with poor glycemic control and comprehension of disease because numeracy scores in this population were almost uniformly low.
4. Discussion
In this population of patients with poorly controlled diabetes, a significant mismatch between reality and perception exists. The most concerning findings are that 23.7% of patients believe they have “good” or “excellent” control of their diabetes despite an average A1c of 9.5(1.2)% and that 39.6% of the population describes their control as “moderate” in spite of an average A1c of 9.8(1.8)%.
It is important to note that while prior studies have already shown that most patients do not understand the A1c value, the poor glycemic control noted in our study cannot simply be attributed to poor understanding of the A1c value as we assessed general understanding of control and not specific understanding of the A1c. The majority (71.4%) of these patients mistakenly describing their control as “good” or “excellent” reported having diabetes for over ten years, suggesting that the feedback they have been getting on glycemic control from their healthcare providers over many years has had little impact. The significant misunderstanding of how well blood sugars are controlled within this group cannot be attributed to a lower education level, worse school performance, lower rates of diabetes education courses, or more disease-related complications as these characteristics did not differ between those with opposite perceptions of their diabetes control within our sample. This suggests that some of the demographic and other factors that physicians may assume influence their patients understanding of current disease control may not, within a population of largely lower income African-American patients,
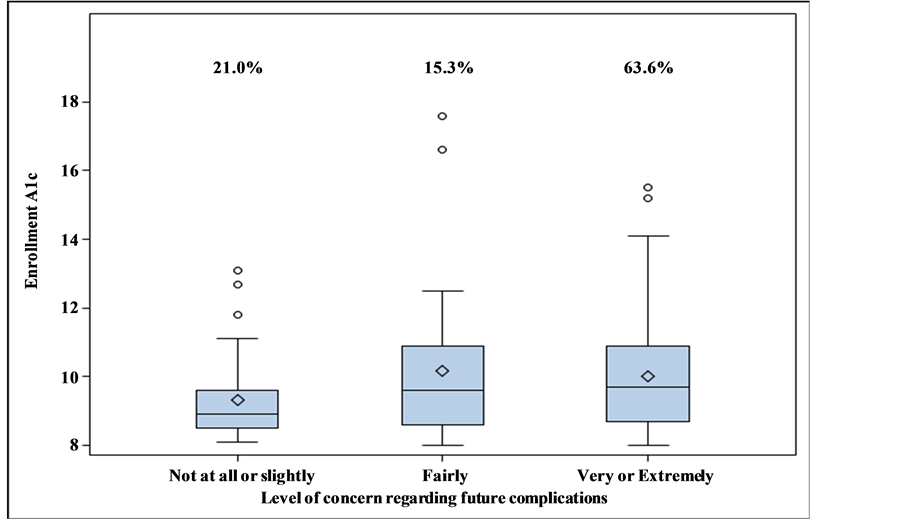
Figure 2. Participant level of concern about future diabetes-related complications and the relationship of this level of concern with enrollment hemoglobin A1c values. Percentages indicate the percentage of participants reporting each of the levels of concern on the x-axis below (e.g., 21% of participants reported being “not at all” of “slightly” concerned about future diabetes complications).
actually affect patients’ perceptions regarding their diabetes control. These low levels of understanding in this population suggest that the current approach to communicating feedback regarding diabetes control may need to be significantly augmented.
These findings can be viewed in light of other studies that suggest that patients for the most part do not accurately assess their current glycemic control or future disease-related risk [2] [4] . In a similar population of patients, the majority of African-American patients with diabetes were found to grossly underestimate their risk of developing disease-related complications in spite of poor glycemic control (mean A1c 8.7%) [11] . In contrast, a study by Heisler et al. did show a statistically significant association between patients’ self-assessments of diabetes care and actual glycemic control [12] . However, their study was not focused on patients with poorly controlled diabetes (average A1c’s in this population ranged from 7.3% to 8.3%) and their method of assessing of self-care focused on more concrete diabetes-related tasks that may be easier to appraise such as exercise, foot care, and urinalyses as compared to the more general impressions of control and future risk elicited in our study.
Approaches to improving communication between providers and patients regarding diabetes control could be helpful in improving patients’ understanding of glycemic control. One approach, the translating of medical information into laypeople’s terms, might have significant potential. A study in the British Medical Journal highlighted this possibility by comparing smoking cessation rates among smokers who received feedback on lung function in terms of either pulmonary function test results (FEV1) or in terms of “lung age” [13] . Patients given their “lung age” in place of their FEV1 value had significantly higher rates of smoking cessation at the end of the study (13.6% vs. 6.4%, p = 0.005). This may be thought of as a relevant exemplar for other clinical contexts in which feedback to patients is provided using medical terms that are poorly understood by patients. Work in other contexts, such as mandates for calorie labeling on restaurant menus, a “stop-light” food labeling system in hospital cafeterias, and the use of “sad” faces on the bills of energy customers with above average usage, have all suggested that information provision that is more intuitive can affect behavior more effectively than more standard information provision approaches [14] -[17] .
Our study has several limitations. First, the population was a demographically homogenous convenience sample, with the majority of enrolled participants being African-Americans, relatively low income, and female. This may limit the generalizability of the findings to other populations. Second, as mentioned the numeracy amongst the group was notably poor, making the findings relevant only to other low numeracy populations. Third, the questions used to assess perceptions of current control and future diabetes-related risk were written by the study team and not piloted prior to enrollment. Last, we elicited associations between perceptions and certain patient measures, such as depression and age, for which we cannot determine the direction of causality.
In summary, given the clear mismatch between many patients’ understanding of their glycemic control and their actual control, it seems the manner in which providers communicate information about glycemic control to patients with low numeracy levels and low incomes could be improved. We would encourage research that tests different ways of providing this information to patients along with measurement of how these methods improve patients’ understanding of their diabetes severity and impact subsequent glycemic control.
Acknowledgements
We would like to acknowledge the CMU Penn Roybal Center for their financial support. Penn CMU Roybal P30 Center Grant P30AG034546.
References
- Schillinger, D., Grumbach, K., Piette, J., Wang, F., Osmond, D. and Daher, C., et al. (2002) Association of Health Literacy with Diabetes Outcomes. JAMA: The Journal of the American Medical Association, 288, 475-482.
- Beard, E., Clark, M., Hurel, S. and Cooke, D. (2010) Do People with Diabetes Understand Their Clinical Marker of Long-Term Glycemic Control (HbA1c Levels) and Does This Predict Diabetes Self-Care Behaviours and HbA1c? Patient Education and Counseling, 80, 227-232. http://dx.doi.org/10.1016/j.pec.2009.11.008
- Berikai, P., Meyer, P.M., Kazlauskaite, R., Savoy, B., Kozik, K. and Fogelfeld, L. (2007) Gain in Patients’ Knowledge of Diabetes Management Targets Is Associated with Better Glycemic Control. Diabetes Care, 30, 1587-1589.
- Wang, S., Tikellis, G., Wong, N., Wong, T.Y. and Wang, J.J. (2008) Lack of Knowledge of Glycosylated Hemoglobin in Patients with Diabetic Retinopathy. Diabetes Research and Clinical Practice, 81, e15-e17.
- Levetan, C.S. (2002) Hemoglobin A1c: Need to Standardize the Term. [Consensus Development Conference]. Endocrine Practice, 8, 25-26. http://dx.doi.org/10.4158/EP.8.S1.25
- Gopalan, A., Tahirovic, E., Moss, H., Troxel, A.B., Zhu, J., Loewenstein, G. and Volpp, K.G. (2014) Translating the Hemoglobin A1C with More Easily Understood Feedback: A Randomized Controlled Trial. [Research Support, N.I.H., Extramural]. Journal of General Internal Medicine, 29, 996-1003.
- Schillinger, D., Barton, L., Karter, A., Wang, F. and Adler, N. (2006) Does Literacy Mediate the Relationship between Education and Health Outcomes? A Study of a Low-Income Population with Diabetes. Public Health Reports, 121, 245-254.
- Schwartz, L.M., Woloshin, S., Black, W.C. and Welch, H.G. (1997) The Role of Numeracy in Understanding the Benefit of Screening Mammography. Annals of Internal Medicine, 127, 966-972.
- Whooley, M.A., Avins, A.L., Miranda, J. and Browner, W.S. (1997) Case-Finding Instruments for Depression. Two Questions Are as Good as Many. Journal of General Internal Medicine, 12, 439-445.
- Brant, R. (1990) Assessing Proportionality in the Proportional Odds Model for Ordinal Logistic Regression. Biometrics, 46, 1171-1178. http://dx.doi.org/10.2307/2532457
- Calvin, D., Quinn, L., Dancy, B., Park, C., Fleming, S.G., Smith, E., et al. (2011) African Americans’ Perception of Risk for Diabetes Complications. The Diabetes Educator, 37, 689-698.
- Heisler, M., Smith, D., Hayward, R., Krein, S. and Kerr, E. (2003) How Well Do Patients’ Assessments of Their Diabetes Self-Management Correlate with Actual Glycemic Control and Receipt of Recommended Diabetes Services? Diabetes Care, 26, 738-743. http://dx.doi.org/10.2337/diacare.26.3.738
- Parkes, G., Greenhalgh, T., Griffin, M. and Dent, R. (2008) Effect on Smoking Quit Rate of Telling Patients Their Lung Age: The Step2quit Randomised Controlled Trial. BMJ, 336, 598-600.
- Downs, J., Loewenstein, G. and Wisdom, J. (2009) Strategies for Promoting Healthier Food Choices. American Economic Review: Papers and Proceedings, 99, 1-10. http://dx.doi.org/10.1257/aer.99.2.159
- Sonnenberg, L., Gelsomin, E., Levy, D.E., Riis, J., Barraclough, S. and Thorndike, A.N. (2013) A Traffic Light Food Labeling Intervention Increases Consumer Awareness of Health and Healthy Choices at the Point-of-Purchase. Preventive Medicine, 57, 253-257. http://dx.doi.org/10.1016/j.ypmed.2013.07.001
- Thorndike, A.N., Riis, J., Sonnenberg, L.M. and Levy, D.E. (2014) Traffic-Light Labels and Choice Architecture: Promoting Healthy Food Choices. American Journal of Preventive Medicine, 46, 143-149.http://dx.doi.org/10.1016/j.amepre.2013.10.002
- Kaufman, L. (2009) Utilities Turn Their Customers Green, with Envy. The New York Times Company, New York.