Materials Sciences and Applications
Vol.3 No.2(2012), Article ID:17258,4 pages DOI:10.4236/msa.2012.32017
Synthesis of Fluorite-Type Nanopowders by Citrate-Nitrate Auto-Combustion Process: A Systematic Approach
![]()
Naval Materials Research Laboratory, Ambernath, India.
Email: *luckymridula@gmail.com
Received December 9th, 2011; revised January 27th, 2012; accepted February 6th, 2012
Keywords: Combustion Synthesis; DSC-TGA; XRD; TEM
ABSTRACT
Citrate-nitrate autocombustion process is a promising synthesis route in the field of nanomaterials. This route involves many controlling parameters which ultimately affect properties of the products. In the present research work, the effect of concentration of fuel to that of metal nitrates has been studied in a systematic manner. The nature of exothermic reaction was analyzed with DSC-TGA and the powder properties were characterized by XRD, TEM and BET measurement. The properties of the powders have been explained with respect to fuel content, vigorousness of the exothermic reaction, combustion temperature and duration. The most vigorous reaction was found to occur for the composition with FER of 0.50 with the production of the smallest crystallite size of 9 nm.
1. Introduction
As the properties of nanomaterials (1 nm - 100 nm in size) differ from those of the same materials with micron-scale or mm-scale dimensions the scientists and technologists are very keen to explore their properties for advanced technological applications. Nanosized ceramic materials exhibit improved properties as compared to conventional bulk ceramic materials. Size reduction of solids is currently a hot topic in field of the research [1]. In this era of technological advancement, “nanoionics” is the field of potential interest because a high density of small grains and phase boundaries influences the electrical conduction of materials to a great extent. This field brings advances in many fields like lithium ion batteries, fuel cells, chemical sensors, etc.
A large part of scientists are engaged in finding out a suitable route for synthesizing nanomaterials. Combustion synthesis is an easy and convenient method for the preparation of a variety of advanced ceramics, catalysts and nanomaterials [2]. In this technique, based on the principles of the propellant chemistry [3], a thermally induced redox reaction takes place between an oxidant and a fuel. By combustion-based methods it is possible to produce monophasic nanopowders with homogeneous microstructure, at lower temperatures or shorter reaction times. By changing the type and amount of fuel in a fuel-oxidant mixture, various metastable phases also can be produced [4].
The parameters which affect the properties of the ultimate product are the type of organic fuel [4], the influence of the fuel content [5-8], the role of pH [9], the effect of various combustion aids [10] and inert salts [11], the effect of a dry combustion [12] or a wet combustion [13] and the influence of the ignition modality [14] or of the ignition temperature [15]. Those parameters have already been discussed in literatures. Nevertheless, a deep understanding of these parameters is remaining in dark because too many parameters were varied at a time [5-8].
The aim of this paper is to investigate the influence of fuel content, in the fuel-oxidant mixtures, on the nature and duration of combustion and to evaluate powder properties. This experiment was carried out using citrate nitrate gel combustion route. This gel combustion process is a promising route for preparing nanocrystalline oxides. This route is based on self propagating exothermic reaction based on either the decomposition of citrate polymer matrix which acts as a flux or reaction between fuel and oxidizer. In this research work, citrate-nitrate auto-combustion process has been explored to synthesize fluorite type yittria stabilized zirconia powders varying fuel/nitrate ratio.
2. Experimental
Zirconium oxychloride octahydrate, ZrOCl2·8H2O (99%, Indian Rare Earth Ltd., Mumbai, India), yttria, Y2O3 (99.9%, Indian Rare Earth Ltd.), citric acid (Central Drug House (P) Ltd., New Delhi, India) and nitric acid (Merck, Mumbai, India) used were of analytical reagent grade. Flow chart of this process has already been reported in our earlier publication [16]. Appropriate amount of prepared nitrate salts, citric acid and ammonia was mixed. Five different solutions were prepared with different metal nitrate to citric acid ratio.
According to the concept of propellant chemistry, the stoichiometry is maintained based on the following the reaction between the nitrates of Zr4+, Y3+ and citric acid [3]:
0.92 ZrO(NO3)2 + 0.08 Y(NO3)3
+ 0.58 C(OH)(COOH)(CH2COOH)2
= Zr0.92Y0.08O1.96 + 3.48 CO2 + 2.32 H2O + 1.04 N2
This reaction generates a large amount of heat and a large volume of different gases within a short period of time. After completion of this reaction, a powder product is obtained which need further calcination. However, the vigorousness is strongly dependent on the ratio of mole of fuel to that of metal nitrates. The ratio, henceforth, will be mentioned as f/n. As per the fuel propellant chemistry, the most vigorous reaction should occur when fuel and oxidant are stoichiometrically mixed, i.e., fuel elemental ratio (FER) is 1. This ratio is described in the following manner:
As per the reaction, f/n is 0.58 with FER of 1 and for fuel propellant reaction. FERs of 0.25, 0.50, 0.75, 1.00 and 1.25 have been chosen with corresponding f/n of 2.32, 1.16, 0.77, 0.58 and 0.46, respectively.
The mixed composite nitrate solutions were heated on a hot plate until it turned into a viscous gel. A small portion of the gel of each composition was collected. This gel was characterized by Differential scanning calorimetry (DSC)-Thermogravometric analysis (TGA) (MDSC Q 100, TA Instruments, New Castle, DE) in air at a heating rate of 10˚C/min up to 500˚C. The remaining gels were calcined at 550˚C for 1 hr. X-ray diffractometry (XRD) (Xpert MPD, PAnalytical B.V., Almelo, the Netherlands) was carried out for the calcined powders using CuKα radiation in 2θ range of 20˚ - 80˚. The exact peak positions were determined using the following calibration equation [16]:
where Δ2θ is the difference between from the observed angle, 2θobs, and the actual one; a1, a2 and a3 are the three constants which were calculated from the data obtained using silicon standard sample. From XRD data, the crystallite sizes were calculated using Scherrer formula [17]:

where t is the crystallite size in nm, β is broadening of diffraction line at full width at half maxima (FWHM), θ was obtained from corrected peak position, 2θ and λ is the wavelength of CuKα radiation i.e. 0.15406 nm. Instrumental broadening of the XRD peaks was corrected using the following equation:
βs is the system broadening which was found using a polycrystalline silicon standard sample and βm is the observed broadening in the XRD raw data of the YSZ sample [17].
Crystallite sizes were also determined using Transmission electron microscopy (TEM) (Philips USA). Specific surface areas of the calcined powders were analysed by Brunauer-Emmett-Teller (BET) method using surface area analyzer (Sorptomatic 1990, Thermo Fennigan, Radano (MI), Italy).
3. Results and Discussion
3.1. Thermal Analysis
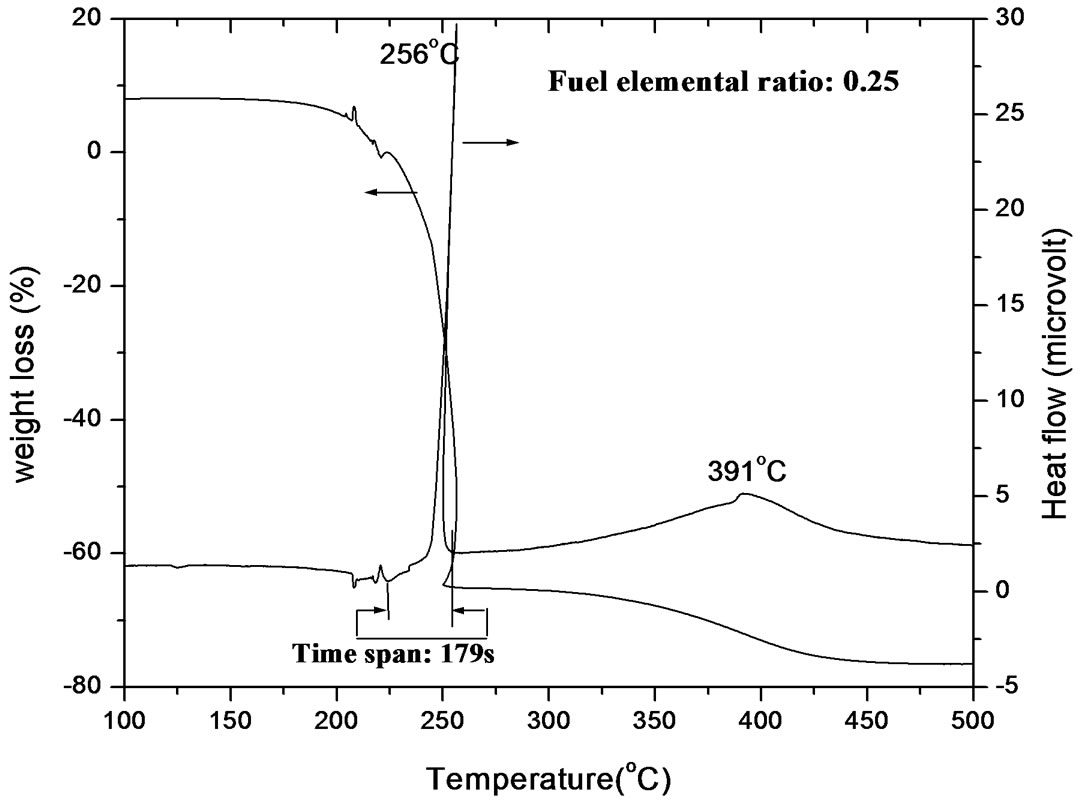
From DSC-TGA plot, it was observed that maximum exothermicity occurred at f/n = 1.16 and decreased when the ratio is always from 1.16. In case of extremely fuel rich ratio (FER = 0.25), DSC curve shows two exothermic peaks at temperatures around 256˚C and 391˚C (Figure 1(a)). The first peak can be attributed to the disruption of gel network and the second one may be due to the oxidation of carbonaceous residue to carbon dioxide [18]. It has been observed that the combustion reaction started at around 245˚C and the temperature suddenly went up to 256˚C and came down to 250˚C; the complete combustion occurred within 36 s. But before this vigorous reaction started, slow combustion had started at 224˚C and gone upto 256˚C; this total process went on for 179 s. TGA curve shows that weight loss took place in two different regions; the maximum weight loss occurred during the first vigorous exothermic reaction and the second stage occurred during second exothermic reaction.
Figure 1(b) shows the DSC-TGA curve of the reaction of FER of 0.5. The DSC curve shows one exothermic peak at 277˚C; a vigorous combustion started at 264˚C and completed at 268˚C. During this vigorous exothermic reaction, maximum combustion temperature displayed on the DSC-TGA instrument is 279˚C. It indicates that the displayed higher temperature (279˚C) occurred due to the sudden heat generation during combustion and the temperature fell down when the heat started dissipating
 (a)
(a) (b)
(b)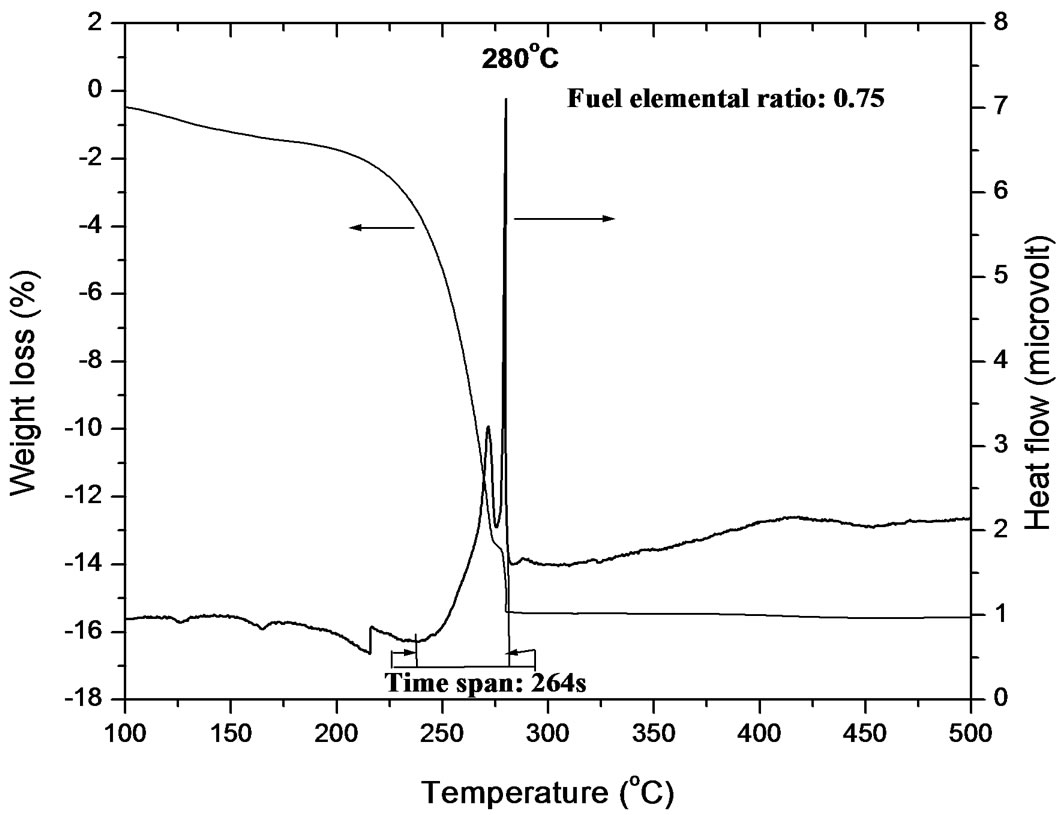 (c)
(c) (d)
(d)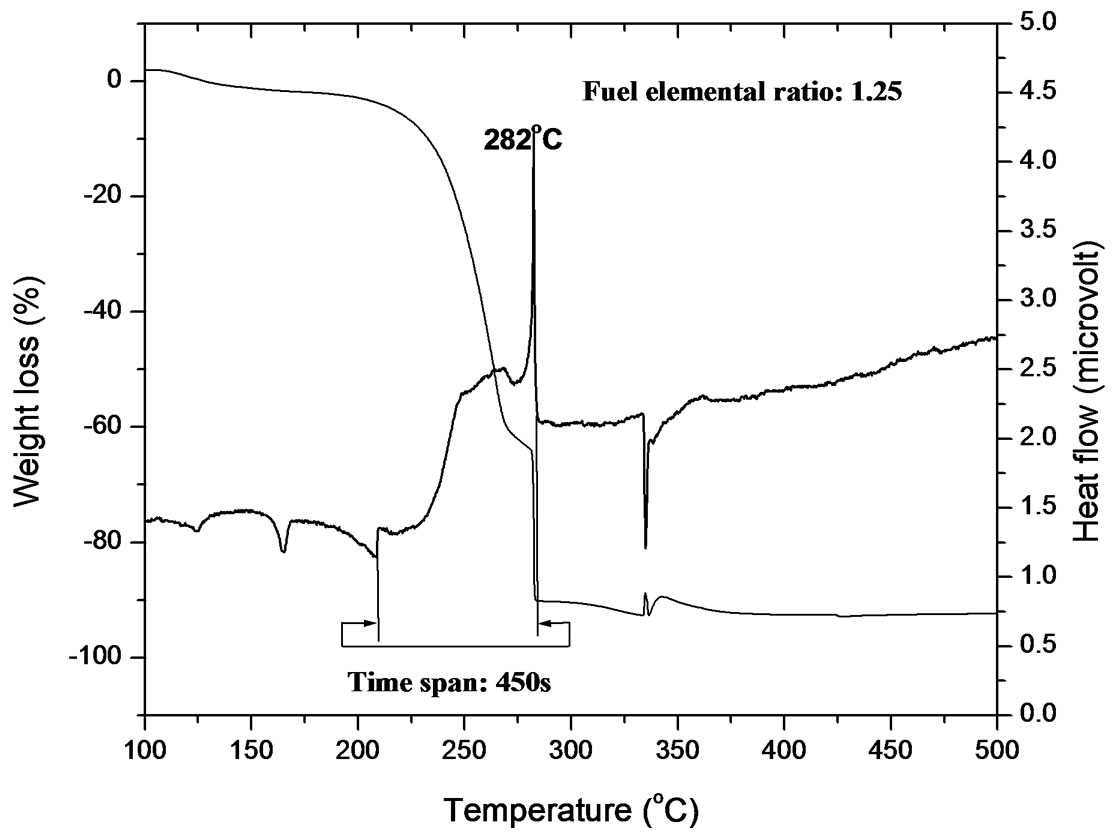 (e)
(e)
Figure 1. (a) TGA-DSC plot of gel of FER 0.25; (b) TGA-DSC plot of gel of FER 0.50; (c) TGA-DSC plot of gel of FER 0.75; (d) TGA-DSC plot of gel of FER 1.00; (e) TGA-DSC plot of gel of FER 1.25.
out of the system; the sharp line-like peak was tilted showing that temperature got reduced after completion of combustion. No second exothermic or endothermic peak was observed; it may be due to the presence of exact amount of fuel which is required for complete complexation. Slow combustion started at 247˚C and completed at 271˚C and took 144 s to be over. The temperature span and the duration is also less compared to those observed in the reaction of FER of 0.25. For the gel of FER of 0.75, the thermogram (Figure 1(c)) shows one peak at 280˚C which is attributed to a vigorous exothermic reaction occurred; this vigorous reaction indicates the disruption of citrate gel network. DTA curve also indicates that major weight loss occurred when the vigorous exothermic reaction took place. The vigorous reaction went on from 277˚C to 279˚C within 15 s. During this reaction maximum temperature displayed over instrument was 280˚C. But this reaction slowly started at 239˚C and completed at 282˚C within 264 s. However, another slow weight loss regime has been observed in TGA curve below 200˚C; this weight may be due to the evaporation of water along with release of decomposed gases. Very tiny endothermic peak occurred below 200˚C which can be attributed to the melting of free citric acid, as stated by Singh et al. [19]. During heating citric acid melts at 173˚C and converts to aconitic acid with the removal of water. This acinitic acid also upon heating converts to itaconic acid which also undergoes polymerisation at 166˚C. This polymer undergoes decarboxylation with release of CO2 [20]. This polymer helps in dispersion of Zr4+ and Y3+ in the matrix. Upon further heating, this polymer network disrupts generating a large volume of gas, thereby producing tiny nanocrystalline YSZ particles. The endothermic peaks in the thermogram of FER of 0.75 also appeared in those of FER of 1.00 and 1.25 in a broad manner (Figures 1(d)-(e)). These peaks were accompanied by weight loss shown in the TGA curves. For FER of 1.00 and 1.25, the thermograms indicate that the vigorous exothermic reaction went in the temperature ranges of 273˚C - 275˚C for 14 s and 280˚C -282˚C for 11 s with highest displayed temperatures of 278˚C and 282˚C, respectively. The slow exothermic reaction went on in the temperature ranges of 226˚C - 292˚C for 405 s and 210˚C -285˚C for 450 s for FER of 1.00 and 1.25, respectively. It is observed that the duration for the extremely vigorous reaction decreases with the decrease in citric acid to nitrate molar (c/n molar ratio) ratio; this may be attributed to less amount of citrate complex with deceased amount of fuel. Using the law of fuel propellant chemistry, it can be concluded that the amount of citrate complex must be same for FER of 1.00 to 0.25. But practically it was observed by many authors reported that excess fuel is required for the formation of citrate complex [21,22]. Purohit et al. (2006) has found that a satisfactory viscous gel cannot be obtained upto ZrO(NO3)2 to citric acid molar ratio of 1:1, whereas 0.55 mol citric acid is required to have stoichiometric combustion reaction. They assumed that this happened due to the insufficient amount of citric acid for complete complexation. Therefore, a number of FER has been used to identify the exact composition range where complete complexation of citric acid occurs. The observation indicates that compositions at around FER of 0.50 can be the best choice for complete complexation. The upper and lower limit of FER must be somewhere between 0.25 and 0.75. This result is in good agreement of this reported in literature [22]. For FER ratio of 0.75 to 1.25, endothermic peaks are observed below 250˚C along with a small weight loss in the TGA curve, followed by a large decomposition in the temperature range of 200˚C - 300˚C. The large decomposition peak in DSC curve is also accompanied by a large downfall in TGA curve indicating weight loss. This result indicates that a large volume of weight loss occurred due to the decomposition of citrate complex [21]. From the DSC and TGA curves of all the samples, it was observed that the broadness of the exothermic peak in the temperature range of 200˚C - 300˚C increases with less area under strong exothermic for FER from 0.50 to 1.25. It implies that the the mixture of citric acid and nitrates was taking much more time to get ignited with the heat generated from the exothermic reaction due to less exothetmicity. Since the area under the curve of strong exothermic peak gets reduced from FER of 0.50 to 1.25, it can be assumed that the volume of citrate complex decreases with decreasing amount of fuel. From the endothermic peaks appeared below 200˚C, it can be understood that some citric acid stay free in the mixture. With the fuel below 0.77 mole for 1 mole of nitrate, very less amount of fuel takes part in complexation and the fuel stays as a free component. This result is in good agreement with the observations by many researchers [5,21].
3.2. XRD and Specific Surface Area
Figure 2 shows the XRD plot of the as-prepared powders. It was observed that some new peaks have appeared in the xrd plot powder of FER of 0.50 which may be due to the presence of rhombohedral phase as per JCPDS data base. This may be attributed to the very much short duration of combustion which did not allow all the atoms to arrange themselves so fast to form cubic structure throughout the whole material. However, after sintering, the peaks got disappeared which may have been possible because the atoms got enough time to rearrange themselves. Crystallite sizes have been calculated analysing peaks of the xrd plots. The average crystallites of powders have been given in Table 1.
It is observed that smallest average crystallites were obtained from the powders of FER 0.50 with lowest specific surface area; this may be attributed to the higher amount of free energy which led to the agglomeration. The generation of very small crystallite may be due to the very short duration of slow combustion which did not promote inter-particle sintering within soft agglomerates.
3.3. TEM Image
TEM study also supported the calculated data from xrd results. The TEM images of FER of 0.25, 0.50 and 0.75 are shown in Figures 3(a)-(c). Since the crystallite sizes are same for the compositions of FER of 1.00 and 1.25, the images of the same are not given.
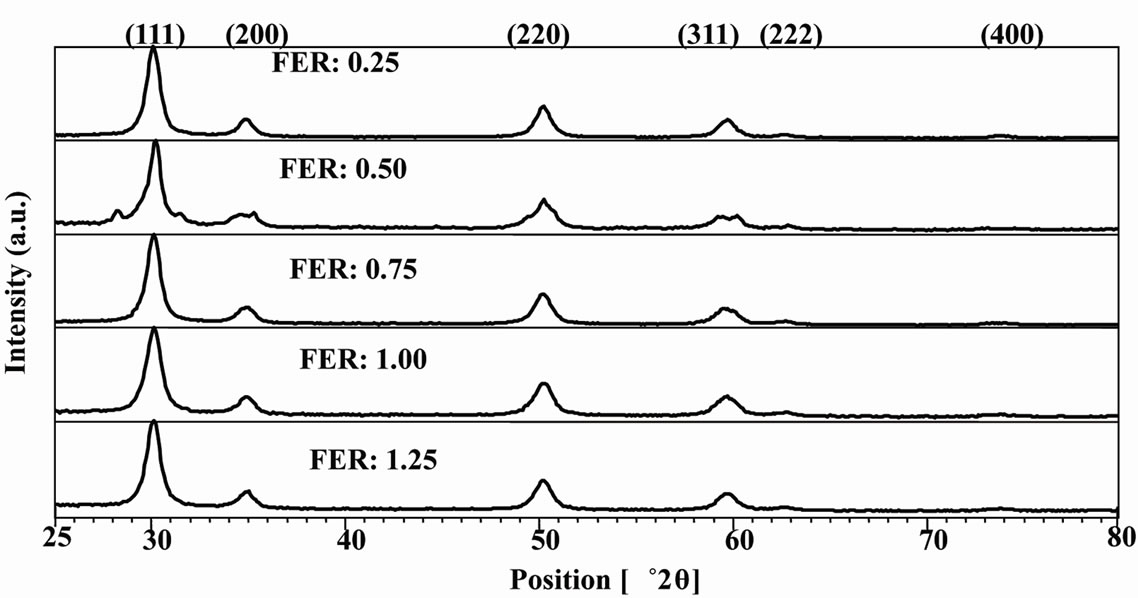
Figure 2. XRD plot of YSZ powders.
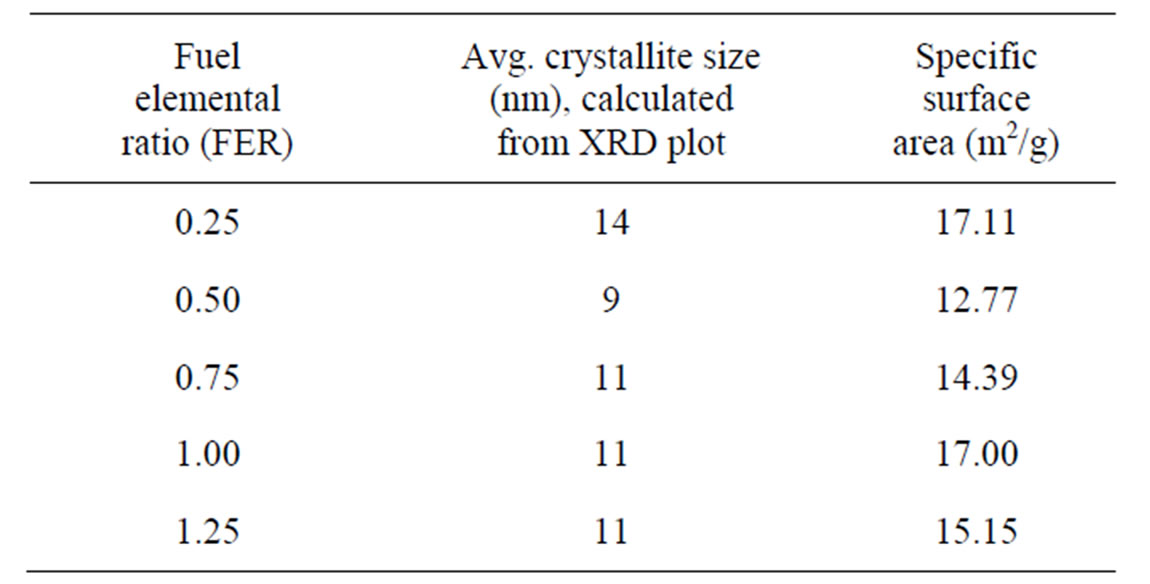
Table 1. Crystallite size and specific surface area of the products.
 (a)
(a)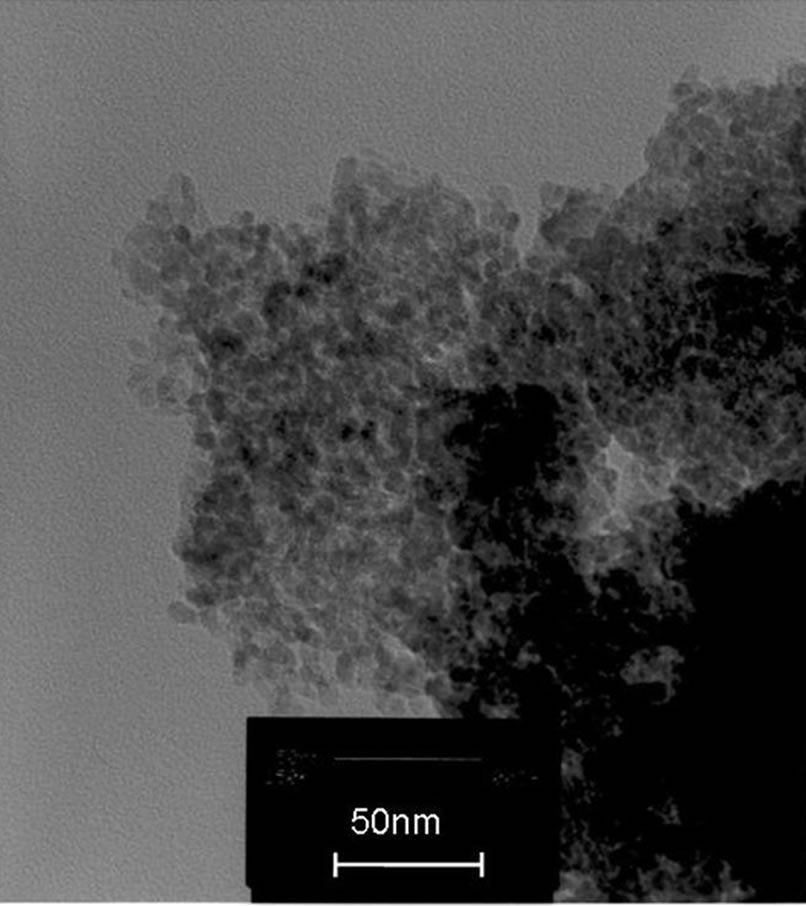 (b)
(b)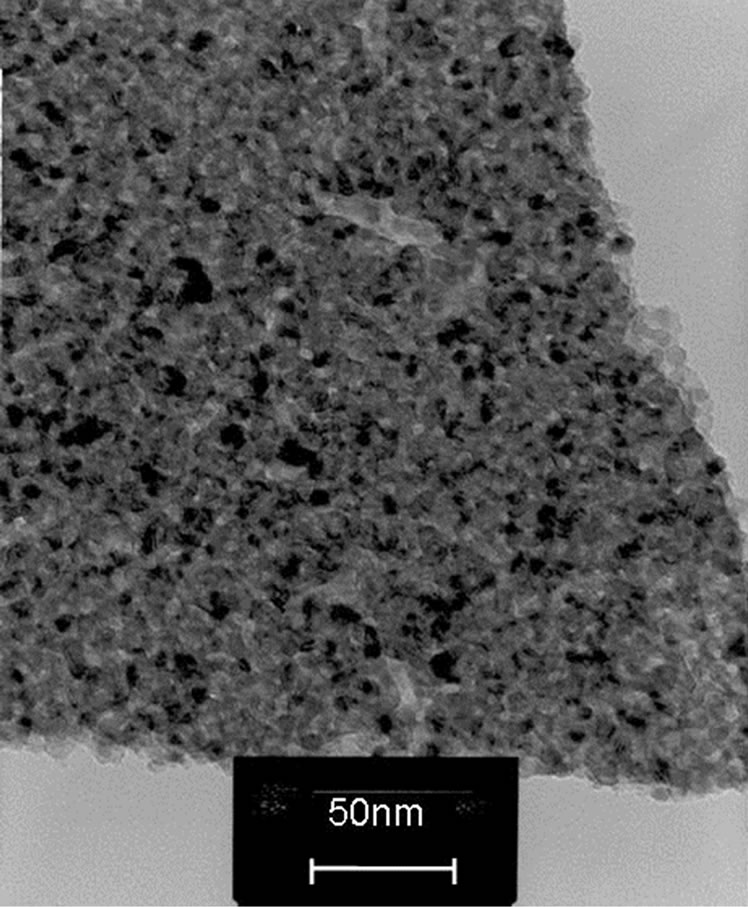 (c)
(c)
Figure 3. (a) TEM image of powder of FER 0.25; (b) TEM image of powder of FER 0.50; (c) TEM image of powder of FER 0.75.
4. Conclusion
The experimental result showed that combustion wave propagates with different speeds; first the wave starts with slow motion, then gets vigorous and finally slows down. The vigorous reaction takes place within a few seconds, but the slow process goes on for a few minutes. The duration for vigorous combustion increases with the amount fuel. The most vigorous reaction occurred with the products of very small crystallite size for the composition of FER 0.50; during reaction interparticle sintering might have taken place, as observed by specific surface area analysis (12.77 m2/g). For the compositions below FER 0.50, excess fuel gets ignited after completion of combustion. In case of FER of 1.00 and above, the slow combustion reactions went on for a prolonged period; this may be due to the lower amount of heat generation because of less amount of fuel.
5. Acknowledgements
The author is grateful to Dr. J. N. Das, Director, NMRL and Dr. S. C. Sharma, Head of Ceramics Division and the colleagues of Ceramics Division of NMRL for their contribution in this work.
REFERENCES
- A. S. Edelstein and R. C. Cammarata, “Nanomaterials: Synthesis, Properties and Applications,” Institute of Physics Publication, Bristol, 1996.
- K. C. Patil, S. T. Aruna and T. Mimani, “Combustion Synthesis: An Update,” Current Opinion in Solid State & Materials Science, Vol. 6, No. 6, 2002, pp. 507-512. doi:10.1016/S1359-0286(02)00123-7
- S. R. Jain, K. C. Adiga and V. R. Pai Verneker, “A New Approach to Thermochemical Calculations of Condensed Fuel-Oxidizer Mixtures,” Combustion and Flame, Vol. 40, No. 6, 1981, pp. 71-79. doi:10.1016/0010-2180(81)90111-5
- K. C. Patil, “Advanced Ceramics: Combustion Synthesis and Properties,” Bulletin of Material Science, Vol. 16, No. 6, 1993, pp. 533-541. doi:10.1007/BF02757654
- M. Marinsek, K. Zupan and J. Maèek, “Ni-YSZ Cermet Anodes Prepared by Citrate/Nitrate Combustion Synthesis,” Journal of Power Sources, Vol. 106, No. 1-2, 2002, pp. 178-188. doi:10.1016/S0378-7753(01)01056-4
- A. Chakroborty, A. Das Sharma, B. Maiti and H. S. Maiti, “Preparation of Low-Temperature Sinterable BaCe0.8- Sm0.2O3 Powder by Autoignition Technique,” Materials Letters, Vol. 57, No. 4, 2002, pp. 862-867. doi:10.1016/S0167-577X(02)00886-8
- A. Mali and A. Ataie, “Influence of the Metal Nitrates to Citric Acid Molar Ratio on the Combustion Process and Phase Constitution of Barium Hexaferrite Particles Prepared by So-Gel Combustion Method,” Ceramics International, Vol. 30, No. 7, 2004, pp. 1979-1983. doi:10.1016/j.ceramint.2003.12.178
- B. J. Hwang, R. Santhanam and D. G. Liu, “Effect of Various Synthetic Parameters on Purity of LiMn2O4 Spinel Synthesized by a Sol-Gel Method at Low Temperature,” Journal of Power Sources, Vol. 101, No. 1, 2001, pp. 86-89. doi:10.1016/S0378-7753(01)00657-7
- T. Peng, X. Liu, K. Dai, J. Xiao and H. Song, “Effect of Acidity on the Glycine-Nitrate Combustion Synthesis of Nanocrystalline Alumina Powder,” Materials Research Bulletin, Vol. 41, No. 9, 2006, pp. 1638-1645. doi:10.1016/j.materresbull.2006.02.026
- O. Burgos-Montes, R. Moreno, M. T. Colomer and J. C. Fari˜nas, “Influence of Combustion Aids on Suspension Combustion Synthesis of Mullite Powders,” Journal of the European Ceramic Society, Vol. 26, No. 15, 2006, pp. 3365-3372. doi:10.1016/j.jeurceramsoc.2005.08.006
- S. Biamino and C. Badini, “Combustion Synthesis of Lanthanum Chromite Starting from Water Solutions: Investigation of Process Mechanism by DTATGA-MS,” Journal of the European Ceramic Society, Vol. 24, No. 10-11, 2004, pp. 3021-3024. doi:10.1016/j.jeurceramsoc.2003.10.005
- C.-C. Hwang, T.-H. Huang, J.-S. Tsai, C.-S. Lin and C.-H. Peng, “Combustion Synthesis of Nanocrystalline Ceria (CeO2) Powders by a Dry Route,” Materials Science and Engineering: B, Vol. 132, No. 3, 2006, pp. 229-238. doi:10.1016/j.mseb.2006.01.021
- A. S. Mukasyan, P. Epstein and P. Dinka, “Solution Combustion Synthesis of Nanomaterials,” Proceedings of the Combustion Institute, Vol. 31, No. 2, 2007, pp. 1789- 1795. doi:10.1016/j.proci.2006.07.052
- V. Chandramouli, S. Anthonysamy and P. R. Vasudeva Rao, “Combustion Synthesis of Thoria a Feasibility Study,” Journal of Nuclear Materials, Vol. 265, No. 3, 1999, pp. 255-261. doi:10.1016/S0022-3115(98)00688-6
- J. Poth, R. Haberkorn and H. P. Beck, “Combustion-Synthesis of SrTiO3. Part I. Synthesis and Properties of the Ignition Products,” Journal of the European Ceramic Society, Vol. 20, 2000, pp. 707-713.
- M. Biswas, K. Shashidhara, P. K. Ojha and T. K. Chongdar, “Linear Combination of Atomic Orbitals Approximation in Nanocrystalline Yittria-Stabilized Zirconia Synthesized by Citrate-Nitrate Gel Combustion Process,” Journal of the American Ceramic Society, Vol. 91, No. 3, 2008, pp. 934-937. doi:10.1111/j.1551-2916.2007.02218.x
- B. D. Culity, “Elements of X-Ray Diffraction,” AddisonWesley, Reading, 1978.
- R. E. Juarez, D. G. Lamas, G. E. Lascalea and N. E. Walsoe de Reca, “Synthesis of Nanocrystalline Zirconia Powders for TZP Ceramics by a Nitrate-Citrate Combustion Route,” Journal of the European Ceramic Society, Vol. 20, No. 2, 2000, pp. 133-138. doi:10.1016/S0955-2219(99)00146-6
- K. A. Singh, L. C. Pathak and S. K. Roy, “Effect of Citric Acid on the Synthesis of Nano-Crystalline Yttria Stabilized Zirconia Powders by Nitrate-Citrate,” Ceramics International, Vol. 33, No. 8, 2007, pp. 1463-1468. doi:10.1016/j.ceramint.2006.05.021
- L. C. Pathak, T. B. Singh, S. Das, A. K. Verma and P. Ramachandrarao, “Effect of pH on the Combustion Synthesis of Nano-Crystalline Alumina Powder,” Materials Letters, Vol. 57, No. 2, 2002, pp. 380-385. doi:10.1016/S0167-577X(02)00796-6
- M. Bhagwat, P. Shah and V. Ramaswamy, “Synthesis of Nanocrystalline SnO2 Powder by Amorphous Citrate Route,” Materials Letters, Vol. 57, No. 9-10, 2003, pp. 1604-1611. doi:10.1016/S0167-577X(02)01040-6
- R. D. Purohit, S. Saha and A. K. Tyagi, “Combustion Synthesis of Nanocrystalline ZrO2 Powder: XRD, Raman Spectroscopy and TEM Studies,” Materials Science and Engineering: B, Vol. 130, No. 1-3, 2006, pp. 57-60. doi:10.1016/j.mseb.2006.02.041
NOTES
*Corresponding author.