Applied Mathematics
Vol. 3 No. 4 (2012) , Article ID: 18884 , 4 pages DOI:10.4236/am.2012.34054
On the Distribution of the Minimum or Maximum of a Random Number of i.i.d. Lifetime Random Variables
1Department of Applied Mathematics & Statistics, ICMC, Universidade de São Paulo, São Paulo, Brazil
2Department of Statistics, CCET, Universidade Federal de São Carlos, São Carlos, Brazil
Email: louzada@icmc.usp.kr
Received January 19, 2012; revised March 5, 2012; accepted March 12, 2012
Keywords: Compounding Distributions; Distribution of the Maximum; Distribution of the Minimum; Probability Generating Function
ABSTRACT
Statisticians are usually concerned with the proposition of new distributions. In this paper we point out that a unified and concise derivation procedure of the distribution of the minimum or maximum of a random number N of independent and identically distributed continuous random variables ,
,  is obtained if one compounds the probability generating function of N with the survival or the distribution function of Yi. Expressions are then derived in closed form for the density, hazard and quantile functions of the minimum or maximum. The methodology is illustrated with examples of the distributions proposed by Adamidis and Loukas (1998), Kus (2007), Tahmasbi and Rezaei (2008), Barreto-Souza and Cribari-Neto (2009), Cancho, Louzada, and Barriga (2011) and Louzada, Roman and Cancho (2011).
1. Introduction
Several authors have proposed new distributions for the maximum or the minimum as extensions of the exponential distribution, such as [1-7]. In this paper, we obtain an alternative form to the one considered by these authors for obtaining the distribution of the minimum or maximum of  independent and identically distributed (i.i.d.) random variables
 ,
,  ,
,  being also a strictly positive integer random variable with discrete probability function (dpf) and probability generating function (pgf)
  defined throughout the interval
 .
.
Let  and
and  be the survival function and cumulative distribution function of the random variables
 ,
, . The cumulative distribution of the maximum out of
  is obtained by composing
  with the cumulative distribution function of
  and the survival function of the minimum is obtained by composing
  with the survival function of
 .
.
2. Model Formulation
Let  be a strictly positive random variable with dpf and pgf of
  defined throughout the interval
 .
.  is increasing in
  and satisfies the equalities
  and
and . Thus
  can be viewed as the value for
  of a cumulative distribution function.
If  is an absolutely continuous function, its pdf is denoted by
 , and risk function is represented by
 , both supported on
 . Keeping the assumptions made in this section on the random variable
 , it follows that the function
  is decreasing function of
  being thus the equalities
  and
and . So
. So  is the restriction to the interval
  of a survival function and if it is absolutely continuous function it has pdf represented by
  and hazard function denoted
 , both with support in
 .
.
In this paper  is the vector of parameters of
  and all other Greek letters refer to the parameters of cumulative distribution function of
 , which is represented by
 .
.
Let  be a sequence of i.i.d. random variables with pdf and
  corresponding to the number of random variables
  i.i.d. random variables with survival function
  and the cumulative distribution function
 .
.
For  the survival function of
is given by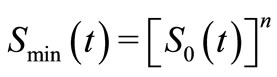 , but when
  is a random variable the survival function of the minimum is given by
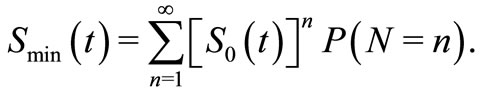 (1)
(1)
Several authors have obtained density functions of the minimum by (2), which requires the calculation of a series, given by
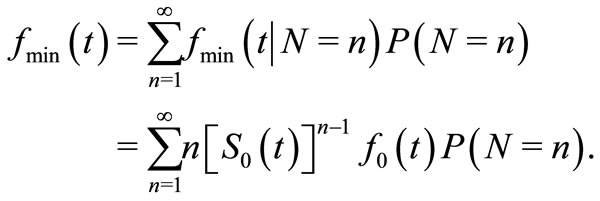 (2)
(2)
In this paper we show that a more concise way to obtain the functions that determine the distribution of the minimum without the need of the calculation a series by considering the fact that the expression (1) can also be written as,
 (3)
(3)
Thus, the survival function of the minimum is obtained directly from (3), consequently the pdf of the minimum is obtained by derivation of . Similarly, the survival function of maximum
  is obtained from
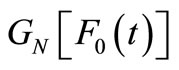 , and the cumulative distribution and pdfs of the maximum are obtained by derivation of
 . From (3) follows that the survival function of the minimum and the cumulative distribution function of
  are defined as
 (4)
(4)
The pdf, hazard and quantile functions of the minimum or maximum of the  are defined respectively as
 (5)
(5)
 (6)
(6)
and
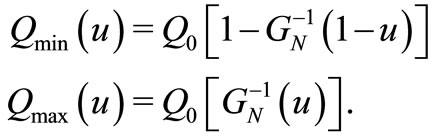 (7)
(7)
where  is the quantile function the of basic distribution of
 .
.
The maximum likelihood estimates (MLEs) of the parameters are obtained by direct maximization of the loglikelihood function,  ,
,  or
or .
.
The advantage of this procedure is that it runs immediately using existing statistical packages such as R. The EM-algorithm can also be considered as in [6]. Largesample inference for the parameters can be based on their MLEs and estimated standard errors, or, preferably, on the profile likelihood, the later being invariant under reparametrization and a safer guide in relatively small samples. Different approaches are via the bootstrap or via Bayesian inference.
3. Some Working Examples
Table 1 shows the pgf of , the survival function and the density function of the minimum or maximum of
  i.i.d. random variables for the distributions proposed by [1,3,4,6,7], obtained respectively by considering (4), (5) and (6), assuming
  as the survival function from an exponentiated random variable. However, many new distributions may be obtained by considering a composition of different
  and
and  functions. For instance, assuming
 ,
, 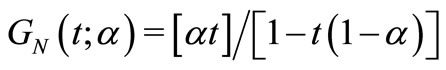 (the geometric pgf) and
  (the Weibull survival function), we obtain
 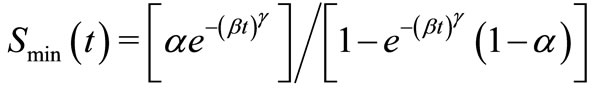 and
and
 .
.
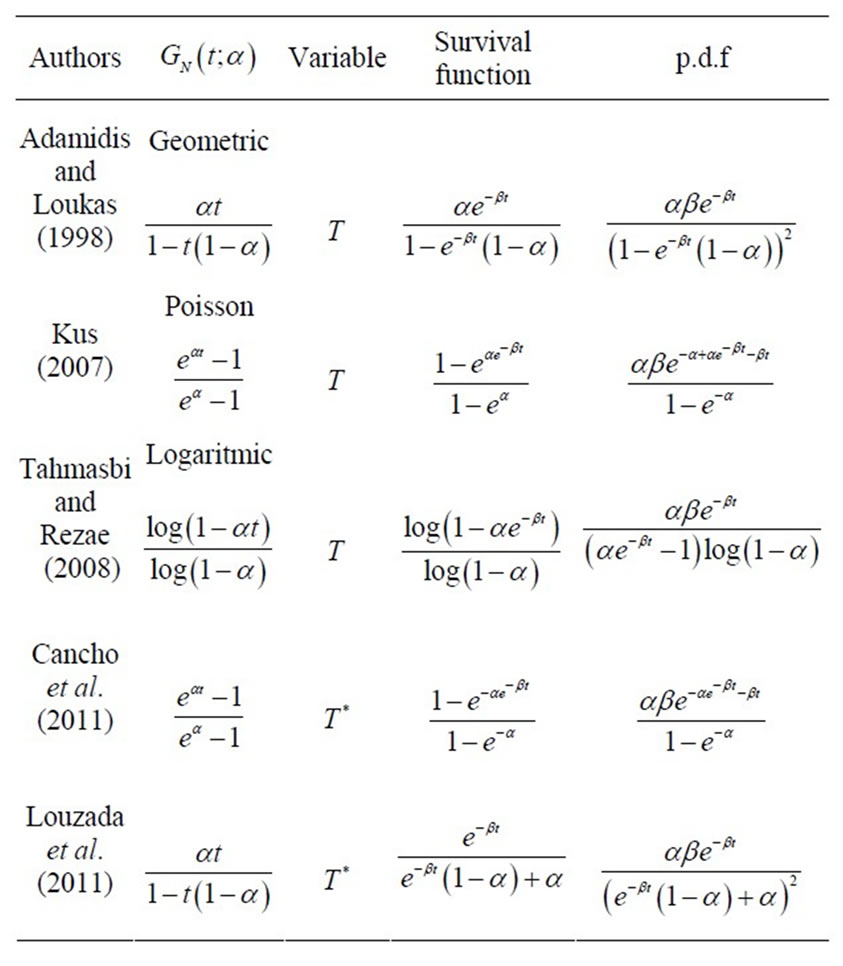
Table 1. The pgf of N and survival function and density function (p.d.f) for  or
or .
.
We fit the five different distributions presented in Table 1 in a real data set on the serum-reversal time (days) of 143 children contaminated with HIV by vertical transmission from the University Hospital of the Ribeiro Preto School of Medicine (Hospital das Clnicas da Faculdade de Medicina de Ribeiro Preto) from 1986 to 2001 [8]. Serum-reversal can occur in children born from mothers infected with HIV. In order to compare the distributions we consider the  values, the Akaike information criterion (AIC) and Bayesian information criterion (BIC). The best distribution corresponds to lower
 , AIC and BIC values. The Table 2 shows the parameter MLEs and their corresponding standard errors in parentheses, values of the
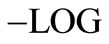 , AIC and BIC. The values of AIC, BIC and
  provide evidence in favor the CEG distribution. These results are corroborated by the fitted density functions and survival functions of the five distributions superimposed to the histogram and Kaplan-Meier curve. The Figure 1 presents the fitted density functions on the histogram, and survival function of the EG, EP, EL, PE and CEG distributions superimposed to the data histogram and Kaplan-Meier fit, respectively. The presence of long-term survivals is very common in practice [8]. Our approach should be investigate in the long-term survival context. A possible approach is to consider the mixture model adopted by [9].

Table 2. The parameter MLEs, their corresponding standard errors in parentheses, values of the –LOG, AIC and BIC to the five fitted distributions.
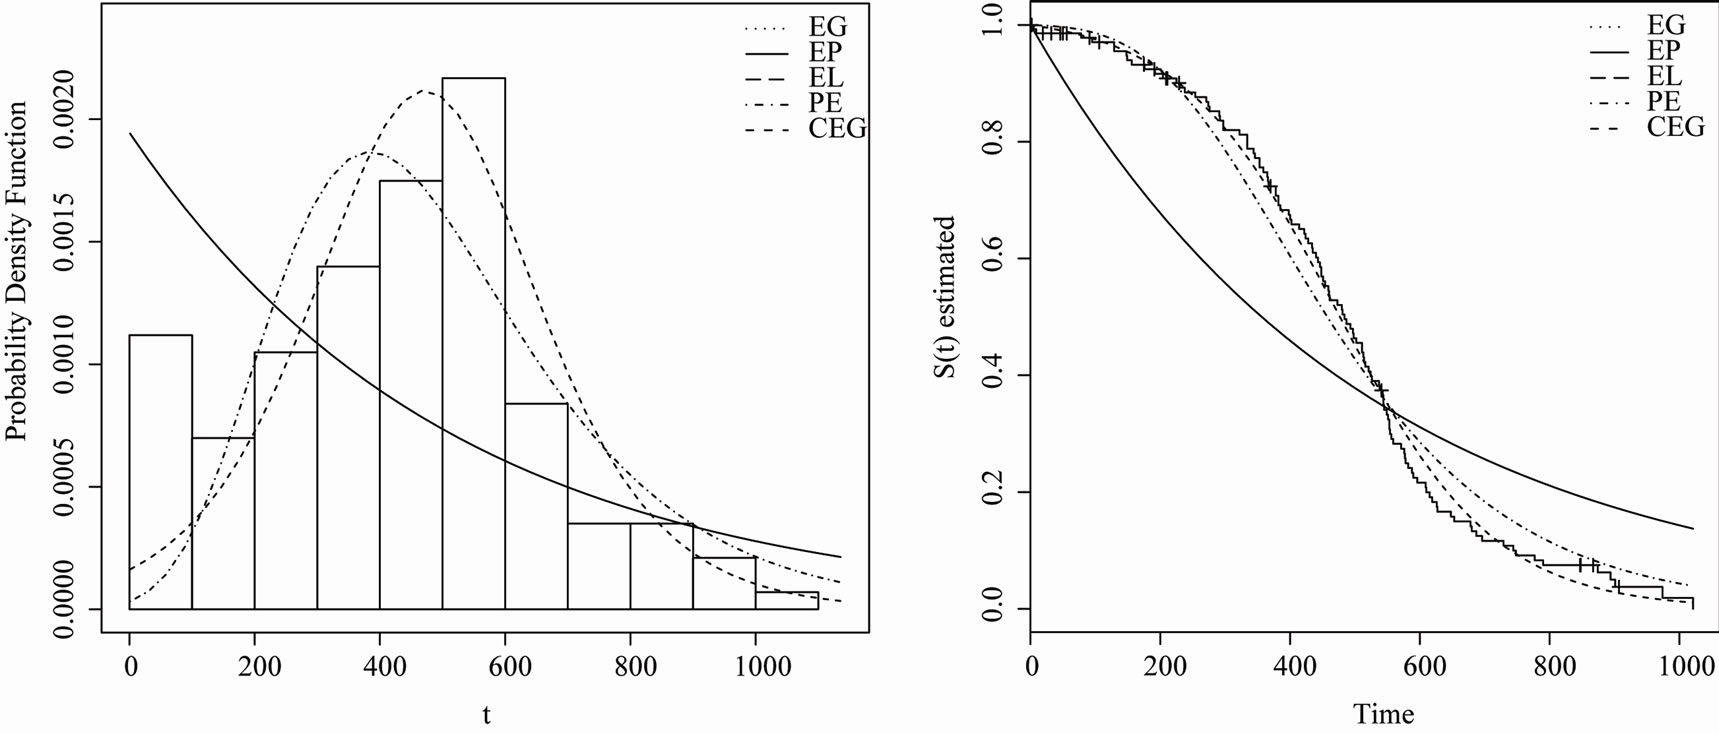
Figure 1. Fitted density functions on the histogram (left panel), and survival function (right panel) of the EP, EG, CEG,PE and El distributions superimposed to the Kaplan-Meier fit.
4. Acknowledgements
The authors thank the referees for their comments. The research of Francisco Louzada is supported by the Brazilian organization CNPq.
REFERENCES
- K. Adamidis and S. Loukas, “A Lifetime Distribution with Decreasing Failure Rate,” Statistics and Probability Letters, Vol. 39, No. 1, 1998, pp. 35-42. doi:10.1016/S0167-7152(98)00012-1
- K. Adamidis, T. Dimitrakopoulou and S. Loukas, “On an Extension of the Exponential-Geometric Distribution,” Statistics and Probability Letters, Vol. 73, No. 3, 2005, pp. 259-269. doi:10.1016/j.spl.2005.03.013
- C. Kus, “A New Lifetime Distribution Distributions,” Computational Statistics and Data analysis, Vol. 11, No. 9, 2007, pp. 4497-4509. doi:10.1016/j.csda.2006.07.017
- R. Tahmasbi and S. Rezaei, “A Two-Parameter Life-Time Distribution with Decreasing Failure Rate,” Computational Statistics and Data Analysis, Vol. 52, No. 8, 2008, pp. 3889-3901. doi:10.1016/j.csda.2007.12.002
- W. Barreto-Souza and F. Cribari-Neto, “A Generalization of the Exponential-Poisson Distribution,” Statistics and Probability Letters, Vol. 79, No. 24, 2009, pp. 2493-2500. doi:10.1016/j.spl.2009.09.003
- V. Cancho, F. Louzada and G. Barriga, “The Poisson-Exponential Lifetime Distribution,” Computational Statistics and Data analysis, Vol. 55, No. , 2011, pp. 677-686. doi:10.1016/j.csda.2010.05.033
- F. Louzada, M. Roman and V. Cancho, “The Complementary Exponential Geometric Distribution: Model, Properties, and a Comparison with Its Counterpart,” Computational Statistics and Data analysis, Vol. 55, No. 8, 2011, pp. 2516-2524. doi:10.1016/j.csda.2011.02.018
- M. C. Hsiung, T.-H. Tung2, C.-Y. Chang, Y.-C. Chuang, S.-H. S. K-C. Lee, Y.-P. Chou, H. R, C.-M. Huang, W.-H. Y. C-C. Lin and J. W. M. S. Young, “Long-Term Survival and Prognostic Implications of Chinese Type 2 Diabetic Patients with Coronary Artery Disease after Coronary Artery Bypass Grafting,” Applied Mathematics, Vol. 1, No. 3, 2009, pp. 139-145.
- G. S. C. Perdona and F. Louzada-Neto, “A General Hazard Model for Lifetime Data in the Presence of Cure Rate,” Journal of Applied Statistics, Vol. 38, No. 7, 2011, pp. 1395-1405. doi:10.1080/02664763.2010.505948