Advances in Bioscience and Biotechnology
Vol.1 No.4(2010), Article ID:2860,8 pages DOI:10.4236/abb.2010.14042
Gold Nanoparticles for Colorimetric detection of hydrolysis of antibiotics by penicillin G acylase
![]()
1DST unit on nanoscience and nanotechnology, Department of Physics, University of Pune, Pune, India;
2Biochemical Sciences Divisions, National Chemical Laboratory, Pune, India;
3Indian Institute of Science Education and Research, Pune, India.
Email: rt.neha@gmail.com
Received 23 June 2010; revised 12 July 2010; accepted 24 July 2010.
Keywords: Gold Nanoparticles, Penicillin G Acylase, Aggregation, Colorimetric Detection, Surface Plasmon Resonance
ABSTRACT
A simple inexpensive method of monitoring hydrolysis of an antibiotic penicillin G (pen G) and subsequent enzyme detection using gold nanoparticles is presented. Gold nanoparticles capped with Cetyl trimethyl ammonium bromide (CTAB) are synthesized using chemical route. The particles could be used for detection of Penicillin G acylase (PGA) enzyme by incorporating hydrolysis reaction with pen G. This hydrolysis reaction leads to a shift in the surface plasmon band of gold nanoparticles from 527 nm to 545 nm accompanied by a visual colorimetric change in the solution from red to blue. The process is attributed to aggregation of nanoparticles caused due to displacement of CTAB bilayer by byproducts of the hydrolysis reaction. It is proposed that the presence of 0.007 mg/ml of PGA can be detected by a color change of gold nanoparticles solution without requiring any complicated instrument or highly trained operator to conduct the test. The method could also identify the presence of different penicillins by showing different spectral shifts. Thus the work presented here would be useful not only for the detection of the pharmaceutically important drug Pen G, but also represents a general methodology for the detection of enzymes, eg PGA.
1. INTRODUCTION
Metal nanoparticles based enzymatic assays [1-5] are increasingly becoming popular due to their increased sensitivity as well as rapidness when compared to the conventional methods [6-9]. The potential of gold nanoparticles in this field stems from the phenomenon of surface plasmon resonance (SPR), which is the collective oscillation of free electrons in metal nanoparticles when electromagnetic radiation is incident on them [10]. Based on metal nanoparticles, there are various sensing mechanisms [11-19] which lead to the detection of biomolecules by monitoring changes in the localized surface plasmon resonance (LSPR) extinction. The sensing mechanisms include local refractive index changes, nanoparticle aggregation, charge-transfer interactions at nanoparticle surfaces, resonant Rayleigh scattering from nanoparticles, surface enhanced Raman scattering and plasmon enhanced molecular florescence.
Enzyme biosensing has been achieved using gold nanoparticles [20], pH responsive hydrogels and supramolecular assemblies [21]. Fischer et al. [22] used anionically functionalized monolayer protected gold nanoclusters for inhibition of chymotrypsin. Apart from these examples, detection of enzymes such as proteases has been achieved by binding nanoparticles with peptides [1,2]. These peptides lead to assembly of nanoparticles due to their cross linking by long chain molecules. Enzymes specific for these peptides are then introduced which cleave the peptide bond leading to dispersion of nanoparticles. This aggregation–dispersion process leads to the colorimetric changes in the nanoparticle solution. Aggregation of gold nanoparticles leads to red shift in the plasmon band due to the electric dipole-dipole interaction leading to a coupling between the plasmon oscillations of different particles [23]. The color of gold nanoparticle solution turns from red to blue/purple due to red shift in the plasmon band. Here the red shift refers to the shift in the plasmon band towards longer wavelength i.e red region of the electromagnetic spectrum. This color change has been used to detect the presence of analytes that induce selective aggregation of gold nanoparticles. The position and intensity of plasmon band is used to monitor this aggregation process.
The results presented in this paper describe detection of enzyme Penicillin G acylase. Acylases are a group of enzymes that catalyze the cleavage of carbon–nitrogen bonds in amides. Penicillin acylases are members of the N-terminal nucleophile (Ntn) hydrolase superfamily, which share a common fold around the active site and a catalytic residue in the N-terminal position [24,25]. These enzymes are used mainly in the pharmaceutical industry for the production of 6-Aminopenicillinic acid (6-APA), a key intermediate in the production of semi synthetic penicillins and cephalosporins, which are now far the most widely used antibiotics. In addition, these enzymes are very useful as biocatalysts in some important reactions like peptide synthesis [26,27], and also in the resolution of clinically active compounds [28,29]. Penicillin acylases specifically catalyse hydrolysis of Penicillins. For each type of penicillin, there exists an enzyme which performs this hydrolysis reaction. Penicillin G acylase (PGA) is a specific enzyme for an important drug, Penicillin G (Pen G).The hydrolysis reaction of penicillins by penicillin acylases leads to breaking of its molecules into different byproducts, thereby leading to consumption of penicillins. All the enzymatic assays quantify consumption of the respective penicillins or detect the formation of byproducts over time. Enzymatic activity, which is the measure of amount of active enzymes in the solution, is then determined using such different kinds of assays. The earliest procedures to assay penicillin acylase activity are tedious and time consuming [7,30-33]. Some of these include paper chromatography [6], gas chromatography [34], assays using 6-nitro-3-(phenylacetamido) benzoic acid (NIPAB) [35], titrimetric determination using pH stat [8] etc. Methods stated above either require expert operators or expensive instruments or reagents e.g. NIPAB.
Our method consists of detecting 6-Aminopenicillin acid, which is a byproduct in hydrolysis of pen G, and in turn assaying PGA without any chromogenic reagent. There is a distinct color change observable in the gold nanoparticle solution with naked eyes from initial red to final blue, when the pen G hydrolysis reaction is performed by PGA in the presence of gold nanoparticles. Although various enzymes have also been detected by using nanoparticles as probes, there are no reports of detection of Penicillin acylases using nanoparticles. We indeed use various sophisticated techniques like TEM, UV-VIS spectroscopy in order to investigate the biosensing mechanism using gold nanoparticles. However, once this test is acceptable, in practice only colorimetric changes can be used to detect the presence of PGA.
2. EXPERIMENT
2.1. Reagents
Chloroauric acid trihydrate (HAuCl4.3H2O) and CTAB was obtained from Thomas Baker, India and Molychem, India respectively. Penicillin G (pen G) was obtained from Hindustan Antibiotics Limited, Pune, India. Enzyme penicillin G acylase (PGA) was purified from the gram-positive bacteria Arthrobacter viscosus (ATCC 15294). The enzyme was produced extracellularly in the culture broth. The cells were separated by centrifugation, and the clear broth was used for further purification by hydrophoric chromatography (octyl sepharose) followed by anion exchange chromatography (Q-sepharose). Purity of the enzyme was checked by native as well as SDS-PAGE (not shown for the brevity). The concentration of enzyme used was 0.7 mg/ml, so in 10 µl of solution, 7 µg of enzyme is present.
2.2. CTAB Capped Gold Nanoparticles
CTAB capped gold nanoparticles were synthesized by reducing aqueous solution of 5 ´ 10-4 M HAuCl4 (10 ml) containing 0.2 M CTAB with 1 ´ 10-2 M ice cold NaBH4 (0.6 ml). The solution was stirred for 3 hours and then kept at room temperature for 3 days. 10 ml of enzyme solution was added to 2 ml of gold nanoparticles solution followed by addition of 100 ml of substrate pen G (100 mg/ml). The solution was kept at 40 deg for 10 min. Absorption spectra were recorded after each step.
2.3. PGA Enzyme Assay
The enzyme activity of PGA was determined by measuring the amount of aminopenicillic acid (6-APA) produced in a reaction mixture containing 10 mg ml-1 penicillin G in 0.1 M phosphate buffer, pH 7.0, when incubated at 40˚C [36]. The 6-APA produced was estimated spectrophotometrically at 415 nm, after reaction with p-dimethylaminobenzaldehyde (PDAB), according to [7], modified by [37]. One unit of PGA activity is defined as the amount of enzyme required to produce 1 μmole of 6-APA per minute under the assay conditions (40˚C and pH 7.0)
2.4. Characterization
Absorption spectra of the samples were recorded in solution form on Perkin Elmer lambda 950 instruments in the range 200 to 800 nm. TEM images are acquired on Philips CM200 instrument with an accelerating voltage of 120 KV. For TEM analysis, samples were drop coated on copper grids and were allowed to dry for 45 minutes.
3. RESULTS AND DISCUSSION
CTAB capped nanoparticles have rarely been investigated for biosensing purposes due to the fact that CTAB bilayers are not easily displaced by biomolecules and hence are difficult to handle as far as bioconjugation is concerned. On the other hand, CTAB capped nanoparticles are chemically more stable and would have a longer shelf life. In the present report we could observe the reaction between enzyme penicillin G acylase (PGA) and pen G in the solution of CTAB capped gold nanoparticles.
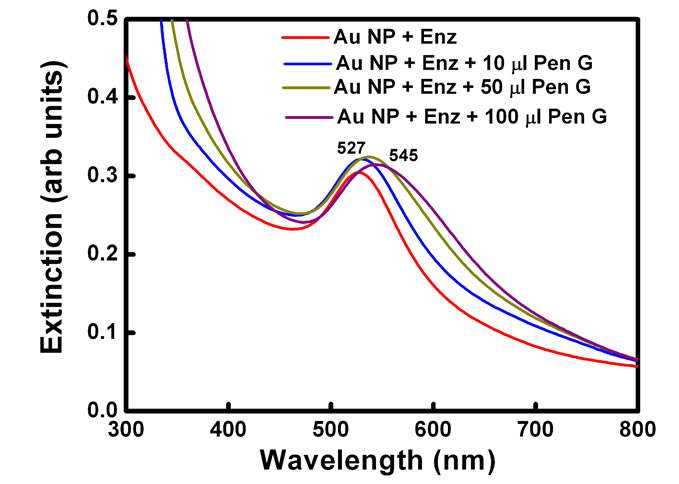
Plasmon resonance band of CTAB capped gold nanoparticles was observed at 527 nm. Gold nanoparticles synthesized here are covered with a bilayer of CTAB [38]. Inner layer is bound to the gold surface via the headgroup and is connected to the outer layer through the hydrophobic interactions while the headgroups of the outer layer are in the aqueous medium. Headgroup of the CTAB chain consists of an amine group. Hence, protonated amine group is present on the outermost surface of CTAB capped gold nanoparticles. No change in the absorption peak position of the gold was observed on addition of enzyme PGA (10 µl, 0.7 mg/ml). However, on addition of 100 ml of pen G (100 mg/ml), the plasmon band shifted from 527 nm to 545 nm (Figure 1(a)). After the addition, the solution was kept at 40˚C for 10 min to allow the reaction to occur completely. The experiment was also performed with different concentration of enzymes (Figure 1(b)). The red shift was found to gradually increase on increasing the concentration of enzyme from 0.007 mg/ml to 0.7 mg/ml. The concentration of pen G in this case was same as in Figure 1(a) i.e 100 mg/ml. The spectral shifts are thus sensitive for enzyme concentration as low as 0.007 mg/ml. Figure 1(c) shows gradual shifts in the plasmon band as the amount of pen G is increased from 10 to 100 ml (1 to 10 mg of pen G). The extinction spectrum started changing after an addition of 10 ml of pen G and on addition of 100 ml pen G it red shifted by 18 nm. The total red shift obtained after adding 100 ml of pen G varied in the range of 17 to 23 nm on repeating the experiment several times. Also, the spectrum was recorded four hours after the addition of pen G (Figure 1(d)). The plasmon band was found to be gradually shifted towards the longer wavelength (572 nm) and decreased in intensity. The gradual shift in the absorption band is attributed to slow removal of remaining CTAB layers from gold nanoparticles. After the complete displacement of CTAB,
 (a)
(a)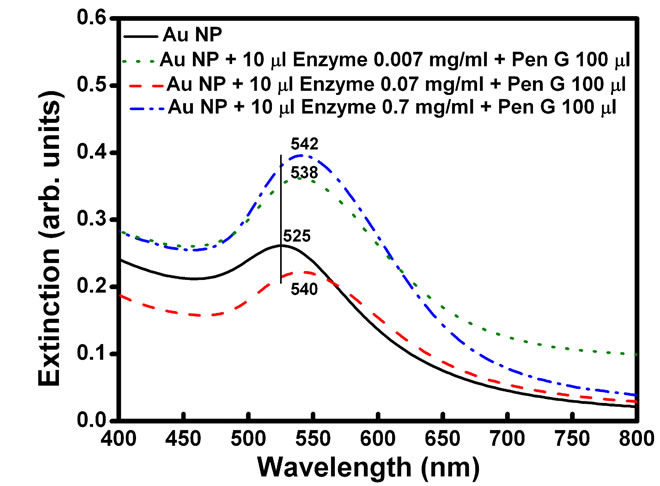 (b)
(b)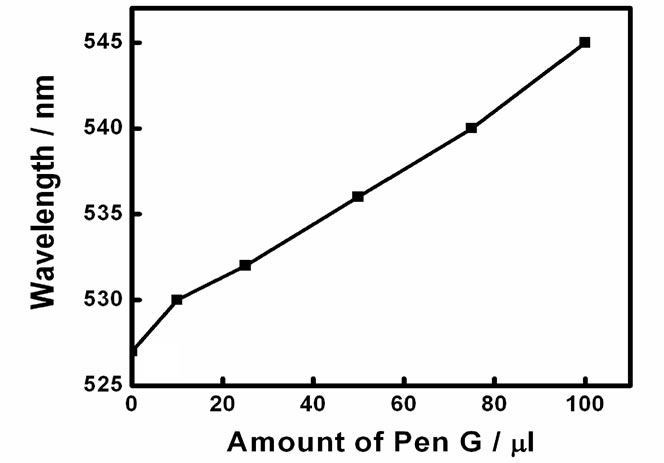 (c)
(c)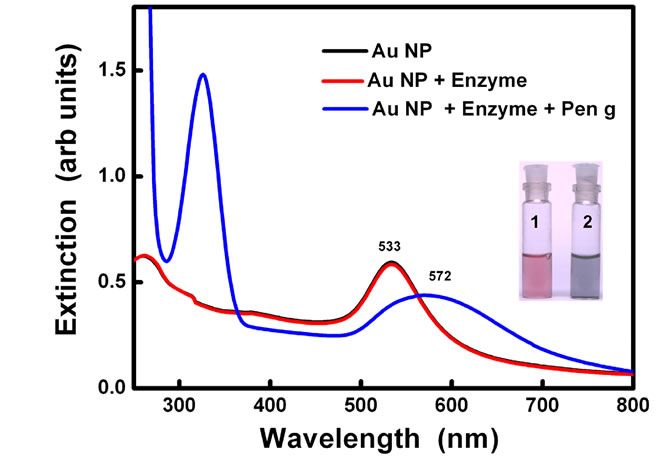 (d)
(d)
Figure 1. (a) changes in spectra on addition of different amounts of Pen G when the enzyme conc. is 0.69 mg/ml, (b) Changes in spectra after addition of different conc. of enzyme when the Pen G concentration is 100 mg/ml (c) Shift in extinction maximum of Au nanoparticles Vs. amount of Pen G (100 mg/ml) and (d) Spectra acquired after 4 hour of addition of Pen G. Inset shows change in the color of the Au nanoparticle solution (1) before and (2) after the enzyme-pen G addition.
the particles precipitate at the bottom of the bottle leaving clear supernatant. Peak at 322 nm is attributed to the absorption due to the penicillin G. Broadening of plasmon band along with decrease in the extinction intensity was also observed.
The spectral shifts in the surface plasmon band are accompanied by changes in the color of gold nanoparticle solution from red to blue (Figure 1(d) inset). Color of the solution started changing from red to dark pink after an addition of 10 µl of the pen G. However, on the addition of 25 µl Pen G, the color was purple. The purple color intensified on further addition of pen G. The figure shows the change in color after adding 100 µl of pen G.
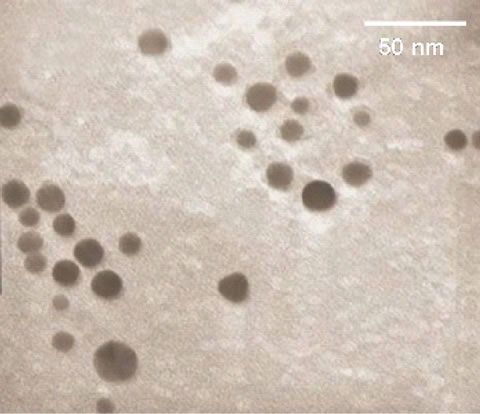
The prominent shift in the plasmon band of gold nanoparticles can be attributed to the aggregation of nanoparticles. Figure 2 shows TEM images of gold nanoparticles before and after the addition of the enzyme and the pen G. Size of gold nanoparticles was found to be ~15 nm. Particles are well dispersed before the addition of enzyme and pen G. On addition of the enzyme and pen G to gold nanoparticle solution, aggregation of particles is observed. TEM image, red shift in the plasmon band and the color change in the gold nanoparticle solution together indicate aggregation of gold nanoparticles.
Reaction occurring between the enzyme and the pen G is schematically shown in Scheme 1. PGA specifically catalyses the hydrolysis of the amide bonds in pen G. Cleavage of amide bond in pen G by PGA is accompanied by the formation of 6-aminopenicillanic acid (6-APA) and phenylacetic acid (PAA).
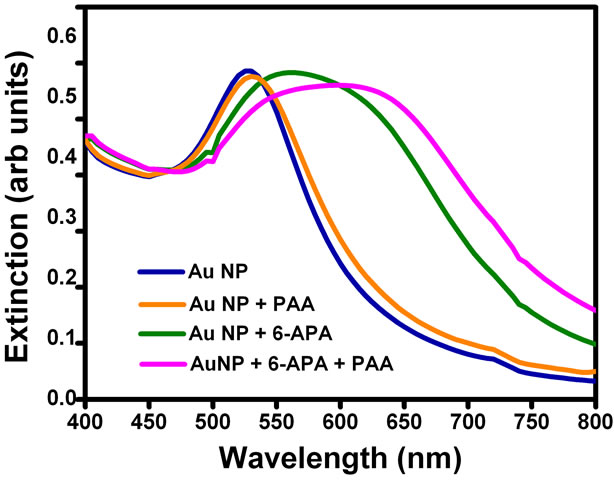
In order to confirm the mechanism of aggregation of gold nanoparticles due to enzyme-pen G reaction, we added just the products of this reaction to the solutions. 6-APA, PAA and mixture of 6-APA and PAA were added separately to the nanoparticle solutions in the absence of enzyme and pen G, and spectral changes were recorded (Figure 3). Interestingly, the color changes were obtained in the presence of 6-APA only. PAA (100 µl, 2.5mM) alone was not able to induce the color changes (Figure 3(b)). On addition of 6-APA (100 µl, 2.5 mM), no change in the spectral peak position was obtained
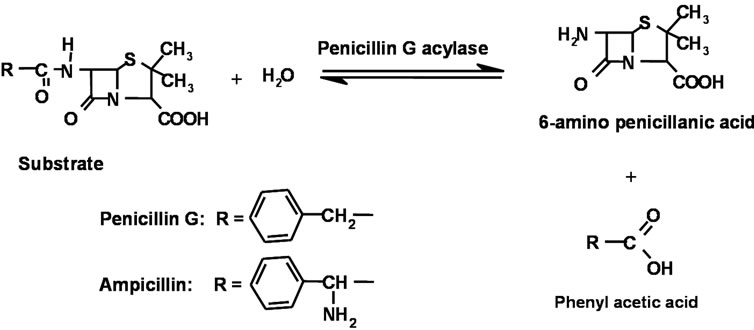
Scheme 1. Penicillin G Acylase catalysed hydrolysis of Penicillins.
 (a)
(a)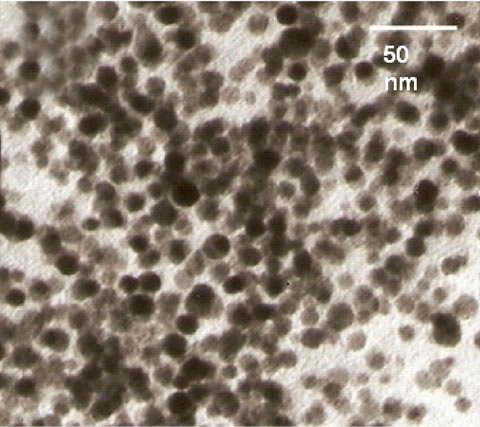 (b)
(b)
Figure 2. TEM images of (a) gold nanoparticles and (b) gold nanoparticles + enzyme + substrate.
immediately, however the plasmon band shifted from 527 to 565 nm after keeping the solution for two hours. Addition of mixture of 6-APA and PAA (same concentrations as mentioned above) to gold nanoparticle solution caused the plasmon band to shift from 527 to 545 nm immediately and to 600 nm finally after three hours. This was also accompanied by broadening of the plasmon band. This trend is very much similar to that obtained in the presence of enzyme and substrate pen G (see Figure 1). The spectral and colorimetric changes were obtained immediately when both acids were together added to the gold nanoparticle solution, which is also happening when the reaction is done in the presence of enzyme and the pen G. This indicates that the gold nanoparticles are sensing hydrolysis of the pen G. Hence, the combination of acids produced during the hydrolysis and the amount of 6-APA produced should be the key factor in determining the spectral and colorimetric changes produced in the nanoparticle solution due to the enzyme-substrate chemistry. This is further supported by the fact that the extent of red shift increases when we increase the concentration of enzyme PGA (Figure 1(b)). This is due to the increase in the amount of 6-APA produced.
The mechanism of sensing hydrolysis reaction can be
 (a)
(a)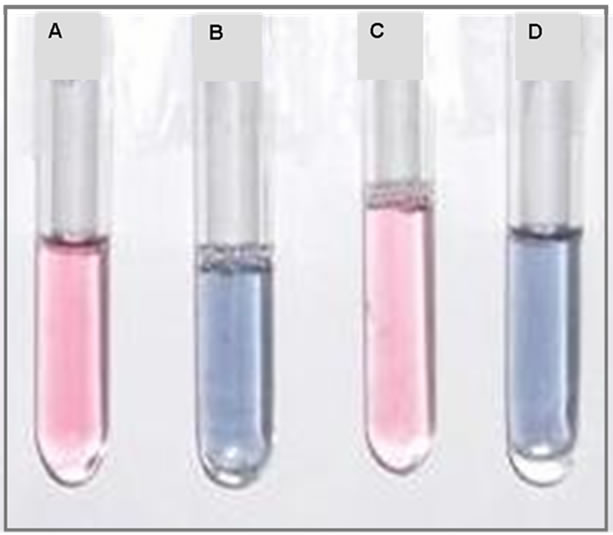 (b)
(b)
Figure 3. (a) UV-Vis spectra of gold nanoparticles, gold nanoparticles + PAA, gold nanoparticles + 6-APA and gold nanoparticles + 6-APA + PAA and (b) Photograph of (A) gold nanoparticles (B) gold nanoparticles + 6-APA (C) gold nanoparticles + PAA and (D) gold nanoparticles + 6-APA + PAA.
explained by Scheme 2. As mentioned earlier, a CTAB bilayer is present on the surface of gold nanoparticles such that N+ group are present on both the ends. This bilayer is responsible for the stable dispersion of gold nanoparticles in the solution. When pen G is added to gold nanoparticle solution in presence of enzymes, specific interaction between enzyme and pen G occurs, leading to hydrolysis of pen G and formation of 6-APA and PAA. Since the colorimetric changes are obtained only after the addition of pen G, we propose that electrostatic interaction between CTAB and the products of hydrolysis (6-APA and PAA) cause partial removal of CTAB bilayer from gold nanoparticles leading to a decrease in their surface potential and hence aggregation. The dependence of the interparticle distance on the surface plasmon band of metal nanoparticles is well known [23,24]. Aggregated or assembled nanoparticles display red shift in the plasmon band when compared to the isolated gold nanoparticles. This phenomenon is attributed to the coupling between the dipole modes of plasmons of different particles. As the interparticle distance is decreased, more red shift in the plasmon band is observed due to an increase in the extent of coupling. A decrease in the interparticle distance after the completion of enzyme–pen G reaction is clearly observed in the TEM images (Figure 2). Along with the coupling of plasmon modes, contribution to the red shifting of plasmon band also comes from increased scattering of nanoparticle aggregates in the longer wavelength region [25].
Some of the previously reported work [1] have used thiol containing Cys functionalized gold nanoparticles and an assembly directing actuator to control the assembly of nanoparticles through pi-stacking interactions. Upon hydrolysis by enzymes, disassembly was observed due to increased repulsion between NH3+ groups and removal of the hydrophobic interactions between the actuator. This disassembly caused blue shift in the extinction spectrum of gold nanoparticles. It is noteworthy that we have not used any assembly directing ligand to control the assembly of gold nanoparticles. Also, in our case, the cleavage of pen G is actually leading to a red shift in the plasmon resonance band. This indicates that the products formed by the enzyme pen G reaction decrease the electrostatic repulsion between particles causing their aggregation.
In order to check the effect in the absence of enzyme PGA, UV-Vis spectrum of gold nanoparticles was acquired when the Pen G was added to the gold nanoparticle solution without enzyme PGA in it (Figure 4). 100 ml of pen G was added to 2 ml of gold nanoparticle solution and spectrum was recorded. On addition of penicillin G, spectral shift of only 2 nm was observed indicating that the aggregation is induced only by the product of enzyme–substrate reaction and not just by the presence of pen G. No change in the color of the solution was immediately observed in this case.
The activity of enzyme was also checked by estimating the amount of 6-aminopenicillanic acid (6-APA) in the reaction. The enzyme was found to be active after the reaction.
Same experiments were performed by changing the penicillin in the reaction (Figure 5). Instead of pen G, ampicillin was added to the gold nanoparticle-enzyme solution. Ampicillin differs from the Pen G in the sense that one extra amino group is present on a-carbon (Scheme 1). Enzyme penicillin acylase has less affinity towards ampicillin as compared to pen G. The reason for this lies in the action of the enzyme. The enzymes are folded in specific conformation with very unique active sites in which only particular penicillin can fit very
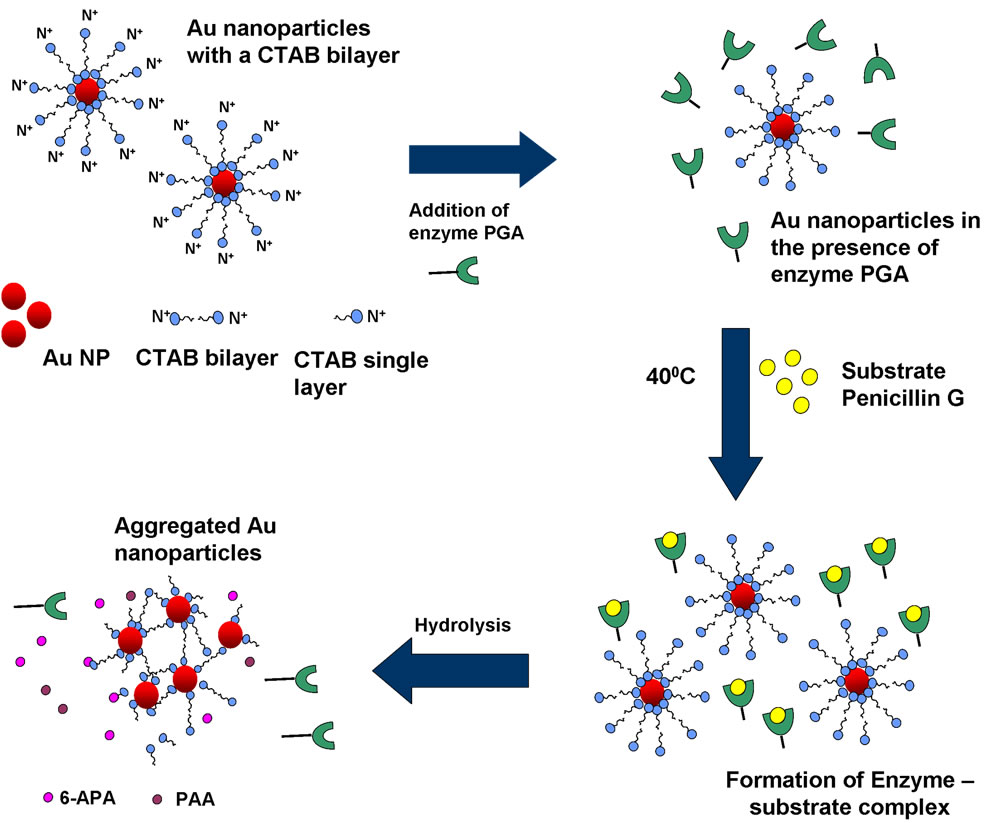
Scheme 2. Schematic showing the mechanism of detection of enzyme.
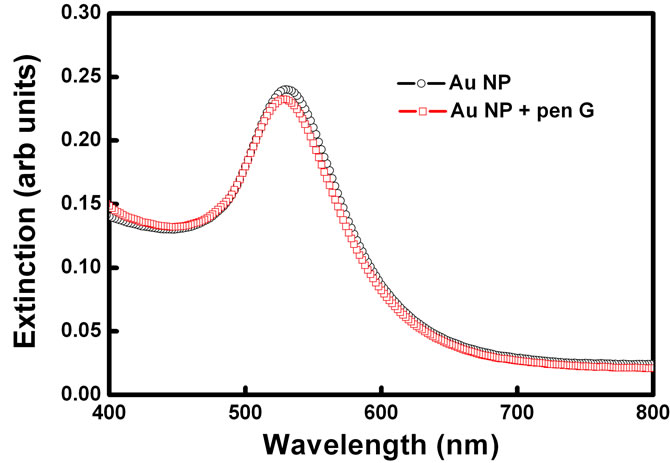
Figure 4. Absorption spectra of gold nanoparticles before and after addition of substrate Pen G in the absence of enzyme.
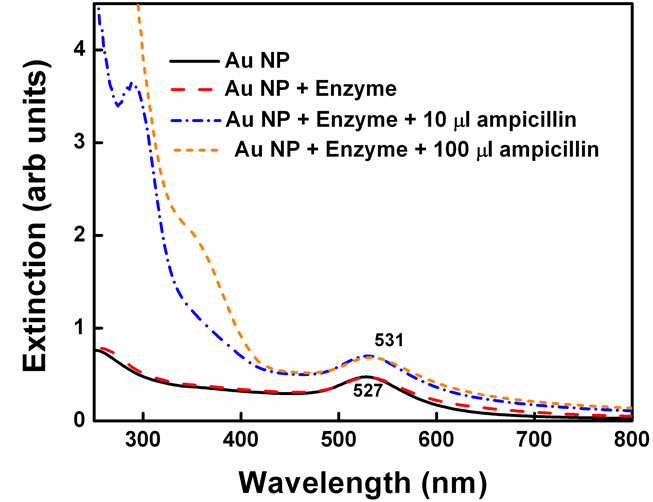
Figure 5. Spectral changes in gold nanoparticle-enzyme system on addition of ampicillin.
properly. Due to one extra amino group in ampicillin, the side chain becomes little bulkier compared to that in Pen G and cannot fit into the active site properly. Hence, PGA cannot react to the same extent on amide bond in ampicillin as it does with pen G and so it has less activity. Therefore, rate of enzyme penicillin complex formation is expected to decrease significantly. Indeed, in this case, the spectral shift obtained was only 5 nm and color changes were not obtained. Since, PGA catalyses the hydrolysis of pen G more efficiently than ampicillin, higher spectral shift was obtained in case of pen G.
4. CONCLUSIONS
In conclusion, we have reported here the colorimetric detection of Penicillin G acylase (PGA) without adding any chromogenic agent and eventually penicillin G (pen G) using CTAB capped gold nanoparticles. Gold nanoparticle aggregation is induced by interaction between PGA and pen G causing red to blue color shift of the gold nanoparticles. Aggregation of Au nanoparticles was confirmed by TEM. The aggregation was found to be caused by 6-aminopenicillic acid (6-APA), produced as a reaction product in the reaction. Also, the above effect was not observed in the absence of enzyme indicating that the aggregation of gold nanoparticles is caused by the enzymepen G reaction and not just by the presence of enzyme or pen G. To further confirm this, the experiment was also performed with another penicillin substrate (ampicillin) which is not a preferred substrate for PGA and it was observed that the spectral changes are less and slower. Quantity of enzyme, which could be detected, was 0.007 mg/ml in gold nanoparticles solution. Hence using gold nanoparticles, simple, rapid and colorimetric detection of PGA at low concentrations could be achieved by making use of enzyme-substrate chemistry. Apart from this, the system could also identify the presence of different penicillins (pen G and ampicillin) by showing different degrees of spectral shifts for them. This method will be useful to detect other impurities in the penicillins by change in the SPR.
5. ACKNOWLEDGEMENTS
N R Tiwari would like to thank DST, India for financial support. S K Kulkarni would like to thank DST, India, UGC, India for constant support. This project has been supported by DST, India and Indo-US (AOARD-06-4045) project.
REFERENCES
- Laromaine A., Koh L., Murugesan M., Ulijn R.V. and Stevens, M.M. (2007), Protease triggered dispersion of nanoparticle assemblies. Journal of the Amemirican Chemical Society, 129(14), 4156-4157.
- Guarise, C., Pasquato, L., De Filippis, V. and Scrimin, P. (2006) Gold nanoparticles based protease assay. Proceedings of the National Academy of Sciences, 14, 3978- 3982.
- Zhang, X., Guo, Q. and Cui, D. (2009) Recent advances in Nanotechnology applied to biosensors. Sensors, 9(2), 1033-1053
- Li, Y., Schluesener, H.J. and Xu, S. (2010) Gold nanoparticles based biosensors. Gold Bulletin, 43 (1), 29.
- Liu, R., Teo, W., Tan, S., Feng, H., Padmanabhan, P. and Xing, B., (2010) Metallic nanoparticles bioassay for Enterobacter cloacae P99 β-lactamase activity and inhibitor screening. Analyst, 135(5), 1031.
- Batchelor, F.R., Chain, E.B., Hardy, T.L., Mansford, K.R.L. and Rolinson, G.N. (1961) 6-Aminopenicillanic acid. III. Isolation and purification. Proceedings of Royal SocietyB: Biological science, 154, 498-508.
- Bomstein, J. and Evans, W.G. (1965). Automated colorimetric determination of 6-Aminopenicillanic Acid in fermentation media. Analytical Chemistry, 37, 576-578.
- Sjoberg, G., Nathorst-Westfelt, L. and Ortengreen, B. (1967). Enzymatic hydrolysis of some penicillins and cephalosporins by Escherichia coli acylase. Acta Chemica Scandinavica, 21(2), 547-551.
- Baker, W.L. (1980). A note on the detection of penicillin acylase activity in Escherichia coli by the reaction of ampicillin with Buiret Reagent. The Journal of Applied Bacteriology, 49(2), 225-229.
- Mulvaney, P. (1996). Surface plasmon spectroscopy of nanosized metal particles. Langmuir, 12, 788-800.
- Riboh, J.C., Haes, A.J., McFarland, A.D., Yonzon, C.R. and Van Duyne, R.P. (2003). A nanoscale optical biosensor: real-time immunoassay in physiological buffer enabled by improved nanoparticle adhesion. The Journal of Physical Chemistry B., 107, 1772-1780.
- Nusz, G., Marinakos, S., Curry, A., Dahlin, A., Hook, F., Wax, A. and Chilkoti, A. (2008) Label-Free plasmonic detection of biomolecular binding by a single gold nanorod. Analytical Chemistry, 80(4), 984-989.
- Storhoff, J.J., Mucic, R.C., Letsinger, R.L. and Mirkin, C.A.. (1997). Selective colorimetric detection of polynucleotides based on the distance-dependent optical properties of gold nanoparticles. Science, 277(5329), 1078-1080.
- Kalele, S.A., Ashtaputre, S.S., Hebalkar, N.Y., Gosavi, S.W., Deobagkar, D.N., Deobagkar, D.D. and Kulkarni, S.K. (2005). Optical detection of antibody using silica-silver core-shell particles. Chemical Physics Letters, 404(1-3), 136-141.
- Kalele, S.A., Kundu, A.A., Gosavi, S.W., Deobagkar, D.N., Deobagkar, D.D. and Kulkarni, S.K. (2006). Rapid detection of escherichia coli by using antibody-conjugated silver nanoshells. Small, 2(3), 335-338.
- Jena, B. and Raj, C. (2008) Optical sensing of biomedically important polyionic drugs using nano-sized gold particles. Biosensors and Bioelectronics, 23(8), 1285- 1290.
- Hossain, M., Huang, G., Kaneko, T. and Ozaki, Y. (2009) Characteristics of surface-enhanced Raman scattering and surface-enhanced fluorescence using a singleand a double layer gold nanostructure. Physical Chemistry Chemical Physics, 11(34), 7484.
- Kneipp, K., Kneipp, H., Itzkan, I., Dasari, R.R. and Feld, M.S. (1999). Ultrasensitive chemical analysis by raman spectroscopy. Chemical Review, 99(10), 2957-2975.
- Aslan, K., Lakowicz, J.R. and Geddes, C.D. (2005). Metal-enhanced fluorescence using anisotropic silver nanostructures: Critical progress to date. Analytical and Bioanalytical Chemistry, 382(4), 926-933.
- Liu, J. and Lu, Y. (2004). Adenosine-dependent assembly of aptazyme-functionalized gold nanoparticles and its application as a colorimetric biosensor. Analytical Chemistry, 76(6), 1627-1632.
- Ulijn, R.V. (2006). Enzyme-responsive materials: a new class of smart biomaterials. Journal of Materials Chemistry, 16, 2217-2225.
- Fischer, N.O., McIntosh, C.M., Simard, J.M. and Rotello, V.M. (2002). Supramolecular chemistry and self-assembly special feature: Inhibition of chymotrypsin through surface binding using nanoparticle-based receptors. The Proceedings of the National Academy of Sciences, 99(8), 5018-5023.
- Storhoff, J.J., Lazarides, A.A., Mucic, R.C., Mirkin, C.A., Letsinger, R.L. and Schatz, G.C. (2000). What controls the optical properties of DNA-linked gold nanoparticle assemblies? Journal of American Chemical Society, 122, 4640.
- Brannigan, J.A., Dodson, G., Duggleby, H.J., Moody, P.C., Smith, J.L., Tomchick, D.R. and Murzin, A.G. (1995). A. protein catalytic framework with an N-terminal nucleophile is capable of self-activation. Nature, 378(6555), 416-419.
- Duggleby, H.J., Tolley, S.P., Hill, C.P., Dodson, E.J., Dodson, G.G. and Moody, P.C.E. (1995). Penicillin acylase has a single aminoacid catalytic center. Nature, 373, 264-268.
- Arroyo, M., de la Mata, I., Acebal, C. and Pilar Castillôn, M. (2003). Biotechnological application of penicillin acylases: State-of-the-art. Applied Microbiology and Biotechnology, 60(5), 507-514.
- Phadtare, S., Parekh, P., Gole, A., Patil, M., Pundle, A., Prabhune, A. and Sastry, M. (2002). Penicillin G acylase-fatty lipid biocomposite films show excellent catalytic activity and long term stability/reusability. Biotechnology Progress, 18(3), 483-488.
- Fadnavis, N.W., Sharfuddin, M. and Vadivel, S.K. (1999). Resolution of racemic 2-amino-1-butanol with immobilised penicillin G acylase. Tetrahedron Asymmetry, 10(23), 4495-4500.
- Van Langen, L.M., Oosthoek, N.P., Guranda, D.T., van Rantwijk, F., Svedas, V.K. and Sheldon, R.A. (2000). Penicillin acylase-catalyzed resolution of amines in aqueous organic solvents. Tetrahedron Asymmetry, 11(22), 4593.
- Shaikh, K., Talati, P.G. and Gang, D.M. (1973). Spectrophotometric method for the estimation of 6-aminopenicillanic acid. Antimicrobial Agents and Chemotherapy, 3, 194.
- Daumy, G.O., McColl, A.S. and Apostolakos, D. (1982). Repression of penicillin G acylase of Proteus rettgeri by tricarboxylic acid cycle intermediates. The Journal of Bacteriology, 152(1), 104.
- Tewari, Y.B. and Goldeberg, R.N. (1988). Thermodynamics of the conversion of penicillin G to phenylacetic acid and 6-aminopenicillanic acid. Biophysical Chemistry, 29(3), 245-252.
- Szewczuk, A., Siewinski, M. and Slowinska, R. (1980). Colorimetric assay of penicillin amidase activity using phenylacetyl-aminobenzoic acid as substrate. Analtical Biochemistry, 103(1), 166-169.
- Chiang, D. and Bennet, R.E. (1967). Purification and properties of penicillin amidase from bacillus megaterium. The Journal of Bacteriology, 93, 302-308
- Kutzbach, C. and Rauenbusch, E. (1974). Preparation and general properties of crystalline penicillin acylase from Escherichia coli ATCC 11105. Hoppe-Seyler's Zeitschrift für physiologische Chemie, 355, 45-53.
- Balasingham, K., Warburton, D., Dunnill, P. and Lilly, M.D. (1972). The isolation and kinetics of penicillin amidase from Escherichia coli. Biochimica et Biophysica Acta, 276(1), 250-256.
- Shewale, G.J., Kumar, K.K. and Ambekar, G.R. (1987). Evaluation of determination of 6-aminopenicillanic acid by p-dimethyl aminobenzaldedyde. Biotechnological Techniques, 1, 69-72.
- Nikoobakht, B. and El-Sayed, M.A. (2007). Evidence for bilayer assembly of cationic surfactants on the surface of gold nanorods. Langmuir, 17, 6368-6374.