Modern Economy
Vol. 3 No. 3 (2012) , Article ID: 19168 , 8 pages DOI:10.4236/me.2012.33043
Public Expenditure Contribution to Pro-Poor Growth in Cote d’Ivoire: A Micro Simulated General Equilibrium Approach
University of Cocody, Abidjan, Cote d’Ivoire
Email: wautabouna@yahoo.ca
Received February 8, 2012; revised March 1, 2012; accepted March 19, 2012
Keywords: Public Expenditure; Pro-Poor Growth; Micro Simulated General Equilibrium
ABSTRACT
The purpose of the present study is to analyze the public expenditure contribution to the improvement of the profitable economic growth to the poor in Cote d’Ivoire. The paper tried to show out the explanatory power of the government actions concerning the poor populations’ well-being. This reflection is based on a micro simulated general equilibrium analysis with the data provided by the national institute of the statistical (INS). These data are obtained from the investigations achieved on the households’ level of the lives. The results of the study suggest that the Ivorian authorities contributed meaningfully to the reduction of poverty severity. In other words, the poor benefited from fruits of the economic growth induced by the public investments.
1. Introduction
Till the 70s, poverty was generally considered as the state wherein a person is below a minimum threshold of supply in food, income or consumption [1]. This limited point of view is outdated today for the specialists in social sciences as well as for organizations and development economists [2]. A great importance is given to the way the poor consider their own situation and the way poverty is conceived within different cultures. It is more and more admitted that the poor is the person who doesn’t meet the minimum conditions as it is understood within societies throughout the world. Ravallion and Datt [3] noticed that, such a definition takes into account the public interventions in primary education, basic medical cares, road maintenance in rural areas, water conveyance/sewage and the target populations. These variations of the characteristics and dimensions of poverty show how much it is important to conduct rigorous analyses which use different sources in order to intervene appropriately. The question is to know if the poor’s needs could be detected. In this case, what means must be used in order to relieve the lower-income groups? To specify, understand and explain the government interventions in the fight against poverty are the main centres of interest of this study.
An analysis of the impact of poverty and the specific investigations led among the target cross-sections are seen as the appropriate solutions [4]. Similarly, Start [5] believes that the rationality of the public expenditures and their optimal assignment appear as efficient means to reduce inequalities and the poverty of populations. The debate today lies in the nature and the relevance of the government intervention. How can public expenditures reduce poverty through economic growth? The positive correlation between the public expenditures and the economic growth has been underlined in the works of Barro [6], Devarajan et al. [7]. However, is it possible to assert that this growth is profitable to the poor? Is “pro-poor” growth established in Cote d’Ivoire?
That’s why this study intends to shed light on the explanatory power of government actions as regards poverty reduction by means of the economic growth level. Numerous economists were interested in this concept in their publications. For Kraay [8], a public expenditure leads to a qualified growth of “pro-poor” when it is more profitable to the poor than to the wealthy or when it gives to the poor a profit percentage higher than its contribution in the national income. From then on the “pro-poor’ growth is lies in a better distribution of the unequal public expenditures and a cancellation of expenses which are only profitable to a small group of privileged.
Like developing countries throughout the world, the Ivorian authorities have made the fight against poverty one of the major concerns in their development program. This study is divided into many parts. In the second section, a report of poverty development in Cote d’Ivoire is presented. It is followed by the third section which deals with the review of the literature. The methodological aspects are discussed in the fourth section and the results stemming from the simulations are contained in the fifth section. The last section summarizes the paper.
1.1. The Growth of Poverty and Inequalities in Cote d’Ivoire
Estimated at 18 millions of inhabitants, about 15.5% of the population of Cote d’Ivoire lives below poverty line [9]. In other words, more than 2.5 million people live there with less than one dollar a day. In 2003, on the basis of the human development indicator (IDH), this giant of the West Africa Economic and Monetary Union (WAEMU) ranked 163 out of 177. Likewise, the human development indicator (IPH) which takes into account the deficit registered in three main fields of human existence (life expectancy, level of education, living condition), states that a ratio of 48% of the Ivorian population is affected by the different forms of poverty. This inventtory of fixtures reveals a lot about the difficult socioeconomic situation in which Cote d’Ivoire is since the end of the nineties.
The data about poverty and inequalities evolution in Cote d’Ivoire are given by the national institute of statistics (INS). From 1975 to 2002, this establishment realized many national surveys about households among which, the most recent was called “survey on the living standards of households”. The main variables studied are related to the composition of the household, education, health, accommodation, transportation, activities and employment, expenses, consumption, etc.
The most used measures of poverty are those developed and suggested by Foster, Greer, Thorbecke [10]. They are also called “p-alpha” index or “FGT” index. The statistics of this indicator in relation with Cote d’Ivoire are given in the following tables The abbreviations EPAM, DSA and ENV mean respectively permanent household survey, priority survey on the social dimensions of structural adjustment and survey on the living standard of households. The urban area is represented by the metropolis of Abidjan and the other inland towns; the rural area takes into account the eastern rural forest, the western rural forest and the rural savanna. Table 1 shows the evolution of poverty from 1985 to 2002. In a global way, the data indicate that the population of poor people has regularly increased in Cote d’Ivoire. Estimated at 10% on average in 1985, the population of poor people reaches its peak at around 38.4% in 2002.
Which amounts to saying that two persons out of five are poor. This phenomenon of pauperization therefore increased by14.3% from 1998 to 2002. Owing to the socio-political crisis that took place during the last quarter of the year 2002, the numerical index of poverty
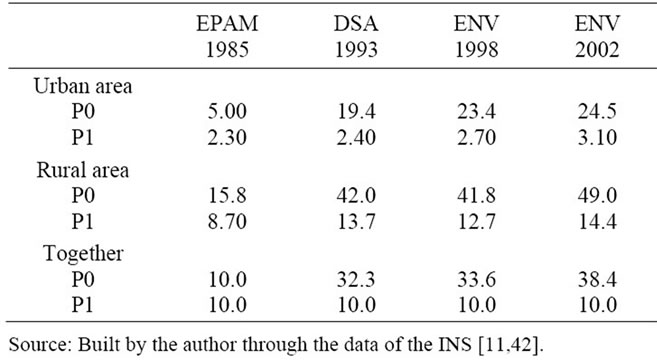
Table 1. The measure in percentage of FGT type poverty.
must be revised upwards. This tendency will be logically confirmed by the next survey about the living standards of Ivorian households. Poverty is rampant in the urban area with 25% of poor as well as in the rural area where one individual out of two is poor.
Information about poverty depth emphasizes a constant growth during the period going from 1985 to 2002. Around 10% of the Ivorian population is still living in extreme poverty conditions for around 20 years. More than 14% of the rural population is not able to satisfy his consumption needs (food, health care, education, rent, water, electricity, fuel, transportation fees, clothes…).
The analysis of poverty growth brings out deep disparities by layer and by area. The inequalities according to poverty status and the residence area in Cote d’Ivoire are very important. The genuine expenses apiece in an Ivorian household are put together into 15 items. The examination of these different items permits a better appreciation and interpretation of the indexes or coefficients of Gini reports for the inequalities as regards the expenses for the year 2002. According to statistics, it is important to notice that there are strong inequalities in genuine expenses of the populations when the status of poverty or the living standard is taken into consideration. Indeed, the indexes relative to the status of poverty are practically the same from an area to another. However, inequalities are reinforced among the poor and the rich respectively with 0.181 and 0.431. They also are strengthened in rural area as well as in urban area [11]. These numbers testify about the high level of this inequality measure in all the regions of Cote d’Ivoire despite the continuous and regular rise in governmental expenditures. The Ivorian current expenditures amounted to 14.7% of the gross domestic product (GDP) in 1990 against 24.2% in 2005 [12]. The economic situation of the end of the 1970s, the failure of the structural adjustment program (PAS) of the 1980s, the devaluation of the CFA franc in 1994 and the varied reflationary policies continue to affect the growth evolution which alternates at the same time with positive and negative rates.
After describing the context of this study and doing a brief presentation of the inequalities and poverty evolution in Cote d’Ivoire, it seems important to conduct a reflection about the review of the existing literature in relation with this topic.
1.2. The Literature Review
A “pro-poor” growth promotion—whose rhythm and conditions improve the poor’s ability, men and women, to participate in the economic activity and to derive an advantage from it—will be essential to durably get the countries out of poverty and reach the millennium objectives for the development [13]. Why has growth succeeded in reducing poverty in some countries and not in others? How can the poor participate in the economic growth process and take advantage of it? Why the growth favorable to the poor is important and how can the backers promote it? These are in substance the questions whose answers will constitute the essential of that literature review.
The theories which present the public expenditures as the motor of the economic growth do not win unanimous support among the research workers and the economists. Thus, authors like Dhanasekaran [14], Gills et al. [15], Ott [16] and Button et al. [17] conclude in their works that public expenditures do not contribute to an improvement of the growth rate in the developing countries. Moreover many are the analysts like Del Monte and Papagni [18], Sahn and Younger [19], Berg et al. [20] or even Rosner [21] who clearly assert that public expenditures explain the economic growth in a positive way.
Devarajan et al. [7] was one of the first to use the concept of unproductive and productive public expenditures. This last specificity permits to characterize the expenditures likely to affect in a positive and significant way the growth of the gross domestic product in the short-andmedium-term. Public expenditures which are described as unproductive in the short-term are considered productive in the long-term. The works of Kakwani [22] and those of Ravallion and Chen [23] go further by putting into relationship in an empirical way economic growth and poverty. The contradictory opinions about the nature and the meaning of the correlation between those two economic notions continue to feed the debates wherein arguments outdo each other in relevance.
Thus the reflections of Sahn and Younger [24] have permitted to show that the fruits of the economic growth induced by the expansionist budgetary policies have globally been profitable to the poor in sub-Saharan Africa. That conclusion is shared by Mwabu and Thorbecke [25] in a study where the concerned population was essentially living in the rural area. Like these authors, Deininger and Okidi [26] for an analysis about the Ugandan economy and Amaghionyeodiwe and Osinubi [27] for Nigeria, have scientifically established that the economic policies as regards public expenditures have contributed to ameliorate both the economic growth level and the welfare of the poor populations. Gunter et al. [28] explain, in an article, a more global analysis about the public interventions and their ability to reduce the numerical index of poverty. In addition to supporting the point of view of Ravallion and Chen [23], Gunter et al. [28] explain that the only public expenditures could not hold up the growth profitable to the poor. They think that in order to fight efficiently against poverty, it is better to combine the actions and economic policies in several domains.
The “pro-poor” growth deriving from public expenditures is a reality in some developing countries, however the works of other analysts seem to call this thesis into question. It is the case of Fieldo [29] who, in a comparative study of the African economies, believe that the poor are not the beneficiaries of the fruits of growth. The petty bourgeoisie takes around 65% of the government revenue.
The infrastructure projects relating to education, accommodation and health hardly ever reach their term. Likewise, in the Indonesian model, Suryahadi et al. [30] explain that the inequalities between populations, as regards expenditures, have become more pronounced and the poverty rate keeps increasing despite the government efforts deemed inadequate. The publication of Gupta and Mitra [31] comes to confirm the theory according to which public interventions aiming at poverty reduction remain marginal and inaccurate. In those conditions, one of the solutions is to be found in microfinance [32,33].
Concerning Cote d’Ivoire, many economists have been interested in the phenomenon of urban and rural poverty [34,35]. The latter was interested in an analysis of longterm unemployment. For him, professional inactivity could be the cause of poverty. However, he doesn’t explain the strategic role of the Ivorian public expenditures as a means of pauperization reduction. Barrett [36] also led thoughts on the Ivorian model. In a comparative study with Cote d’Ivoire, he justifies the best results achieved in Kenya as regards fight against poverty, through the relevance of social projects and the institution of a wealth redistribution system profitable to the poor through the creation of basic infrastructures.
As it can be noticed, the public expenditures contribution to the pro-poor growth doesn’t win unanimous support among the scientists and researchers. According to the way country is considered, the continent or even the leaders, the strategies of fight against poverty and the pursuit of the well-being of the poor populations are perceived and brought into play in a different way. That’s why that paper wants to be a contribution to the analysis of the government actions impact on the numerical index of poverty in Cote d’Ivoire. Thus, a theoretical and methodological scope is exposed in order to get empirical results which will be subject to interpretation.
2. The Methodological Approach
The empirical works with poverty as centre of interest abound [37,26]. Concerning the analysis of economic policies impacts on a given economic notion, the quantitative simulation of the effects is adequate only if the practitioner resorts to estimable models of general equilibrium [38]. The micro-simulated general equilibrium approach is inspired by the works of Dorosh and Sahn [39] and those of Cockburn [40]. This technique is better known under the abbreviation of PAMS (Poverty Analysis Macroeconomic Simulator). It is about an econometric model that links a coherent macroeconomic model or macroeconomic scope to an employment/poverty [41]. The PAMS have the advantage to be one of the best instruments used in the review of fiscal and budgetary policies impact and the exogenous crisis on the individual household. The model requires national accounts (broken down by sector) and some Survey data close by households, containing statistics about the income or the expenditures of households and a breakdown of employment salaries by sectors. All the data are provided by the National Institute of Statistics [11,42].
Models
Ravallion and Chen [23] defined the pro-poor growth rate, RPPG rated, as being the area located below the growth effect curve (CIC) up to poverty rate. If  is considered as the real consumption growth rate for the percentile p of the distribution and
  the poverty rate at the initial point in time (t), then the RPPG is:
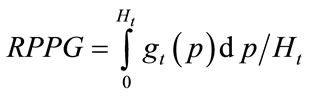 (1)
(1)
The pro-poor growth rate is therefore the average growth of the population consumption featuring below the poverty line. If  is a measure of poverty,
  the society average income or the cross-section concerned with the survey,
  the elasticity growth of income and
  the elasticity growth of public expenditures, the proportional variation of the households’ poverty is written:
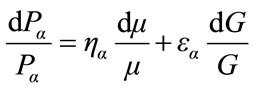 (2)
(2)
From that, the elasticity of global poverty ( ) is deduced by dividing the above equation by the average income growth rate.
 (3)
(3)
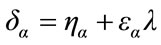
with 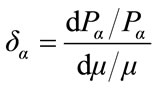 (4)
(4)
and 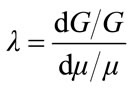 (5)
(5)
( ) measures poverty change percentage further to a variation of the growth rate by 1 percent. (
 ) measures the index of Gini change percentage further to a variation of the growth rate by 1 percent. Thus, when (
 ) is positive (negative) the growth process is followed by an increase (reduction) of inequalities. Which amounts to saying that the growth will be qualified as “pro-poor” whenever (
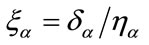
 ) is negative. Kakwani and Pernia [4] deduce the “pro-poor” index from it, which index is defined as:
 (6)
(6)
If Equation (3) is changed in Equation (6), Equation (7) is obtained,
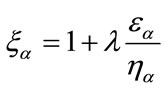 (7)
(7)
This index corresponds to the ratio of the elasticity of global poverty added to the elasticity of poverty growth. It indicates the existence of a “pro-poor” growth when . In other words, the results of growth as regards redistribution are proportionally more profitable to the poor than to the non-poor. If on the contrary,
  , the growth is not strictly “pro-poor” even if a reduction of poverty effect is witnessed. Finally when
 , economic growth leads to an increase in the state of poverty. If
 , then the economic growth level has no impact on poverty.
Poverty evolution is simulated under many growth hypotheses and according to the fact that this one is supposed to be pro-poor, neutral or on the contrary less favorable to the poor than to the rest of the population (in accordance with the values that  can take).
To simulate the effect of a growth that modifies the distribution of the incomes among the population, suppose that the Lorenz curve moves the following way:
 (8)
(8)
where L(P) is the percentage of the income owned by the first p percents of the population, when individuals are classified according to an ascending order of income. When  is positive, this relation implies that the Lorenz curve moves towards the bottom, otherwise inequality increases. This hypothesis is useful because it can be showed that
  is equal to the variation in percentage of the Gini coefficient. It only remains to link the evolution of the Gini index to that of the standard deviation of the income logarithm distribution (
 ) which is made possible through the following relation:
 (9)
(9)
This last equation is established under the hypothesis that the distribution is log-normal. The setting of the probable values of  will be made through a PAMS type micro-simulation with data relative to Cote d’Ivoire.
The results of this study which are currently interpreted in the following paragraph should serve as recommendations to decision-makers of economic policies.
3. Results of the Study
3.1. Results of Simulations
Simulations are done according to several growth scenarios. They draw their inspiration from the works of Chen and Ravallion [43] who have carried out a similar exercise in the case of China. The first scenario (SIM1) postulates for the hypothesis that the considered variables are estimated with their observed levels. The second scenario (SIM2) is interested in the context of the induced effects by a possible rise in the public expenditures. The results of simulations are given in the following Table 2.
The following Tables 3 and 4 allow to better notice the winners and the losers further to SIM1.
3.2. Analysis of Results
What comments can those tables inspire?
In a global way, whatever the adopted scenario (SIM1 or SIM2), the economic growth in Cote d’Ivoire can be qualified as pro-poor because the two values of  are all superior to one. In other words, the Ivorian authorities
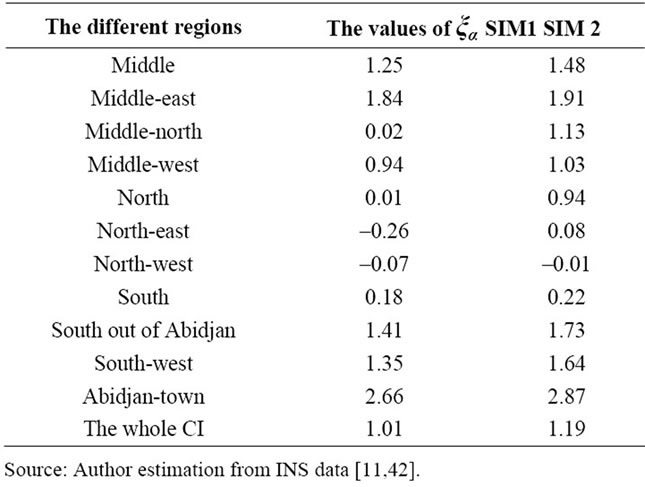
Table 2. The distribution the winners and the losers further to SIM1 and SIM2.
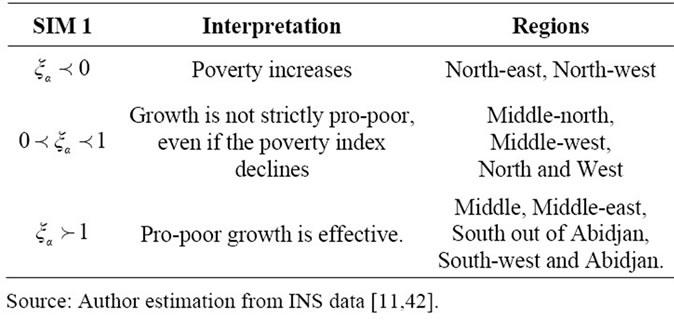
Table 3. The distribution of the regions according to SIM 1.
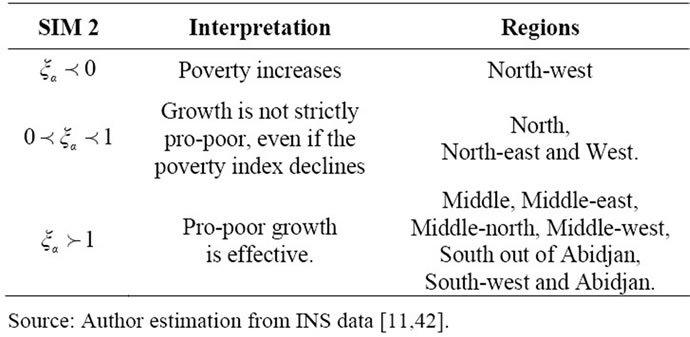
Table 4. The distribution of the regions according to SIM 2.
have carried out economic policies actions which open out onto the improvement of the well-being of the poor population. That conclusion is done if the simulation has been made from the observed levels of the variables in the scope of SIM1 with . Likewise, with the second scenario SIM2, it is proved that a possible increase of the public expenditures is profitable to the lower-income groups with
 .
.
In a specific way, the different areas haven’t uniformly benefited by the fruits of the economic growth. Those which remained on the fringe are essentially the region of the middle-north, the middle-west, the north, the northeast, the north-west and the west. They respectively have a ratio of the global poverty elasticity related to poverty growth elasticity with 0.02; 0.94; 0.01; –0.26; –0.07 and 0.18 through the first scenario.
The poor population of the north of Cote d’Ivoire has not really profited from the economic growth. A majority of them are kept busy by working in the fields which generate them paradoxically weak incomes. These weak incomes can be explained by the rise in the cost of the inputs and other pesticides and also by the reduction of the purchase price to the producer of the main agricultural products like cotton, cashew, etc. The socio-economic infrastructures are very few there. The roads and the village trails which are in an advanced stage of dilapidation could not permit to break down the opening up of some big villages.
Even if the results enable to observe a drop in the poverty index, they don’t support that the middle-west, the northern and the western regions register a pro-poor growth. The elasticity ratio of the global poverty is still included between zero and one. Therefore the growth isn’t strictly pro-poor.
Therefore, for the rest of the regions in Cote d’Ivoire, the results testify that the growth is pro-poor. This power of the authorities is particularly observed in the half-southern part of the country. Indeed, this big area gathers the most important part of the industrial and commercial activities, but above all, with the presence of the two big ports of Abidjan and San-Pedro. The southern part of Cote d’Ivoire is equipped with modern social and economic infrastructures which make this country one of the giants of the WAEMU zone. The economic activities prosper there and the distributed incomes are high. The public interventions are therefore productive because they support the economic growth and are profitable to the poor.
By considering the scenario (SIM2) and by taking into account the induced effects through a possible rise in the public expenditures, the results are partly modified. The hypothesis of the increase in the public expenditures has been accepted in the light of the theory of endogenous growth. This increase is inspired by the average annual growth rate of the public expenditures in Cote d’Ivoire.
With that second simulation, the analysis of the results shows a sensitive rise in the number of regions which are able to perform a pro-poor growth. Indeed, from five regions with the SIM1, Seven regions are obtained with the SIM2. Likewise, a possible increase in the public expenditures will allow the reduction of the number of regions where poverty is more noticeable, in comparison with table four. Only the north-western part seems less sensitive to the simulations because its poverty elasticity is smaller than zero. It is respectively by –0.07 and –0.01 with the SIM 1 and SIM 2. This can be explained by the difficult access to that area. It belongs to the scarce regions which are not crossed by the only existing railroad of Cote d’Ivoire. The great majority of roads are not asphalted and the other economic and social infrastructures are decrepit.
4. Conclusion
Our analysis has sought to analyze and understand the contribution of the public expenditures to pro-poor growth in Cote d’Ivoire. This paper has permitted to show that, whatever the adopted simulation scenario, economic growth in Cote d’Ivoire can be considered pro-poor. The economic policies implemented have resulted in an economic growth whose results were profitable to an important part of the poor. The study explicitly reveals that all the regions have not profited uniformly from the growth. Most of the northern regions record negative poverty elasticity or lower than one, contrary to those of the centre and the south. The simulation inspired from the hypothesis of an increase in public expenditures testifies to an improvement of the results because pro-poor growth is noticeable in an increasing number of regions. In comparison with those results, it is important to stress the necessity to fight against the deep regional disparities for a better social cohesion of populations. The authorities, who are responsible for the implementation of economic policies aiming at creating public infrastructures, should privilege the northern, the north-eastern, the north-western and the western regions. The rehabilitation of the basic economic and social structures in the above mentioned zone should deserve to be recorded among the priority projects as regards development strategies.
REFERENCES
- A. Epaulard, “Poverty Increase and Reduction in Developing Countries and Countries in Transition,” Impacts and Perspectives, Vol. 42, No. 2, 2003, pp. 9-20.
- OCDE, “Links between Poverty, Environment and ManWoman Equality,” Les Dossiers du CAD, Vol. 2, No. 4, 2001, pp. IV-1-IV-101.
- M. Ravallion and G. Datt, “Why Has Economic Growth Been More Pro-Poor in Some States of India than Others?” Journal of Development Economics, Vol. 68, No. 2, 2002, pp. 381-400. doi:10.1016/S0304-3878(02)00018-4
- N. Kakwani and E. Pernia, “What Is Pro-Poor Growth,” Asian Development Review, Vol. 18, No. 1, 2000, pp. 1-16.
- D. Start, “The Rise and Fall of the Rural Non-Farm Economy: Poverty Impact and Policy Options,” Policy Review, Vol. 19, No. 4, 2001, pp. 491-505.
- R. J. Barro, “Economic Growth in a Cross Section of Countries,” Quarterly Journal of Economics, Vol. 106, No. 2, 1991, pp. 407-433. doi:10.2307/2937943
- S. Devarajan, V. Swaroop and H. Zou, “The Composition of Public Expenditure and Economic Growth,” Journal of Monetary Economics, Vol. 37, No. 2, 1996, pp. 313-344.
- A. Kraay, “When Is Growth Pro-Poor? Evidence from a Panel of Countries,” Journal of Development Economics, Vol. 80, No. 1, 2006, pp. 198-227.
- UNDP, “World Report on Human Development,” UNDP, New York, 2004, 185 p.
- J. Foster, J. Greer and E. Thorbecke, “A Class of Decomposable Poverty Measures,” Econometrica, Vol. 52, No. 3, 1984, pp. 761-766. doi:10.2307/1913475
- INS, “Poverty Profile in Cote d’Ivoire in 2002: Temporary Results,” July, Planning and Development Ministry, Abidjan, 2003, 188 p.
- BCEAO, “Annual Report,” Printing House of the BCEAO, Dakar, 2006.
- D. E. Sahn and D. C. Stiefel, “Progress Towards the Millennium Development Goals in Africa,” World Development, Vol. 3, No. 1, 2003, pp. 221-241.
- K. Dhanasekaran, “Government Tax Revenue, Expenditure and Causality: The Experience of India,” Indian Economic Review, Vol. 36, No. 2, 2001, pp. 359-379.
- M. Gillis, D. Perkins, M. Roemer and D. Snodgrass, “Development Economics,” New horizons of Boeck University, Princeton, 2001, 784 p.
- A. F. Ott, “The Public Sector in the Global Economy,” Edward Elgar Publishing Limited, EE, Cheltenham, 2002, 296 p.
- K. Button et al., “Telecommunication, Travel and Location,” Edward Elgar Publishing Limited, EE, Cheltenham, 2003, 208 p.
- A. Del Monte and E. Pagagni, “Public Expenditure, Corruption and Economic Growth: The Case of Italy,” European Journal of Political Economy, Vol. 17, 2001, pp. 1- 16. doi:10.1016/S0176-2680(00)00025-2
- D. E. Sahn and S. D. Younger, “Expenditure Incidence in Africa: Microeconomic Evidence,” Fiscal Studies, Vol. 21. No. 3, 2002, pp. 329-347. doi:10.1111/j.1475-5890.2000.tb00027.x
- S. V. Berg, M. G. Pollitt and M. Tsuji, “Private Initiatives in Infrastructure: Priorities? Incentives and Performance,” Edward Elgar Publishing Limited, EE, Cheltenham, 2002, 256 p.
- P. G. Rosner, “The Economics of Social Policy,” Edward elgar Publishing Limited, EE, Cheltenham, 2003, 336 p.
- N. Kakwani, “Growth and Poverty Reduction: An Empirical Analysis,” Asian Development Review, Vol. 16, No. 2, 2000, pp. 75-84.
- M. Ravallion and S. Chen, “Measuring Pro-Poor Growth,” Economic Letters, Vol. 78, No. 1, 2003, pp. 93-99. doi:10.1016/S0165-1765(02)00205-7
- D. E. Sahn and S. D. Younger, “Growth and Poverty Reduction in Sub-Saharan Africa: Macroeconomic Adjustment and Beyond,” Journal of African Economies, Vol. 13, Suppl. 1, 2004, pp i66-i95. doi:10.1093/jae/ejh016
- G. Mwabu and E. Thorbecke, “Rural Development Growth and Poverty in Africa,” Journal of African Economies, Vol. 13, Suppl. 1, 2004, pp. i16-i65. doi:10.1093/jae/ejh015
- K. Deininger and J. Okidi, “Growth and Poverty Reduction in Uganda, 1999-2000: Panel Data Evidence,” Development Policy Review, Vol. 23, No. 3, 2005, pp. 481-509.
- L. A. Amaghionyeodiwe and T. S. Osinubi, “Poverty Reduction Policies and Pro-Growth in Nigeria,” Brazilian Electronic Journal of Economics, Vol. 6, No. 1, 2004, pp 60-78.
- B. G. Gunter, M. J. Cohen and H. Lofgren, “Analyzing Macro-Poverty Linkages: An Overview,” Development Policy Review, Vol. 23, No. 3, 2005, pp. 285-298. doi:10.1111/j.1467-7679.2005.00287.x
- G. S. Fieldo, “The Dynamics of Poverty, Inequality and Economic Well-Being: African Economic Growth in Comparative Perspective,” Journal of African Economies, Vol. 9, No. 1, 2000, pp. 45-78. doi:10.1093/jafeco/9.Supplement_1.45
- A. Suryahadi and S. Sumarto, “Poverty and Vulnerability in Indonesia before and after the Economic Crisis,” Asian Economic Journal, Vol. 17, No. 1, 2003, pp. 45-64. doi:10.1111/1351-3958.00161
- I. Gupta and A. Mitra, “Economic Growth, Health and Poverty: An Exploratory Study for India,” Development Policy Review, Vol. 22, No. 2, 2004, pp. 193-206. doi:10.1111/j.1467-7679.2004.00245.x
- S. Navajas, M. Schreiner, et al., “Microcredit and the Poorest of the Poor: Theory and Evidence from Bolivia,” World Development, Vol. 28, No. 2, 2000, pp. 333-346. doi:10.1016/S0305-750X(99)00121-7
- D. Narayan, R. Chambers et al., “Crying out for Change: Voices of the Poor,” Oxford university press, New York, 2001.
- N. Kakwani, “Poverty and Economic Growth with Application to Cote d’Ivoire,” Living Standards Measurement Study, Working Paper, No. 63, 1990, 68 p.
- B. M. Kouadio, “Analysis of the Poverty of Long-Term Unemployed in Cote d’Ivoire,” Applied Economics, Vol. 58, No. 3, 2005, pp. 105-130.
- C. B. Barrett, M. Bezuneb and A. Abond, “Income Diversification, Poverty Traps and Policy Shocks in Cote d’Ivoire and Kenya,” Food Policy, Vol. 26, No. 4, 2001, pp. 367-384. doi:10.1016/S0306-9192(01)00017-3
- J. P. Lachaud, “Urbanisation, Malnutrition des Enfants et Sexe au Burkina Faso: Une Analyse Économétrique Spatiale,” Revue d’Economie du Développement, Vol. 18, No. 1, 2004, pp. 35-70.
- H. Lofgren and S. Robinson, “Poverty and Inequality Analysis in a General Equilibrium Framework: The Representative Household Approach,” In: F. Bourguignon and L. A. Pereira da Silva, Eds., Evaluating the Poverty and Distributional Impact of Economic Policies, World bank, Washington DC, 2003, pp. 325-337.
- P. Dorosh and D. E. Sahn, “A General Equilibrium Analysis of the Effect of Macroeconomic Adjustment on Poverty in Africa,” Journal of Policy Modeling, Vol. 22, No. 6, 2000, pp. 753-776. doi:10.1016/S0161-8938(98)00016-7
- J. Cockburn, “Trade Liberalization and Poverty in Nepal: A Computable General Equilibrium Micro Simulation Analysis,” CREFA Working Paper, No. 1-18, 2001, pp. 1-38.
- L. A. Pereira da Silva, B. Essama-Nssah and I. Samaké, “Linking Aggregate Macro-Consistency Models to Household Surveys: A Poverty Analysis Macroeconomic Simulator (PAMS),” In: F. Bourguignon and L. A. Pereira da Silva, Eds., Evaluating the Poverty and Distributional Impact of Economic Policies, Washington DC, World bank, 2003, pp. 1-66.
- INS, “Poverty Profile in Cote d’Ivoire in 2002: Temporary Results,” July, Planning and Development Programming Ministry, Abidjan, 1999, 95 p.
- S. Chen and M. Ravallion, “Welfare Impacts of China’s Accession to the World Trade Organization,” World Bank Economic Review, Vol. 18, No. 1, 2004, pp. 29-57. doi:10.1093/wber/lhh031
NOTES
Cote d’Ivoire carried out, from 1975 to 2002, several surveys close by households. Among them, it is advisable to quote:
• Survey about the budget and the consumption of houses of 1979 (EBC 79);
• Permanent household survey (EPAM) de 1985 à 1988 ;
• Priority survey on the social dimensions of structural adjustment (DSA) of 1992 in Abidjan of 1993 on the whole territory. and l’Enquête Prioritaire sur les Dimensions Sociales de l’Ajustement Structurel (DSA) de 1992 à Abidjan et de 1993 sur l’ensemble du territoire;
• “Household living conditions level” survey of 1995 (ENV 95);
• “Household living conditions level” survey of 1998 (ENV 98);
• “Household living conditions level” survey of 2002 (ENV 2002).
Those surveys permitted to analyze the level development and the living conditions of the African households who live in Cote d’Ivoire.