Modern Economy
Vol. 3 No. 2 (2012) , Article ID: 18144 , 5 pages DOI:10.4236/me.2012.32027
US National Healthcare Expenditures, 1960-2000: Public and Private Cubic Growth Dynamics
1Department of Neurology, West Virginia University, Morgantown, USA
2Department of Finance, Banking and Insurance, Appalachian State University, Boone, USA
3Department of Statistics, West Virginia University, Morgantown, USA
4159th Aviation Brigade, United States Army, Fort Campbell, USA
Email: jriggs@wvu.edu, hobbsjc@appstate.edu, ghobbs@stat.wvu.edu, todd.riggs@us.army.mil
Received January 5, 2012; revised February 11, 2012; accepted February 24, 2012
Keywords: Consumer Price Index; Cubic Dynamics; Economic Modeling; National Healthcare Expenditures; Per Capita Healthcare Expenditures; Population; Private; Public; United States
ABSTRACT
US national healthcare expenditures (NHE) displayed cubic growth dynamics between 1960 and 2000. In any year, current NHE must equal population times consumer price index (CPI) times per capita CPI-adjusted constant dollar healthcare expenditures. Cubic growth dynamics are a consequence of the fact that essentially linear growth relationships were observed over time with total population, CPI, and per capita CPI-adjusted dollar healthcare expenditures. Similarly in any year, current private and public NHE must equal population times consumer price index (CPI) times private and public per capita CPI-adjusted constant dollar healthcare expenditures respectively. This study examined whether private and public per capita CPI-adjusted dollar healthcare expenditures displayed linear growth. Linear relationships were observed over this time period for both private per capita CPI-adjusted dollar healthcare expenditures and public per capita CPI-adjusted dollar healthcare expenditures. The finding that both of these factors were well described by linear equations suggests that that both private and public NHE growth should display cubic growth dynamics over time. From 1960 through 2000, cubic growth dynamics were observed for both private NHE and public NHE. This model suggests that shifting healthcare costs between the private and public domains will not alter the underlying cubic growth dynamics of US NHE as long as per capita CPI-adjusted constant dollar private and public healthcare expenditures increase reasonably linearly over time.
1. Introduction
Rapidly rising national healthcare expenditures (NHE) severely challenge the economies of industrialized nations [1,2]. During the second half of the twentieth century many Western democracies showed a trend from public financing of healthcare to private financing, while the United States trended from private financing of healthcare to public financing [1-4]. In any given year, current NHE must equal population times consumer price index (CPI) times per capita CPI-adjusted constant dollar healthcare expenditures [5]. These three factors increased reasonably linearly in the United States between 1960 and 2000 suggesting that NHE should, and did, demonstrate cubic growth dynamics [5]. Since total NHE is the simply the sum of public and private NHE, this study examined the underlying growth dynamics of US public and private NHE from 1960 through 2000. Similarly by definition, in any given year, current public NHE must equal population times consumer price index (CPI) times per capita CPI-adjusted constant dollar public healthcare expenditures, and current private NHE must equal population times consumer price index (CPI) times per capita CPI-adjusted constant dollar private healthcare expenditures.
2. Methods
Three public and readily available sources of data for the years 1960 through 2000 were used in this analysis. Official estimates of the total US population for those years (Table 1) were obtained from the US Census Bureau (www.census.gov). Official estimates of the U.S. consumer price index (CPI) for those years (Table 1) were obtained from the US Department of Labor, Bureau of Labor Statistics (www.bls.gov). Official estimates of private and public U.S. NHE in current dollars for those years (Table 1) were obtained from the U.S. Department of Health and Human Services, Centers for Medicare & Medicaid Services (www.cms.hhs.gov). Di-
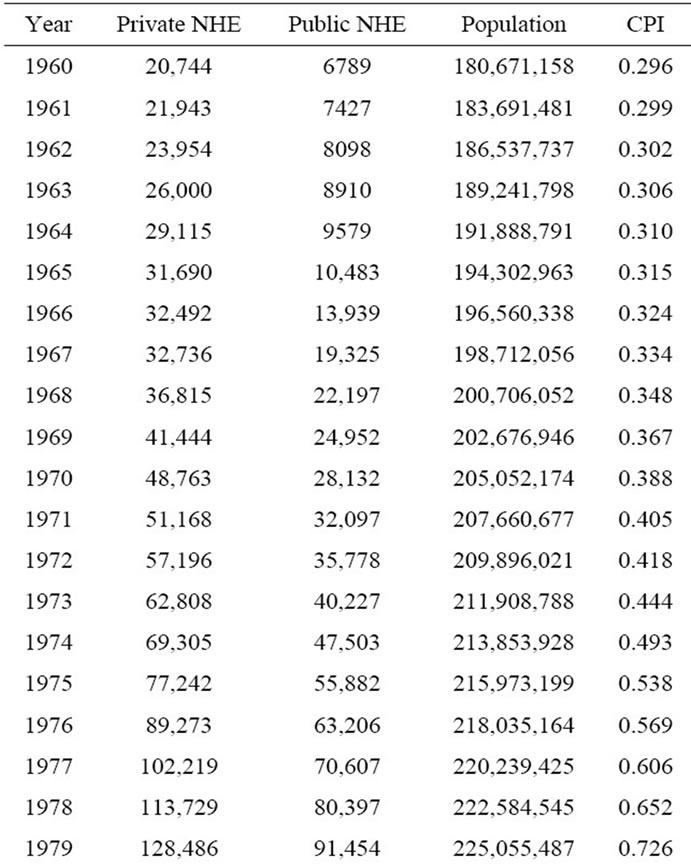
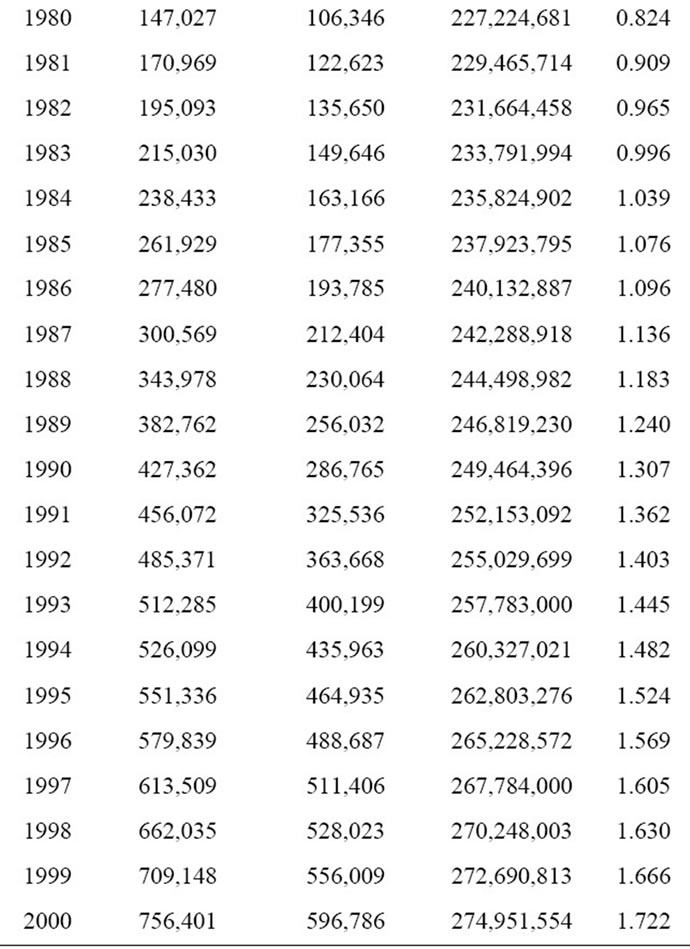
Table 1. United States private and public national healthcare expenditures (NHE) in millions of dollars, population, and consumer price index (CPI) for the years 1960-2000.
viding the annual total private and public NHE by that year’s CPI gives the annual private and public NHE in CPI-adjusted dollars. Dividing the annual private and public NHE in CPI-adjusted dollars by the corresponding annual population gives the annual per capita CPI-adjusted private and public healthcare expenditures. The relationship of annual population, CPI, and per capita CPI-adjusted private and public healthcare expenditures over time, between 1960 and 2000, was examined.
3. Results
3.1. Population
Figure 1 illustrates the relationship between total US population and year. As shown, there is a strong linear relationship between total US population and year. Linear regression between total population and year yielded the following equation:
POPx = 2293408.2X + 181774463(1)
where POPx is the total US population in year X, and X is the year, which varied from 0 for year 1960 to 40 for year 2000. The r2 value for this linear regression was >0.99. Thus, the total US population increased by approximately 2,293,408 individuals per year between the years 1960 and 2000. The least-squares estimate of the parameters in the regression equation:
POPx = aX + A(2)
is therefore, a is 2293408.2, and A is 181774463.
3.2. Consumer Price Index
Figure 2 illustrates the relationship between CPI and year. As shown, there is a reasonably linear relationship between CPI and year. The linear regression between CPI and year yielded the following equation:
CPIx = 0.040218641X + 0.0643875 (3)
where CPIx is the consumer price index in year X, and X
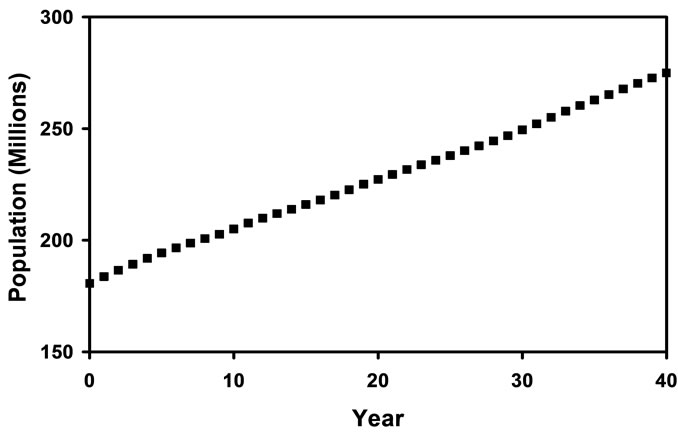
Figure 1. Total US population for the years 1960 (year 0) through 2000 (year 40) is displayed. The r2 value for the linear regression performed on this data was >0.99.
Figure 2. The consumer price index (CPI) for the years 1960 (year 0) through 2000 (year 40) is displayed. The r2 value for the linear regression performed on this data was >0.96.
is the year, which varied from 0 for year 1960 to 40 for year 2000. The r2 value for this linear regression was >0.96. Thus, the CPI increased by approximately 0.0402 per year between the years 1960 and 2000. Since the numbers in Equation (3) are constants, the following equation will be used:
CPIx = bX + B(4)
where b is 0.040218641, and B is 0.0643875.
3.3. Per Capital CPI-Adjusted NHE
Figure 3 illustrates the relationship between per capita CPI-adjusted private healthcare expenditures and year. As shown, there is a near linear relationship between per capita CPI-adjusted private healthcare expenditures and year. Linear regression between per capita CPI-adjusted private healthcare expenditures and year yielded the following equation:
priPCNHEx = 30.947097X + 289.01514(5)
where priPCNHEx is the per capita CPI-adjusted private healthcare expenditures in year X, and X is the year, which varied from 0 for year 1960 to 40 for year 2000. The r2 value for this linear regression was >0.97. Thus, per capita CPI-adjusted private healthcare expenditures increased by approximately $30.95 per year between the years 1960 and 2000. Since the numbers in Equation (5) are constants, the following equation can be used:
priPCNHEx = cpriX + Cpri(6)
where cpri is 30.947097, and Cpri is 289.01514.
Figure 4 illustrates the relationship between per capita CPI-adjusted public healthcare expenditures and year. As shown, there is a near linear relationship between per capita CPI-adjusted public healthcare expenditures and year. Linear regression between per capita CPI-adjusted public healthcare expenditures and year yielded the following equation:
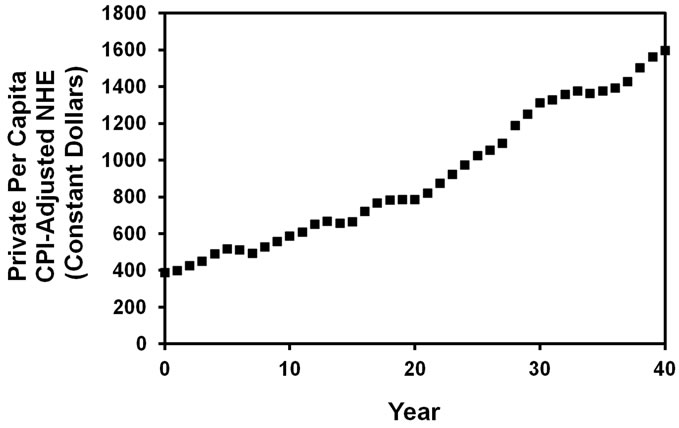
Figure 3. Per capita CPI-adjusted constant dollar US private healthcare expenditures for the years 1960 (year 0) through 2000 (year 40) is displayed. The r2 value for the linear regression performed on this data was >0.97.
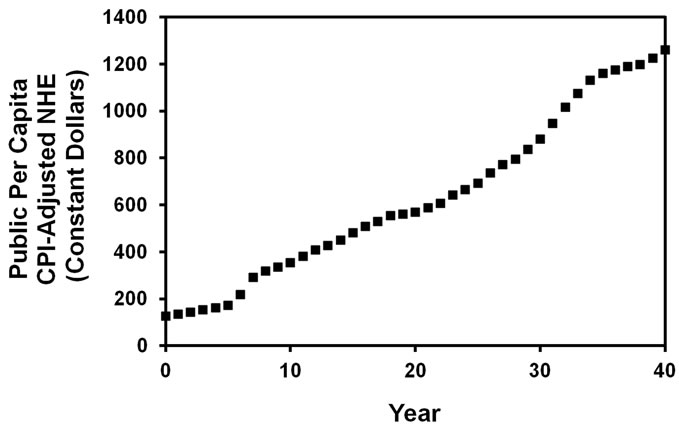
Figure 4. Per capita CPI-adjusted constant dollar US public healthcare expenditures for the years 1960 (year 0) through 2000 (year 40) is displayed. The r2 value for the linear regression performed on this data was >0.97.
pubPCNHEx = 29.234622X + 46.280383(7)
where pubPCNHEx is the per capita CPI-adjusted public healthcare expenditures in year X, and X is the year, which varied from 0 for year 1960 to 40 for year 2000. The r2 value for this linear regression was >0.97. Thus, per capita CPI-adjusted public healthcare expenditures increased by approximately $29.23 per year between the years 1960 and 2000. Since the numbers in Equation (5) are constants, the following equation can be used:
pubPCNHEx = cpubX + Cpub(8)
where cpub is 29.234622, and Cpub is 46.280383.
3.4. Cubic Model
For any given year, the following relationship is valid:
priNHEx = (POPx) (CPIx) (priPCNHEx)(9)
where priNHEx is national private healthcare expenditures in current dollars in year X, POPx is the total US population in year X, CPIx is the consumer price index in year X, and priPCNHEx is the per capita CPI-adjusted private healthcare expenditures in year X.
For any given year, the following relationship is also valid:
pubNHEx = (POPx) (CPIx) (pubPCNHEx)(10)
where pubNHEx is national public healthcare expenditures in current dollars in year X, POPx is the total US population in year X, CPIx is the consumer price index in year X, and pubPCNHEx is the per capita CPI-adjusted public healthcare expenditures in year X.
Since all the terms on the right hand side of Equations (9) and (10) are reasonably described by linear equations, this implies that both private and public NHE in the United States from 1960 through 2000 should display cubic growth dynamics. Accordingly, a cubic polynomial fit of national private and public healthcare expenditures (Table 1) over time was performed. That analysis demonstrated that both private (Figure 5) and public (Figure 6) NHE between 1960 and 2000 conformed to a cubic function, and that the r2 value of those fits was >0.99 in both instances.

Figure 5. Actual and best cubic fit (solid line) of private national health expenditures (NHE) in current millions of dollars for years 1960 (year 0) through 2000 (year 40).
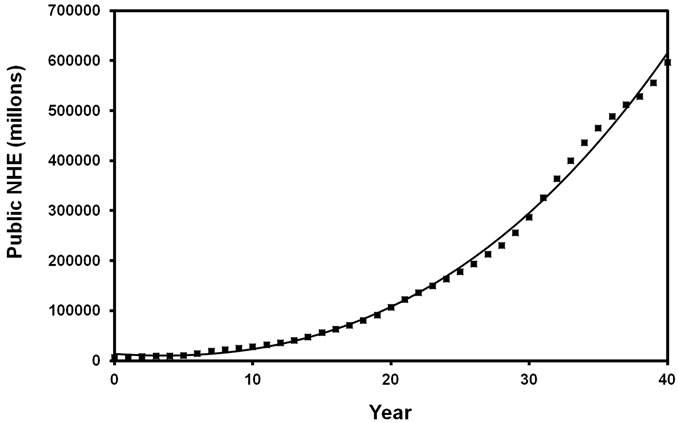
Figure 6. Actual and best cubic fit (solid line) of public national health expenditures (NHE) in current millions of dollars for years 1960 (year 0) through 2000 (year 40).
4. Discussion
A model of NHE based on the fact that in any year, current NHE must equal population times CPI times per capita CPI-adjusted constant dollar healthcare expenditures has been developed and analyzed [5]. That model separated NHE into three distinct components; population, CPI, and per capita CPI-adjusted constant dollar healthcare expenditures. Since population, CPI, and per capita CPI-adjusted constant dollar healthcare expenditures increased reasonably linearly over time between 1960 and 2000, that model suggested that NHE growth should display cubic growth dynamics [5]. NHE growth did display cubic dynamics from 1960 to 2000 [5]. That model was expanded in this study to examine both private and public NHE in the United States between 1960 and 2000. Since both private and public per capita CPI-adjusted healthcare expenses increased linearly over this time period, then both annual total private and public NHE should also increase cubically over this time period. Indeed, both private and public NHE growth did display cubic growth dynamics from 1960 to 2000. This analysis suggests that future US private and public NHE growth will remain cubic as long as increases in population, CPI, and per capita CPI-adjusted constant dollar private and public healthcare expenditures remain reasonably linear over time. Cubic growth is important to distinguish from exponential growth [5].
Orszag and Ellis [6] suggested that “our country’s financial health will in fact be determined by the growth rate of per capita health care costs”. In this model, both private and public US NHE growth displayed cubic dynamics. As demonstrated, the private per capita CPIadjusted healthcare expenditure growth rate exceeded the public per capita CPI-adjusted healthcare expenditure growth rate. As nations tinker with the optimal ratio of private to public financing of healthcare [1-4], this study suggests that cost-shifting between private and public sectors may have limited impact on the overall growth of NHE.
5. Conclusion
Rising healthcare costs impacts all sectors of any nation’s economy and impacts national discretionary spending. This analysis suggests that inflation-adjusted per capita healthcare costs is perhaps the best measure to track and monitor NHE growth, including the private and public subsectors of the healthcare industry. Moreover, this analysis further suggests that healthcare policy changes that merely shift the cost of healthcare expenses will have little impact on NHE growth [5].
REFERENCES
- C. H. Tuohy, C. M. Flood and M. Stabile, “How Does Private Finance Affect Public Health Care Systems? Marshaling the Evidence from OECD Nations,” Journal of Health Politics, Policy and Law, Vol. 29, No. 3, 2004, pp. 359-396. doi:10.1215/03616878-29-3-359
- H. Maarse, “The Privatization of Health Care in Europe: An Eight-Country Analysis,” Journal of Health Politics, Policy and Law, Vol. 31, No. 5, 2006, pp. 981-1014. doi:10.1215/03616878-2006-014
- T. Bodenheimer, “High and Rising Health Care Costs. Part 1: Seeking an Explanation,” Annals of Internal Medicine, Vol. 142, No. 10, 2005, pp. 847-854.
- T. Bodenheimer, “High and Rising Health Care Costs. Part 4: Can Costs Be Controlled While Preserving Quality?” Annals of Internal Medicine, Vol. 143, No. 1, 2005, pp. 26-31.
- J. E. Riggs, J. C. Hobbs, G. R. Hobbs and T. H. Riggs, “US National Healthcare Expenditures: Demonstration and Explanation of Cubic Growth Dynamics,” Theoretical Economics Letters, Vol. 1, No. 2, 2011, pp. 103-108.
- P. R. Orszag and P. Ellis, “The Challenge of Rising Health Care Costs—A View from the Congressional Budget Office,” New England Journal of Medicine, Vol. 357, No. 18, 2007, pp. 1793-1795. doi:10.1056/NEJMp078190