Journal of Environmental Protection
Vol. 3 No. 9A (2012) , Article ID: 22971 , 12 pages DOI:10.4236/jep.2012.329136
Volatile Organic Compounds in Alberta, Canada Residences—Evidence from Community Surveys
![]()
1Department of Public Health Sciences, School of Public Health, Edmonton, Canada; 2Department of Civil & Environmental Engineering, University of Alberta, Edmonton, Canada.
Email: warrenk@ualberta.ca
Received June 4th, 2012; revised July 3rd, 2012; accepted August 1st, 2012
Keywords: VOCs; Air Quality; Indoor Air; Alberta
ABSTRACT
The impact of the built environment on public health is complex, involving several determinants of health including indoor air quality. People who spend the most time indoors can be exposed to indoor air pollutants for long periods of time. These are often the same people who are most susceptible to adverse effects if exposures are high enough (young children, elderly, and chronically ill, especially those suffering from respiratory diseases). An analysis of data on selected indoor volatile organic compounds (VOCs) from community studies in Alberta, Canada was undertaken. Measures of typical (central tendency) and high end (upper limit) indoor concentrations were estimated from seven studies in Alberta. Best estimates of central tendency indoor concentrations for 12 VOCs—benzene, ethylbenzene, o-xylene, 3-methylhexane, heptane, octane, nonane, decane, 1,1,1-trichloroethane, carbon tetrachloride, tetrachloroethylene, and 1,2,4-trimethylbenzene—were less than 5 µg/m3. Best estimates of central tendency indoor concentrations for three VOCs—toluene, m/p-xylene, and limonene—were greater than 5 µg/m3. In the case of best estimates of upper limit indoor concentrations—benzene, ethylbenzene, o-xylene, hexane, 3-methylhexane, heptane, octane, nonane, carbon tetrachloride, and tetrachloroethylene had upper limit concentrations less than 15 µg/m3. Best estimates of upper limit indoor concentrations for toluene, m/p xylene, decane, limonene, 1,1,1-trichloroethane, and 1,2,4-trimethylbenzene were greater than 15 µg/m3. Upper limit concentrations observed inside Alberta residences were about 4 to 10 times higher than typical concentrations for most of the VOCs observed. Upper limit indoor concentrations for carbon tetrachloride and benzene in Alberta are similar to or greater than levels judged by US EPA to imply a concern for potential cancer effects. This indicates that some homes in Alberta can have levels of carbon tetrachloride and benzene that may be of concern from a public health point-of-view.
1. Introduction
Alberta is a province in western Canada and is of economic importance to Canada (Figure 1). The energy industry is a primary driver of the economy in the province and it is supported—to a lesser extent—by forestry, mining, and agriculture. The energy portfolio includes natural gas and shale gas, conventional oil, oil sands, shale oil, and coal—all of which are mined and/or extracted in the province. The Alberta population has expanded rapidly over the past 30 years—from a population of about 2.2 million in 1980 to a current population of over 3.7 million [1]. In terms of climate, Alberta has dry continental weather with warm summers and cold winters. The province is open to cold (arctic) weather systems from the north, which can produce extremely cold conditions during the winter [2]. Because Alberta extends for over 1200 kilometres from north to south, its climate varies considerably. Average temperatures in January range from greater than −10˚C in the south to less than −24˚C in the north, and in July from greater than 18˚C in the south to less than 13˚C in the north.
Large-scale time-activity studies in which people recall their locations and activities through diaries show that people spend a lot of time indoors—either at home or at the office—with very little time spent outdoors [3]. General trends of Canadian time-activity behavior include [4]: most time, on average, is spent indoors for Canadians (between 88% to 90% of time); a small amount of time, on average, is spent in an operating motor vehicle (<6% for persons aged 12 or older and <3.2% for persons aged 11 or younger); and a similar small proportion of time, on average, is also spent outdoors (<6% for persons aged 12 or older and <7.5% for persons aged 11 or younger).
The impact of the built environment on our health is

Figure 1. Map of provinces of Canada showing Alberta.
complex, involving several determinants of health—air quality, water quality, diet, physical activity, etc. Indoor air quality is an important environmental health issue and its potential consequences are much less investigated compared to ambient air quality [5,6]. With respect to indoor air quality, changes in emission profiles for indoor pollutants and personal habits of building occupants— including changes in the number of occupants who smoke indoors—have occurred over the past several decades [7]. These changes have altered the kind and concentrations of chemicals that occupants are exposed to in their homes today compared to several decades ago.
Volatile organic compounds (VOCs) are a class of indoor air pollutants of interest from a public health pointof-view [8]. For example, some of these pollutants are reported to be associated with a variety of potential adverse health outcomes [9,10]: benzene (leukemia and non-Hodgkin’s lymphoma); ethylbenzene (blood disorders), tetrachloroethylene (bladder cancer); toluene (central nervous system effects—e.g. headache, fatigue, nausea from chronic inhalation exposure; developmental effects in children of pregnant women exposed by inhalation); trichloroethylene (Hodgkin’s disease, leukemia, and kidney and liver cancers); xylenes (central nervous system effects—e.g. headache, fatigue, dizziness). People who spend the most time indoors can be exposed to indoor air pollutants for long periods of time. These are often the same people who are most susceptible to adverse effects if exposures are high enough (e.g., young children, elderly, and chronically ill, especially those suffering from respiratory diseases).
Over the past fourteen years, a number of studies have been undertaken by the Alberta Department of Health and researchers at the University of Alberta [11-17]. These studies have involved measuring selected VOCs in indoor, outdoor, and in some cases personal exposure air in different Alberta communities. A gap exists in terms of what these studies collectively indicate with respect to the current state of indoor air quality in Alberta. An analysis of data on selected indoor VOCs from these studies is presented here in an effort to provide public health practitioners with a perspective about the state and general characteristics of indoor VOCs in Alberta. Specifically, the intent was to estimate measures of typical (i.e., central tendency) and high end (i.e., upper limit) concentrations of selected indoor VOCs from these studies. No attempt was made to differentiate between indoor levels and age of dwelling (i.e., existing versus newly constructed), sources and/or occupant activities/hobbies, and ventilation characteristics). All of these factors are acknowledged to affect indoor air quality.
2. Materials and Methods
2.1. Study Area
Data analyzed were drawn from seven different studies undertaken in the following regions and communities with nearby industrial activities in Alberta (Figure 2):
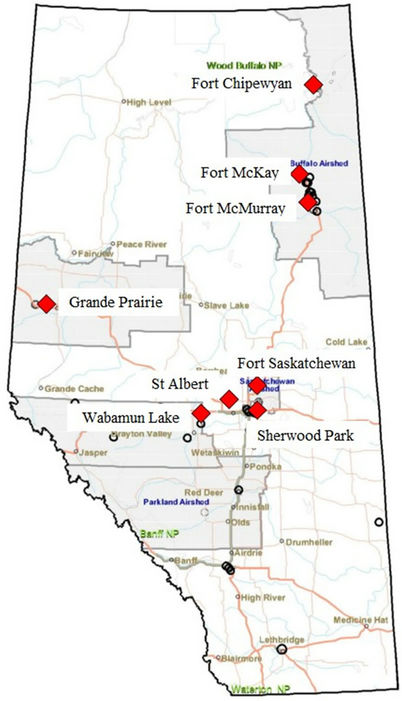
Figure 2. Location of communities where measurements of indoor VOC levels have been taken in Alberta, Canada.
• Three studies in communities among oil sand surface and in-situ mining, upgrading and refining activities in northeastern Alberta—one study in Fort McMurray (population ~55,000) and in Fort Chipewyan (~1200) [11], and two separate studies in Fort McKay (~300) [12,13].
• A multi-community study near conventional oil and gas extraction and refining, shale gas exploration activities in northwestern Alberta [14]—the communities included Grande Prairie (~45,000), Sexsmith (~2100), Beaverlodge (~2200), and Debolt (~150).
• Two studies in communities surrounding Edmonton near oil upgrading and refining, petrochemical processing, conventional gas extraction and processing activities in central Alberta—one study in Fort Saskatchewan (~15,000) [15], and one study in St Albert (~45,000) and Sherwood Park (~45,000) [16].
• A multi-community study around Wabamun Lake near surface coal mining and coal-fired electricity production activities in central Alberta [17]—the communities included Stony Plain (~12,000), Spruce Grove (~19,000), Devon (~6000), Wabamun (~600) and Thorsby (~900) and, and the Paul First Nation reserve (~1100).
All of these communities are located between the latitudes of 53˚ and 58˚45′N (between 480 and 1080 km north of the Canada-United States border). Examples of mean daily temperatures in July and January for some of the communities in Alberta are shown in Table 1.
2.2. Sampling Programs and Analytical Methods
Two basic survey sampling designs were used to identify and select residences for sampling in the seven community studies [18-21]:
• Convenience sampling was used in four of the studies [11,14,15,17] and this involved sampling residences using a volunteer recruitment process whereby advertisements were posted in a community and leaders in communities were used to encourage and enlist people to volunteer and participate (i.e., to allow sampling of their residence).
• Probability sampling was used in three of the studies [12,13,16] and this involved using probability sampling methods to randomly pre-select people’s residences and then to recruit the homeowner to allow sampling of their residence.
Sampling for VOCs inside residences for all studies was accomplished using the 3M® Organic Vapor Monitor (OVM) 3500 (St. Paul, MN) [22] using deployment periods of 1 day [16], 4 days [12], or 7 days [11,13-15,17]. The OVM is lightweight, small, and has no moving parts. It collects volatile organic compounds by natural diffusion and adsorption on a charcoal pad. The sampling
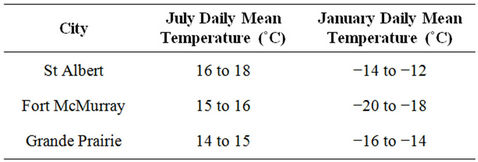
Table 1. Average temperatures in July and January for selected communities in central and northern Alberta, Canada [2].
rate for a chemical is a function of diffusion (described elsewhere [23]). These monitors require long enough deployment periods for detection of low part-per-billion concentrations typical of most indoor (non-occupational) environments. The OVM has been previously used in a Canadian national indoor air quality study using a 1-day deployment period [24] and an ambient air study in Alberta using a 30-day deployment period [25].
The OVM has been evaluated under controlled laboratory conditions [26] and it has been reported that the sampling performance is compound-specific and depends on concentration, temperature, and humidity. Controlled laboratory sampling of numerous VOCs (benzene, 1,3- butadiene, carbon tetrachloride, chloroform, 1,4-dichlorobenzene, methylene chloride, styrene, tetrachloroethylene, and toluene) indicated a negative bias as compared to calculated chamber concentrations but were generally within 25% of theory) [26]. With respect to duration of deployment, the monitors can be effectively used over a range of VOC concentrations and environmental conditions tested over a 24-hour to 7-day sampling period [26-28]. The monitors accurately measure low ppb levels for only about one week because of losses due to back diffusion [28].
The OVM monitors were placed inside a residence to provide a short-term measure of VOCs in the living space. The monitors were attached to a stationary stand approximately 1 m high above the floor (Figure 3). All monitor locations were determined during an initial visit to each residence. Placement of the stands was selected after determining the type of residence (home, apartment, house trailer, etc.), layout of the residence, and daily routines of the occupants. The stands were mostly placed in the main living area (i.e., a room in which the occupants spent most of their time while awake). Efforts were made to ensure that the stands were at least 2 m away from exterior doors, windows, and ventilation registers.
After the deployment period, the monitors were retrieved and placed in small containers with a snap-on lid. Teflon tape was wrapped around the lid of each container and they were transported in a cooler to a laboratory for analysis. The monitors were extracted and analyzed either at the Centre for Toxicology, University of Calgary
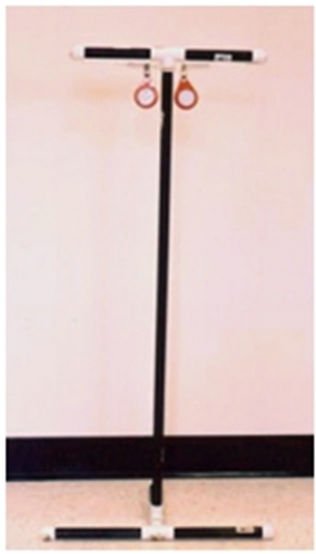
Figure 3. Indoor stand for monitoring of VOCs.
(Calgary, Alberta, Canada) [11-15,17] or the Department of Public Health Sciences at the University of Alberta
(Edmonton, Alberta, Canada) [16]. VOCs were desorbed from the charcoal pad by solvent extraction using carbon disulfide (CS2). Extracts were analyzed by gas chromatography/mass spectrometry (GC/MS) for selected target compounds. Calibration standards were prepared and analyzed for use in quantifying the amount of a compound in a sample extract.
3. Results and Discussion
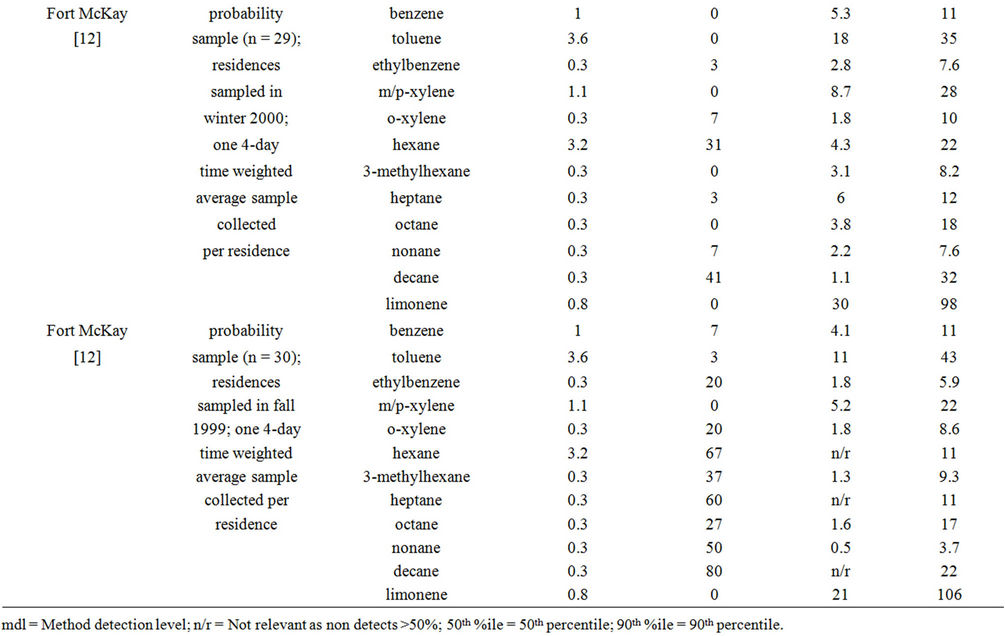
A sample taken from a single residence during a particular season was treated as a single sampling event inside a residence. The resulting dataset analyzed here represented VOC concentrations from a total of 748 sampling events inside residences in Alberta. Table 2 lists 16 compounds for which concentration data were obtained in these sampling programs along with their Chemical Abstract Service (CAS) numbers, chemical class, molecular weights, boiling points, and μg/m3 to ppb conversion factors. Study details, method detection limits, percentage of samples reporting non-detectable concentrations, median (50th percentile) concentrations, and 95th percentile concentrations for 16 VOCs inside residences of different Alberta are summarized in Table 3. Results presented in Table 3 represent twelve different sampling campaigns with sampling in winter being the most common. Seasonal differences exist for indoor VOC levels in
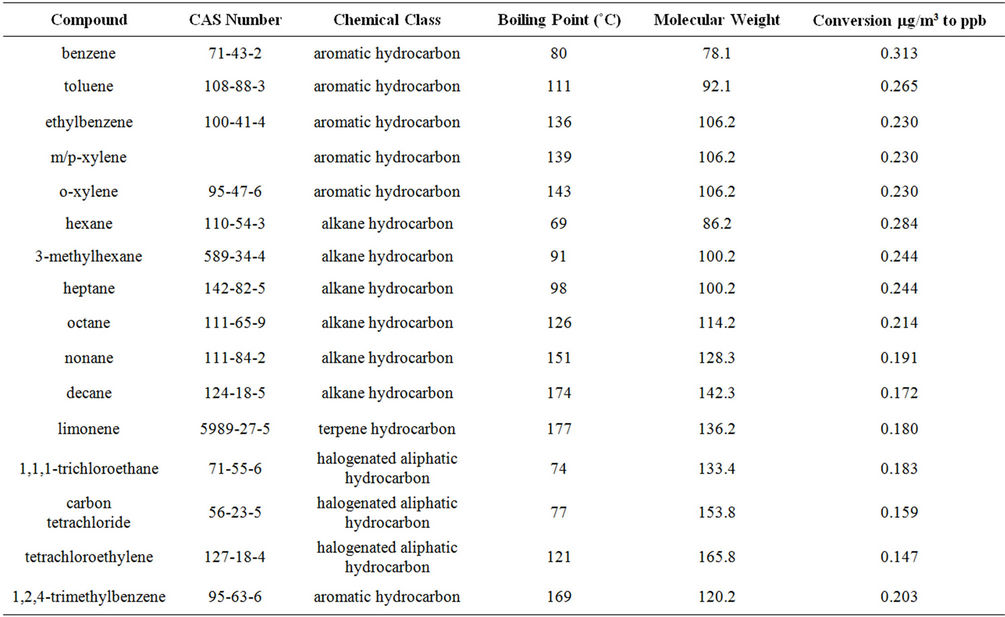
Table 2. VOCs measured in residences in Alberta, Canada ordered by chemical class and increasing boiling point within class.
 (a)
(a)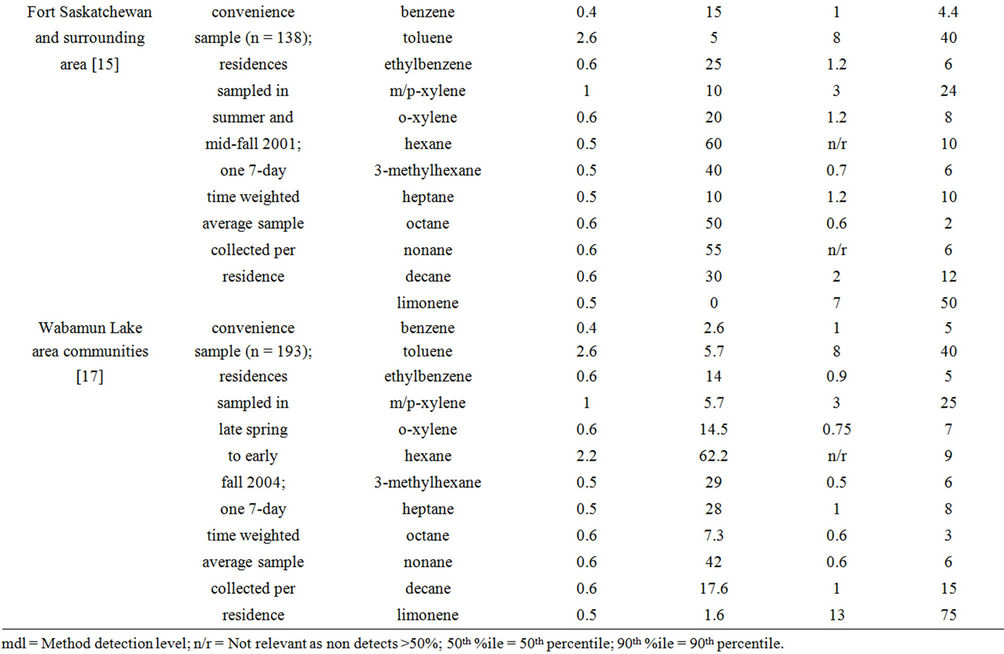 (b)
(b)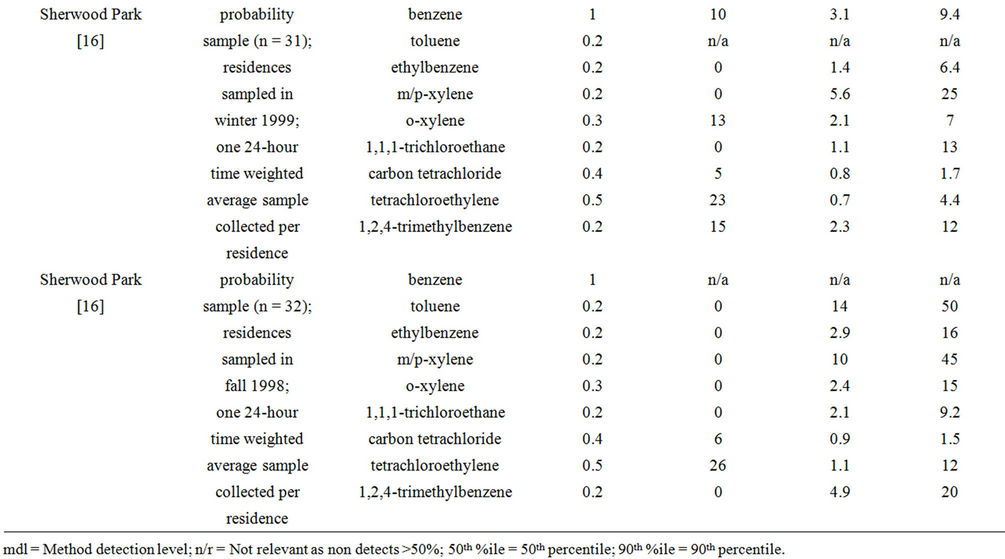 (c)
(c)
Table 3. Summary of 50th and 95th percentile VOC concentrations (μg/m3) measured indoors in communities of Alberta, Canada.
residences [29], particularly in Canada [24,30]. Cold season (i.e., winter) is associated with less natural ventilation inside residences and anticipated higher indoor VOC concentrations compared to the other seasons.
A 50th percentile concentration was not estimated for any VOC in Table 3 that had greater than 50% of samples reported as being below the method detection level. Hexane—an alkane hydrocarbon compound with the lowest boiling point of all hydrocarbon compounds listed in Table 2 and commonly found in gasoline—had greater than 50% of samples reported as being below the method detection level in seven of eight sampling campaigns targeting this VOC. Heptane, nonane, and decane —also alkane hydrocarbon compounds—had greater than 50% of samples reported as being below the method detection level in one, three, and one of eight sampling campaigns targeting these VOCs, respectively.
Using data from Table 3, a best estimate of central tendency concentrations was calculated as an unweighted geometric mean (GM) of all sampling campaigns reporting median (50th percentile) concentrations for each VOC. Table 4 presents these best estimates of central tendency for each VOC found in Alberta residences along with the sample size (numbers of residences) from which the estimate is based. Similarly, a best estimate of an upper limit concentration was calculated as an unweighted geometric mean of all sampling campaigns reporting 95th percentile concentrations for each VOC listed in Table 3. Table 4 also presents the best estimates of upper limit concentrations for each VOC found in Alberta residences along with the sample size from which the estimate is based.
Best estimates of central tendency for most (12 of 16) VOCs—benzene, ethylbenzene, o-xylene, 3-methylhexane, heptane, octane, nonane, decane, 1,1,1-trichloroethane, carbon tetrachloride, tetrachloroethylene, and 1,2,4-trimethylbenzene—were less than 5 μg/m3. Whereas, best estimates of central tendency for only three VOCs—toluene, m/p-xylene, and limonene—were greater than 5 μg/m3. In the case of best estimates of upper limits for VOCs in Alberta residences, ten VOCs—benzene, ethylbenzene, o-xylene, hexane, 3-methylhexane, heptane, octane, nonane, carbon tetrachloride, and tetrachloroethylene—had upper limits less than 15 μg/m3. Whereas, best estimates of upper limits for six VOCs—toluene, m/p-xylene, decane, limonene, 1,1,1-trichloroethane, and 1,2,4-trimethylbenzene—were greater than 15 μg/m3.
The ratio between best estimates of an upper limit and central tendency for each VOC in Table 2, except hexane, is presented in Table 5 to illustrate the possible range of concentrations beyond typical levels (i.e., central tendency). Table 5 indicates that upper limits observed in Alberta residences were about 4 to 10 times higher than typical values for most of the VOCs listed in Table 2. Decane and 1,1,1-trichloroethane had upper limits 10 or more times typical values. Measures of central tendency for indoor air concentrations (i.e., geometric mean, mean, or median) of selected VOCs from this study are compared to results observed in other locations in Table 6. These locations included elsewhere in Canada [30], in United States [31], and in The Netherlands [32]. Central tendency concentrations from this study are
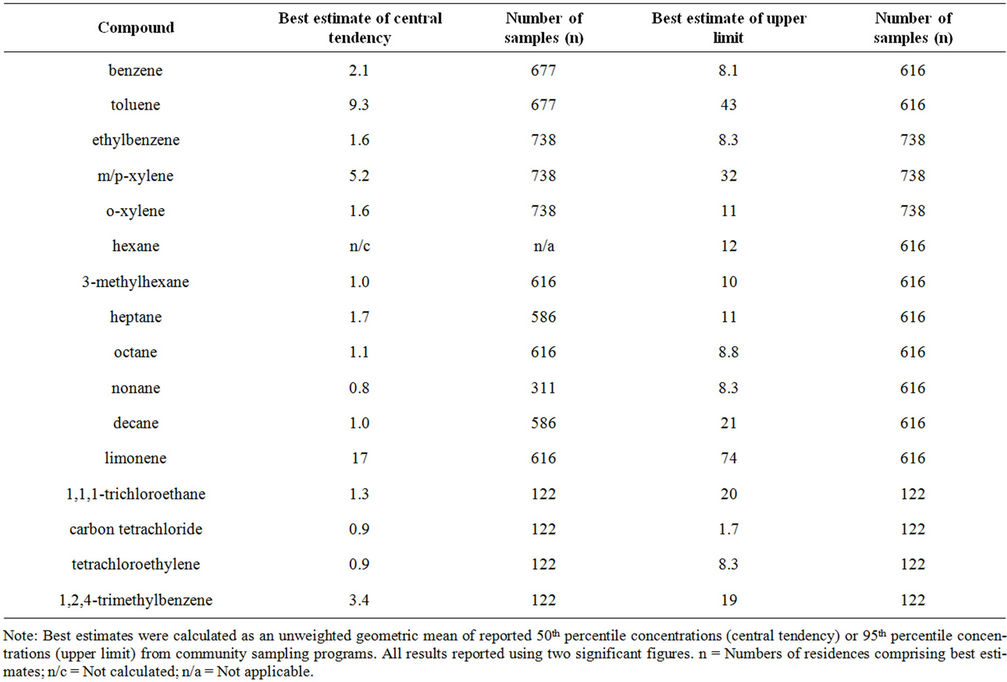
Table 4. Best estimates of central tendency and upper limits for VOC concentrations (μg/m3) inside existing residences of Alberta, Canada.
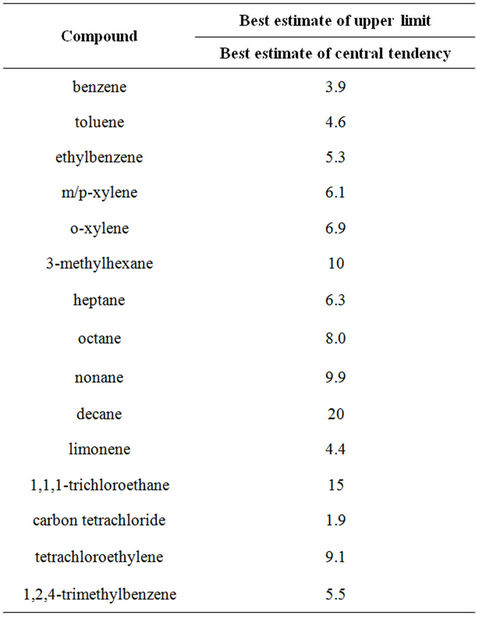
Table 5. Ratio of best estimates of upper limit and central tendency concentrations for each compound for residences in Alberta, Canada.
smaller than that observed in the other studies indicated in Table 6. To a certain extent this pattern could be an artifact of how central tendency measures for this study were derived. Central tendency values derived in this study are based geometric means of 50th percentile concentrations and these measures (i.e., 50th percentile concentrations) tend to be smaller than means for skewed distributions—which are typical of most environmental datasets [33].
The greatest portion of time spent by Canadians— around two-thirds, on average—is spent indoors at home [34]. An assessment of excess cancer risks corresponding to assumed lifetime exposure to central tendency and upper limit indoor concentrations of three VOCs—benzene, carbon tetrachloride, and tetrachloroethylene—was carried out using published risk factors by US Environmental Protection Agency (EPA), Integrated Risk Information System (IRIS) [35]. Published IRIS risk factors for cancer do not exist for any other of the VOCs listed in Table 2. Several provincial agencies in Canada (i.e., in British Columbia, Alberta, and the Atlantic provinces) use an acceptable excess lifetime cancer risk of 1 in 100,000 in environmental regulatory programs [36]. Alberta uses an acceptable excess cancer risk level of 1 in 100,000 to an individual receptor for use in human health risk assessment of chemicals associated with environmental impact assessment (EIA) evaluations [37]. Therefore, 1 in 100,000 is used here to express indoor air concentrations representing the potential for harm from chronic (long-term) inhalation exposure to benzene, carbon tetrachloride, and tetrachloroethylene. These air concentrations are, effectively, Risk specific Concentrations (RsC) corresponding to a specified excess cancer risk level of 1 in 100,000. An environmental concentration less than an RsC indicates that exposures are unlikely to result in any harm, while an environmental concentration greater than an RsC indicates that there may be concern for potential cancer effects.
Best estimates of central tendency and upper limit indoor concentrations in Alberta are compared to RsC values published by US EPA in Table 7. A typical indoor benzene level (i.e., central tendency value) in Alberta is within the range judged by US EPA to imply a concern for potential cancer effects. Whereas, typical indoor levels for carbon tetrachloride and tetrachloroethylene in Alberta are below levels judged by US EPA to imply a concern for potential cancer effects. On the other hand, upper limit indoor concentrations for carbon tetrachloride and benzene in Alberta are similar to or greater than levels judged by US EPA to imply a concern for potential cancer effects. This indicates that some homes in Alberta can have levels of carbon tetrachloride and benzene that may be of concern from a public health perspective. It is important to note that this interpretation assumes a lifetime (70 years) of exposures; whereas the VOC datasets presented here only represent a “snapshot” of indoor concentrations in Alberta residences and corresponding inferred exposures that vary over a lifetime.
It is also important to acknowledge the origins of VOCs in the residential environment. Key sources of VOC emissions inside these residences include [34,38]: off-gassing of building materials and furnishings such as paints and carpets; emissions from household consumer products (e.g., cleaners, solvents, glues), intrusion from external sources such as vehicle emissions from attached garages which are common for many Alberta residences built after the 1970s; combustion products from wood burning; and second hand smoke. Time spent indoors and inside one’s residence represents a key microenvironment for an individual’s exposure to VOCs given that the primary sources of people’s exposure to VOCs are small and close to the person [33].
Notable limitations of the evaluation undertaken here include the fact that the data only represent short-term sampling (i.e., 24-hour, 4-day, or 7-day time weighted sampling) and none of the studies sampled a given residence more than once per season. Such approaches are limited by practical considerations such as timing and cost and likely result in misrepresentations of long-term
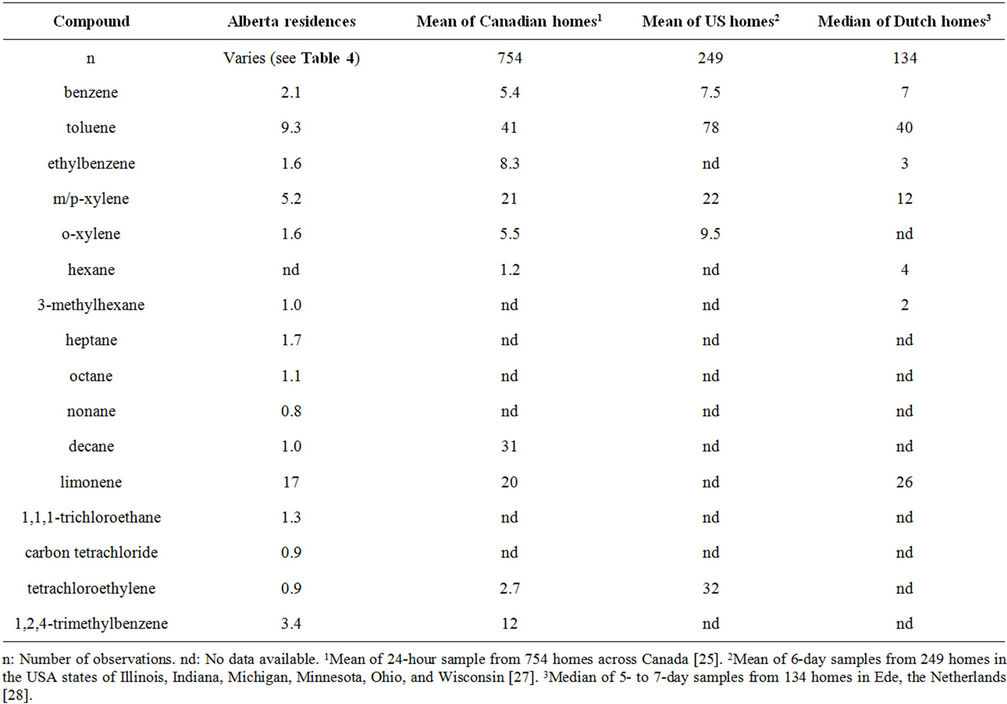
Table 6. Comparison of central tendency for indoor air concentrations (i.e., geometric mean, mean, or median) for selected VOCs measured in Alberta, Canada residences to other locations (µg/m3).
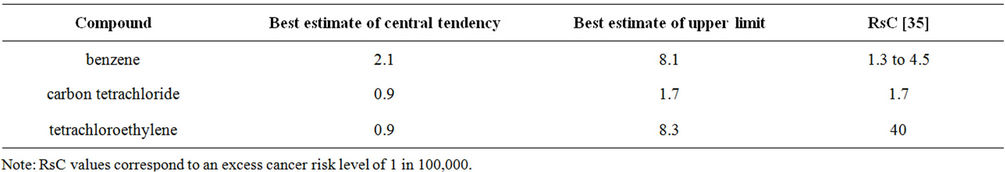
Table 7. Comparison of best estimates of central tendency and upper limit indoor concentrations in Alberta, Canada to Risk specific Concentration (RsC) values published by the US Environmental Protection Agency (μg/m3).
indoor concentrations in individual residences. However, the datasets used here represented sampling of over 700 residences during all seasons in Alberta. Another limitation is that the role of ventilation rate—which directly influences indoor VOC concentrations [39]—was not taken into consideration. Finally, these studies did not measure all VOCs that are known or suspected to occur in indoor air. Uncharacterized VOCs are often not measured because they are inadequately collected or analyzed by conventional methods [40]. Notwithstanding these limitations, summaries of typical and upper indoor VOC concentrations presented here can be used by others for evaluating measured and/or predicted indoor concentrations in Alberta residences.
4. Conclusion
Measures of central tendency and upper limit concentrations of selected indoor VOCs were estimated from seven studies in communities of Alberta, Canada. Best estimates of central tendency concentrations for 12 VOCs —benzene, ethylbenzene, o-xylene, 3-methylhexane, heptane, octane, nonane, decane, 1,1,1-trichloroethane, carbon tetrachloride, tetrachloroethylene, and 1,2,4 trimethylbenzene—were less than 5 µg/m3. Whereas, best estimates of central tendency concentrations for three VOCs—toluene, m/p-xylene, and limonene—were greater than 5 µg/m3. In the case of best estimates of upper limit concentrations; benzene, ethylbenzene, o-xylene, hexane, 3 methylhexane, heptane, octane, nonane, carbon tetrachloride, and tetrachloroethylene had upper limit concentrations less than 15 µg/m3. Best estimates of upper limit concentrations for toluene, m/p xylene, decane, limonene, 1,1,1-trichloroethane, and 1,2,4-trime-thylbenzene were greater than 15 µg/m3. Upper limit concentrations observed in Alberta residences were about 4 to 10 times higher than typical values for most of the VOCs observed. Finally, the data indicate that some homes in Alberta have levels of carbon tetrachloride and benzene that may be of concern from a public health point-ofview.
REFERENCES
- Alberta Treasury Board and Finance, “Alberta Demographic Spotlight—Recent Demographic Trends in Alberta’s Economic Regions,” Government of Alberta, Edmonton, 2011. www.finance.alberta.ca/aboutalberta/demographic_spotlights.html
- Agriculture and Rural Development, “Agroclimatic Atlas of Alberta: Climate of Alberta,” Government of Alberta, Edmonton, 2007. www1.agric.gov.ab.ca/$department/deptdocs.nsf/all/sag6299
- W. R. Ott, “Exposure Analysis: A Receptor-Oriented Science,” In: W. R. Ott, A. C. Steinemann and L. A. Wallace, Eds., Exposure Analysis, CRC Press, Boca Raton, 2007, pp. 3-32.
- J. A. Leech, K. Wilby, E. McMullen and K. Laporte, “The Canadian Human Activity Pattern Survey: Report of Methods and Population Surveyed,” Chronic Diseases in Canada, Vol. 17, No. 3, 1996, pp. 118-123.
- J. Heinrish, “Influence of Indoor Factors in Dwellings on the Development of Childhood Asthma,” International Journal of Hygiene and Environmental Health, Vol. 214, No. 1, 2011, pp. 1-25. doi:10.1016/j.ijheh.2010.08.009
- P. J. Franklin, “Indoor Air Quality and Respiratory Health of Children,” Paediatric Respiratory Reviews, Vol. 8, No. 4, 2007, pp. 281-286. doi:10.1016/j.prrv.2007.08.007
- C. J. Weschler, “Changes in Indoor Pollutants since the 1950s,” Atmospheric Environment, Vol. 43, No. 1, 2009, pp. 153-169. doi:10.1016/j.atmosenv.2008.09.044
- R. W. Clapp, G. K. Howe and M. M. Jacobs, “Environmental and Occupational Causes of Cancer: A Review of Recent Scientific Literature,” Lowell Center for Sustainable Production, University of Massachusetts, Lowell, 2005. www.sustainableproduction.org/downloads/Causes%20of%20Cancer.pdf
- United States Environment Protection Agency, “Technical Background Document to Support Rulemaking Pursuant to the Clean Air Act Section 112 (g)—Ranking of Pollutants with Respect to Hazard to Human Health,” United States Environment Protection Agency, Research Triangle Park, 1994.
- Alberta Health & Wellness, “Wood Buffalo Environmental Association Human Exposure Monitoring Program: Part I—Methods Report, Part II—2005 Monitoring Year Results,” Alberta Health & Wellness, Edmonton, 2005. www.health.alberta.ca/newsroom/publications.html
- R. K. Miyagawa, “Personal Air Sampling of Volatile Organic Compounds in Fort McKay, Alberta,” Master Thesis, University of Alberta, Edmonton, 2001. www.collectionscanada.gc.ca
- G. Hoeksema, “Atmospheric BTEX in Fort McKay, AB: A Comparison with Baseline Measurements,” Master Thesis, University of Alberta, Edmonton, 2007. www.collectionscanada.gc.ca
- Alberta Health & Wellness, “The Grande Prairie and Area Community Exposure and Health Effects Assessment Program,” Alberta Health & Wellness, Edmonton, 2002. http://www.health.alberta.ca/newsroom/publications.html
- Alberta Health & Wellness, “Fort Saskatchewan and Area Community Exposure and Health Effects Assessment Program,” 2003. http://www.health.alberta.ca/newsroom/publications.html
- S. M. Probert, “Community Sampling of Volatile Organic Compounds in the Capital Health Region: A Health Perspective,” Master Thesis, University of Alberta, Edmonton, 2000. www.collectionscanada.gc.ca
- Alberta Health & Wellness, “Wabamun and Area Community Exposure and Health Effects Assessment Program,” 2006. http://www.health.alberta.ca/newsroom/publications.html
- R. W. Whitmore, “Design of Surveys for Residential and Personal Monitoring of Hazardous Substances,” Atmospheric Environment, Vol. 22, No. 10, 1988, pp. 2077- 2084. doi:10.1016/0004-6981(88)90119-9
- D. J. Casley and K. Kumar, “The Collection, Analysis, and Use of Monitoring and Evaluation Data,” Johns Hopkins University Press, Baltimore, 1988.
- United States Environment Protection Agency, “Guidance for Choosing a Sampling Design for Environmental Data Collection, EPA QA/G-5S. EPA/240/R-02/005,” United States Environment Protection Agency, Washington DC, 2002.
- R. L. Scheaffer, W. Mendenhall and R. L. Ott, “Elementary Survey Sampling,” 5th edition, Duxbury Press, New York, 1996.
- 3M, “Organic Vapor Monitor Sampling and Analysis Guide: Organic Vapor Monitors 3500/3510 and Organic Vapor Monitors 3520/3530,” 3M Occupational Health and Environmental Safety Division, St. Paul, 1998.
- R. M. Byanju, M. B. Gewali and K. Manandhar, “Passive Sampling of Ambient Nitrogen Dioxide Using Local Tubes,” Journal of Environmental Protection, Vol. 3, No. 2, 2012, pp. 177-186. doi:10.4236/jep.2012.32022
- P. Fellin and R. Otson, “Assessment of the Influence of Climatic Factors on Concentration Levels of Volatile Organic Compounds (VOCs) in Canadian Homes,” Atmospheric Environment, Vol. 28, No. 22, 1994, pp. 3581- 3586. doi:10.1016/1352-2310(94)00204-X
- I. Burstyn, X. You, N. Cherry and A. Senthilselvan, “Determinants of Airborne Benzene Concentrations in Rural Areas of Western Canada,” Atmospheric Environment, Vol. 41, No. 36, 2007, pp. 7778-7787. doi:10.1016/j.atmosenv.2007.06.011
- C. W. Chung, M. Morandi, T. Stock and M. Afshar, “Evaluation of a Passive Sampler for Volatile Organic Compounds at ppb Concentrations, Varying Temperatures, and Humidities with 24-h Exposures; 2. Sampler Performance,” Environmental Science and Technology, Vol. 33, No. 20, 1999, pp. 3666-3671. doi:10.1021/es990613f
- J. Begerow, E. Jermann, T. Keles and L. Dunemann, “Performance of Two Different Types of Passive Samplers for the GC/ECD-FID Determination of Environmental VOC Levels in Air,” Fresenius’ Journal of Analytical Chemistry, Vol. 363, No. 4, 1999, pp. 399-403.
- B. Oury, F. Lhuillier, J.-C. Protois and Y. Morele, “Behavior of the GABIE, 3M 3500, PerkinElmer Tenax TA, and Radiello 145 Diffusive Samplers Exposed over a Long Time to a Low Concentration of VOCs,” Journal of Occupational and Environmental Hygiene, Vol. 3, No. 10, 2006, pp. 547-557. doi:10.1080/15459620600906613
- U. Schlink, M. Rehwagen, M. Damm, M. Richter, M. Borte, and O. Herbarth, “Seasonal Cycle of Indoor-VOCs: Comparison of Apartments and Cities,” Atmospheric Environment, Vol. 38, No. 8, 2004, pp. 1181-1190. doi:10.1016/j.atmosenv.2003.11.003
- P. Fellin and R. Otson, “Seasonal Trends of Volatile Organic Compounds (VOCs) in Canadian Homes,” Proceedings of the 6th Conference on Indoor Air Quality and Climate, Vol. 2, 1993, pp. 117-122.
- K. B. Hoddinott and A. P. Lee, “Establishing Background Levels of Risk for Residential Indoor Air,” Proceedings of the 1st NSF International Conference on Indoor Air Health: Impacts, Issues and Solutions, Ann Arbor, 1999, pp. 260-269.
- E. Lebret, H. L. van de Wiel, H. P. Bos, D. Noij and J. S. M. Boleij, “Volatile Organic Compounds in Dutch Homes,” Environment International, Vol. 12, No. 1-4, 1986, pp. 323-332. doi:10.1016/0160-4120(86)90046-2
- W. R. Ott, “Environmental Statistics and Data Analysis,” CRC Press, Boca Raton, 1995.
- W. B. Kindzierski, “Importance of Human Environmental Exposure to Hazardous Air Pollutants from Gas Flares,” Environmental Reviews, Vol. 8, No. 1, 2000, pp. 41-62. doi:10.1139/a00-005
- United States Environment Protection Agency, “Integrated Risk Information System (IRIS),” United States Environment Protection Agency, Washington DC, 2012. www.epa.gov/iris/
- Health Canada, “Federal Contaminated Site Risk Assessment in Canada. Part I: Guidance on Human Health Preliminary Quantitative Risk Assessment (PQRA),” Health Canada, Ottawa, 2004. www.federalcontaminatedsites.gc.ca/publications/index-eng.aspx
- W. Kindzierski, J. Jin and M. Gamal El-Din, “Plain Language Explanation of Human Health Risk Assessment, OSRIN Report No. TR-14,” Oil Sands Research and Information Network, University of Alberta, Edmonton, 2011. www.osrin.ualberta.ca/en/OSRINPublications.aspx
- M. D. Jackson, L. A. Sparks, B. A. Tichenor, and J. B. White, “Evaluating Sources of Indoor Air Pollution,” Journal of the Air and Waste Management Association, Vol. 40, No. 4, 1990, pp. 487-492. doi:10.1080/10473289.1990.10466703
- R. Otson, P. Fellin and Q. Tran, “VOCs in Representative Canadian Residences,” Atmospheric Environment, Vol. 28, No. 22, 1994, pp. 3563-3569. doi:10.1016/1352-2310(94)00201-U
- P. Wolkoff and G. D. Nielsen, “Organic Compounds in Indoor Air—Their Relevance for Perceived Indoor Air Quality,” Atmospheric Environment, Vol. 35, No. 26, 2001, pp. 4407-4417. doi:10.1016/S1352-2310(01)00244-8
- P. Wolkoff, P. A. Clausen, B. Jensen, G. D. Nielsen and C. K. Wilkins, “Are We Measuring the Relevant Indoor Pollutants?” Indoor Air, Vol. 7, No. 2, 1997, pp. 92-106. doi:10.1111/j.1600-0668.1997.t01-2-00003.x