Smart Grid and Renewable Energy
Vol. 4 No. 1 (2013) , Article ID: 28129 , 12 pages DOI:10.4236/sgre.2013.41009
Wind Energy Conversion Systems Adapted to the Tunisian Sites
![]()
1Department of Technology, Preparatory Institute for Engineering Studies of Sfax (IPEIS), Sfax, Tunisia; 2Electric Networks and Machines Research Unit, National Institute of Applied Sciences and Technology (INSAT), Tunisia.
Email: Fathi.Benamar@ipeis.rnu.tn
Received December 19th, 2011; revised November 20th, 2012; accepted November 27th, 2012
Keywords: Tunisia; Wind Energy; Wind Turbine; Meteorological Method
ABSTRACT
The choice of a wind turbine for a given site is a very significant operation. It is advised to make an in-depth study on the characteristics of the aerogenerator and the implantation site before any installation of a wind farm for choosing well the system best adapted to the energy needs. The objective of this study is to sensitize the users of the wind energy on the various problems involved in the aerogenerator installation on any site and to provide a decision-making aid to the judicious choice of the wind system best adapted. The idea is to estimate, for a selected implantation site, the energy production and the operating time of several wind systems. We can thus select the aerogenerator best adapted by making a compromise between a maximum recovery of energy and a high time of production. The influence height of the aerogenerator on energy profitability is also studied. We apply this step to the twenty six Tunisian synoptic sites by implantation scenarios of seven wind systems of various nominal speeds in function of the height.
1. Introduction
Face to the environmental problems caused by the greenhouse gas emissions during exploitation of the conventional resources, other alternative energy resources were and must continue to be developed. Among them, we can quote the inexhaustible renewable energy resources, which enable us to produce electricity more and more easily and properly.
In this study, we are mainly interested in the wind power which is regarded as a promising source in the improvement of the energy balance and the environmental preservation. In reality, the realization of a wind power station must take into account the wind resource. Thus, the study of the wind potential is a fundamental component of a wind project which determines the annual production and which allows the project manager to establish its business plan [1-8]. An error of a few percentages in the evaluation of the wind potential can have disastrous consequences on the future profitability of the project.
In this study, we propose a practical approach enabling to estimate energy provided by a given wind system on an implantation site chosen. This approach, taken with several machines and for various heights above ground level, results in a phase of optimal choice of the best adapted aerogenerator to the retained site while basing itself on energy efficiency, economic and technical of wind installation.
This approach is applied to the twenty six synoptic sites distributed on all the Tunisian territory. The implantation scenarios carried out on seven different wind systems and according to the height, enable us to select the best adapted aerogenerators to the Tunisian sites.
2. Analysis of Measured Wind Data
The wind is a clean, renewable and increasingly economical energy; but it is a variable phenomenon. However, the wind energy production depends on this variation. Consequently, we need to evaluate the wind characteristics of the site to be able to conceive a wind project. In the same way, this study offers to the investors to determine the estimated production of the future wind installation.
2.1. Geographical Situation and Relief of Tunisia
First, Tunisia is a Mediterranean country of a surface of 164,154 km2. It is located between altitude 30˚N and 37˚N latitude and between 8˚E and 12˚E longitude [4,9-11]. Its littoral extends on 1300 km and comprises five large gulfs. Tunisia has common borders with Algeria to the West and with Libya to the South. The country can be divided into three zones (Figure 1):
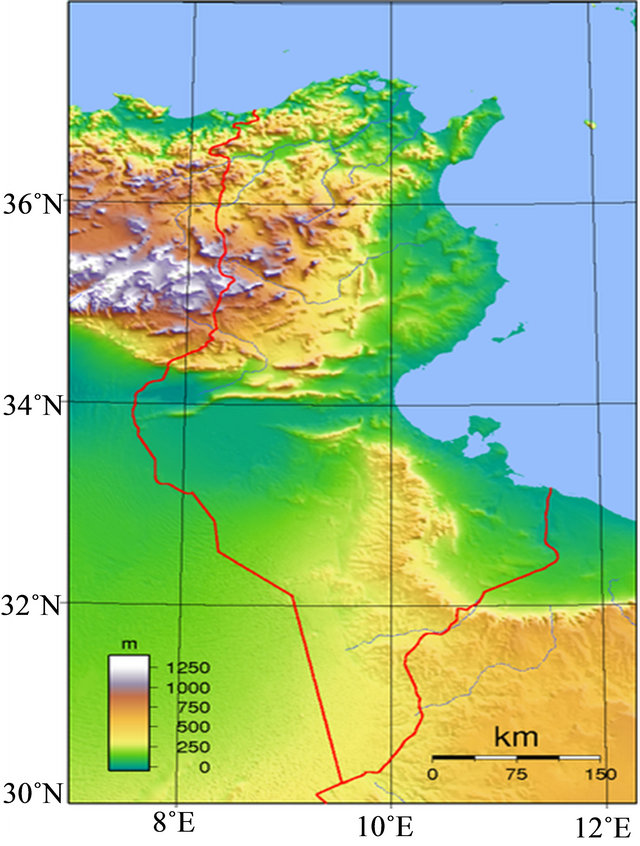
Figure 1. Geographical position and relief of Tunisia.
- Littoral Tunisia which extends to the East from Bizerte to the Sahel (Sfax) composed primarily of hills and plains.
- Interior Tunisia composed essentially of mountains and valleys.
- Tunisian desert, which represents 55% of the whole of the Tunisian territory.
Surrounded by the Mediterranean, Tunisia has a Mediterranean climate to the North of the country and desert to the South. The climate is generally soft. The annual temperature varies between 10˚ and 20˚ in winter and between 20˚ and 36˚ in summer. The temperature can reach 45˚ in summer for the areas of the Tunisian South.
2.2. Methodology Used
To reveal the good sites of wind in Tunisia, it is necessary to evaluate the wind characteristics (mean speed, power density and available energy) in the 26 meteorological sites distributed on all the Tunisian territory. The analysis of the wind is carried out using the meteorological method [9-11] using the measurement tables of the I.N.M. (Meteorology National Institute) indicating the cumulated frequency  of the wind speeds “superior or equal” at the classified speeds
 . The occurrence frequency
  is defined by the following relation
 (1)
(1)
The characteristic speeds of the wind (the mean , the most energetic
  and the most frequent
 ) are defined by the following expressions:
 (2)
(2)
 (3)
(3)
 (4)
(4)
The power density varies considerably according to the places and days’. It depends on the speed and on the wind frequency. The power density of the wind, per unit of surface swept by the turbine blades, is given by the following expression:
 (5)
(5)
with  is the air density, equal to 1.225 Kg/m3 for a temperature of 15˚C and a pressure of 1013 mb.
Similarly, the available wind potential in the study site, per unit area and for a year, is expressed by:
 (6)
(6)
2.3. Frequency and Energy Distribution of the Wind Speed
Based on hourly meteorological data provided by the I.N.M. in the form of tables to 16 directions and for a five year period (2004-2009), we trace the histograms of the frequency and the energy of classified wind speeds (all confused directions) for the twenty six Tunisian sites (Figure 2).
The measurements are taken with a standard height of 11 m above ground level and in an open area. Thus we can determine the areas most favorable for the exploitation of the wind in Tunisia.
The result of the analysis of Figure 2 shows that the statistical distribution of the available wind energy is, because of the variation with the cube of the speed, shifted towards the high values of the wind speed: this explains why, for a given site, the most frequent speed contributes very slightly to total energy and is always lower at the most energetic speed; while the frequency of the most frequent speed is always superior than the frequency of the most energetic speed.
2.4. Analysis of Wind Characteristics
Table 1 gives the numerical results of the wind characteristics (the mean speed , the most frequent speed
 , the most energetic speed
 , the power density
  and the available energy
 ) for the twenty six synoptic sites.
At the height 11 m above ground level, the wind characteristics in Tunisia are modest. Indeed, the annual mean wind speed varies between a minimum of 2.09 m/s (in Kairouan) and a maximum of 5.45 m/s (in Thala). In
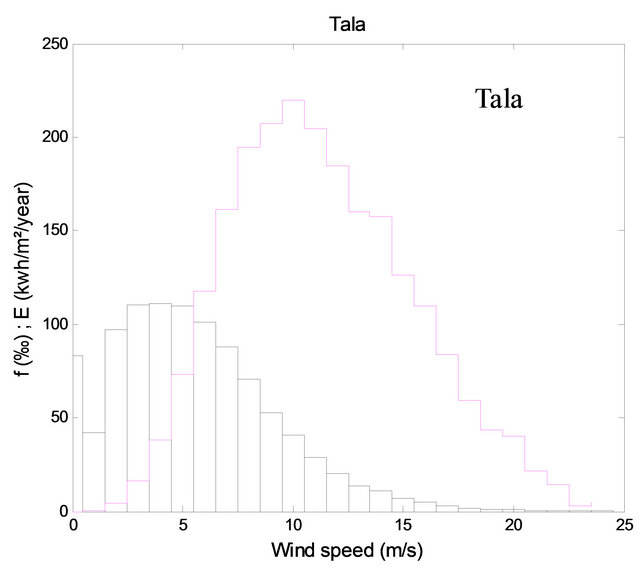
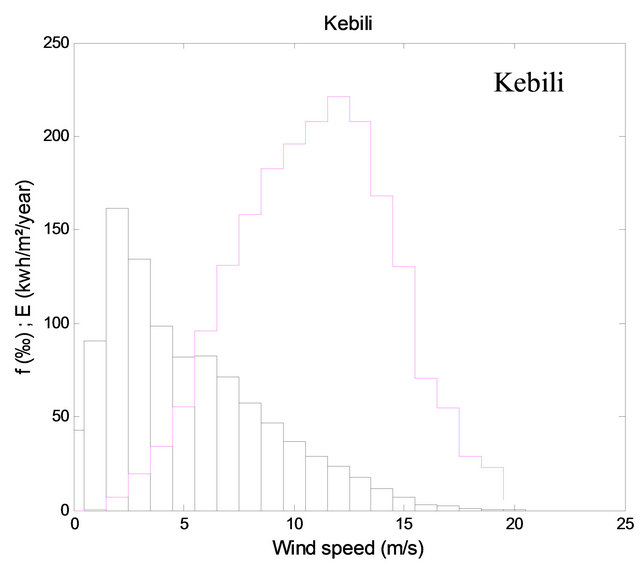
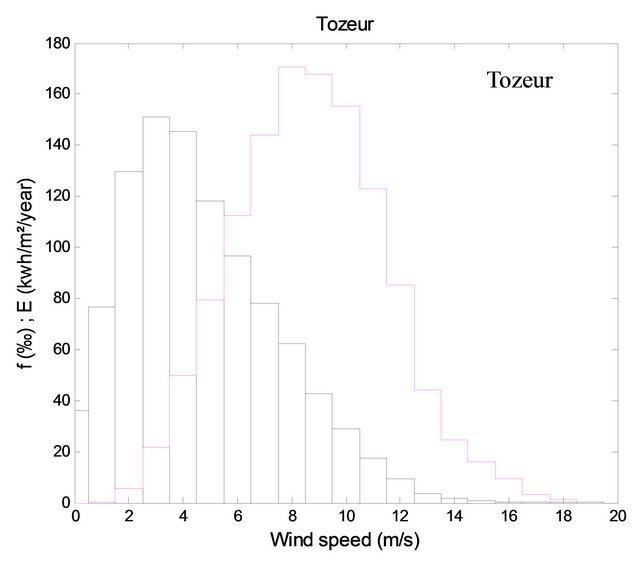

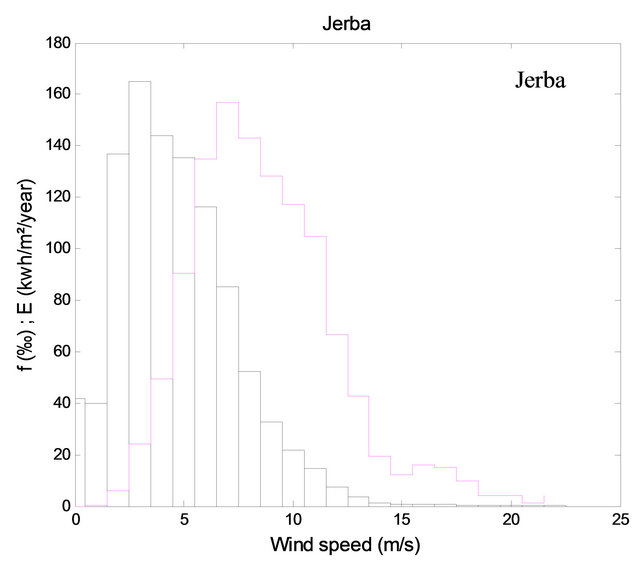

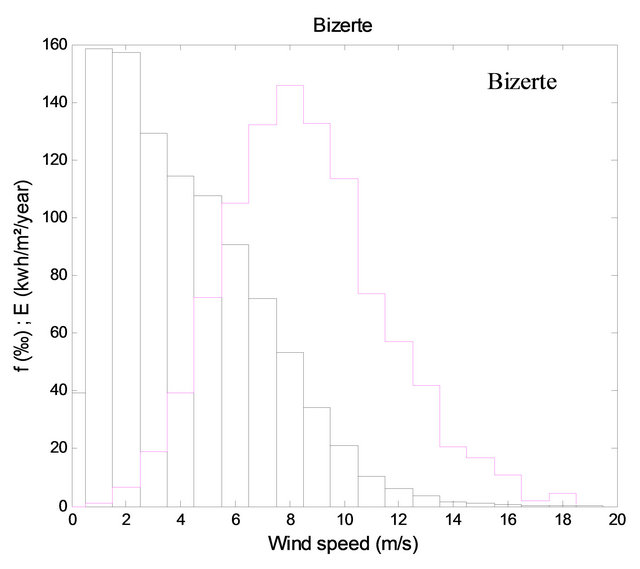

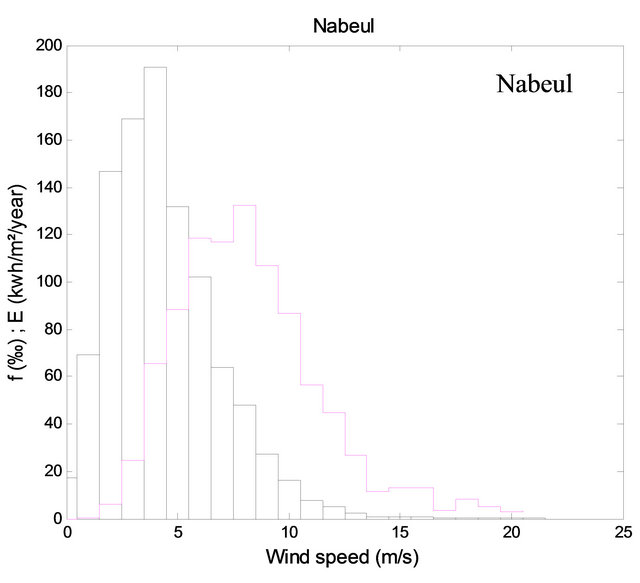
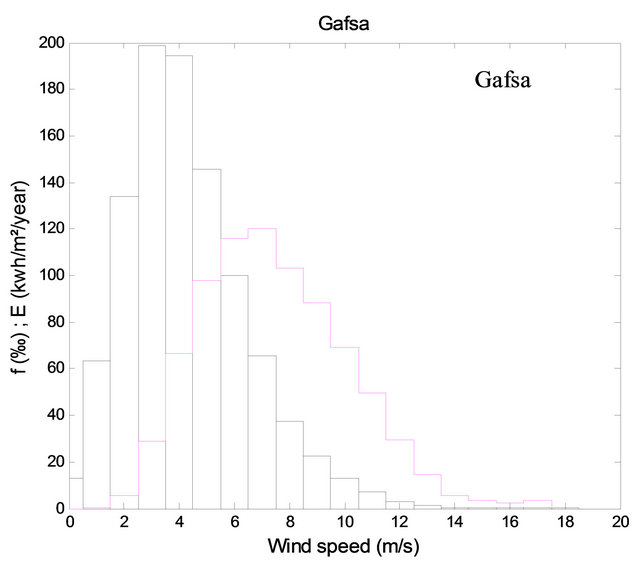
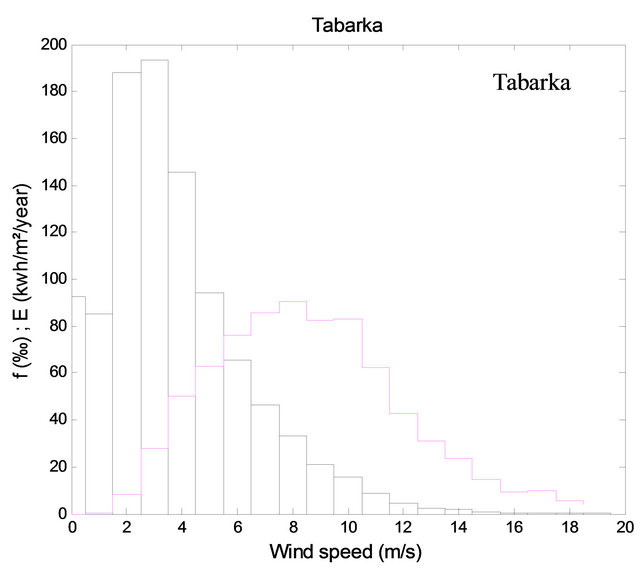


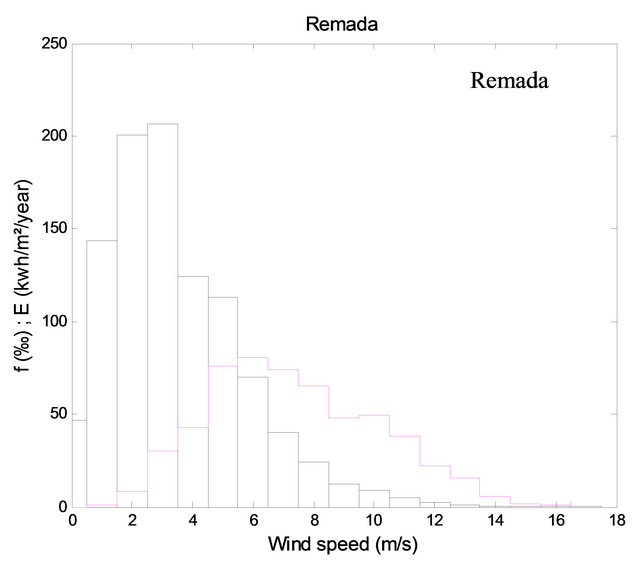
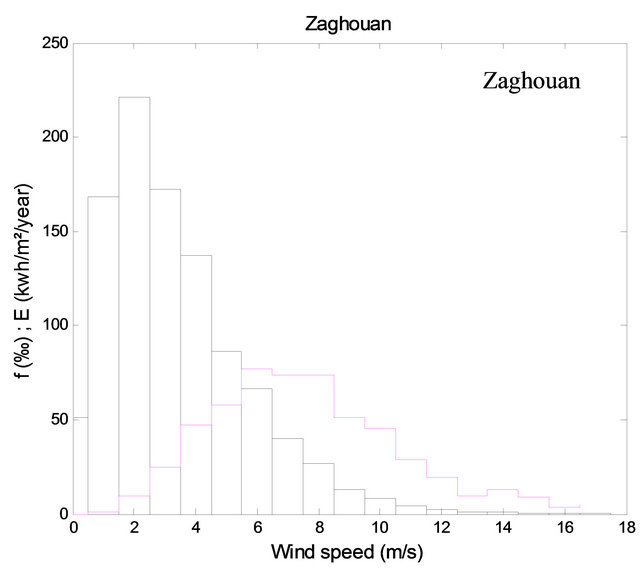
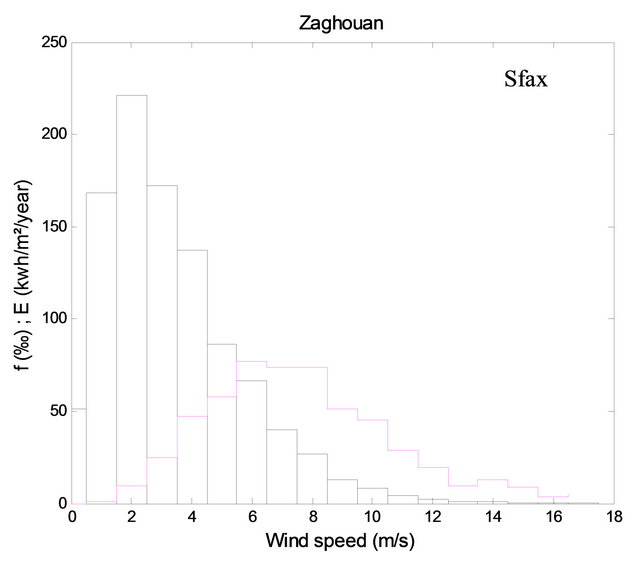
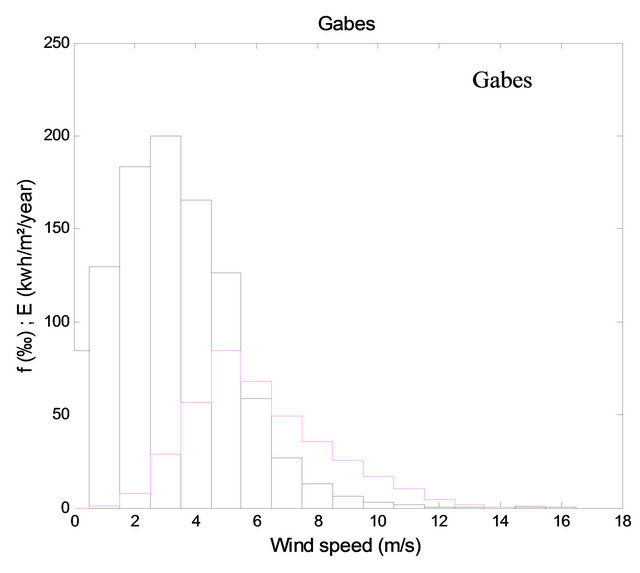
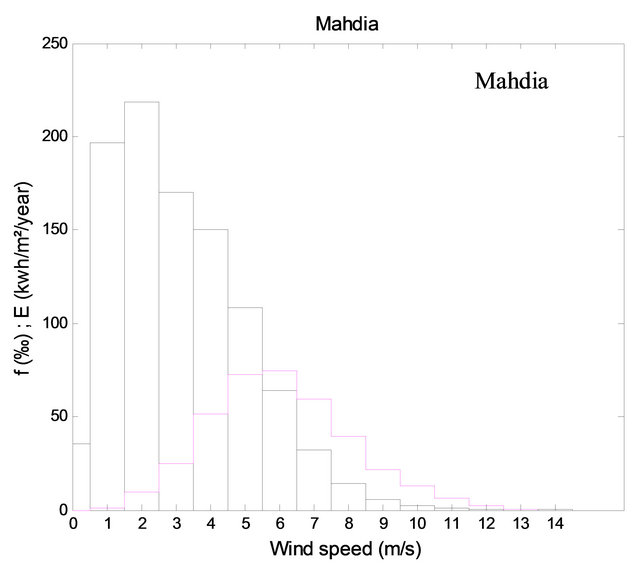
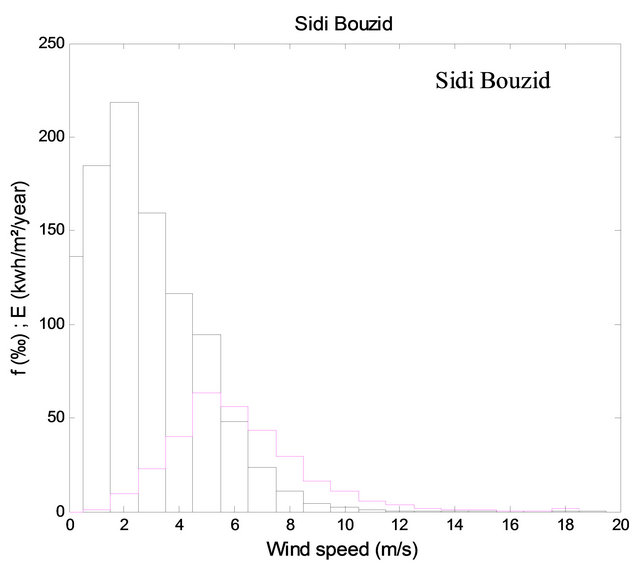
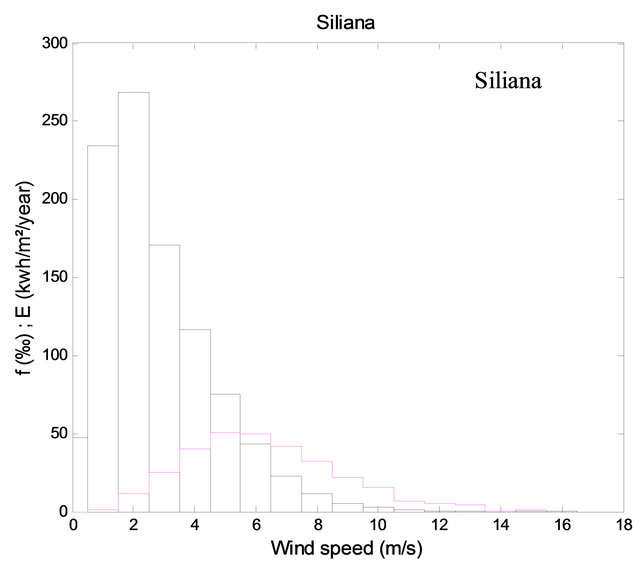
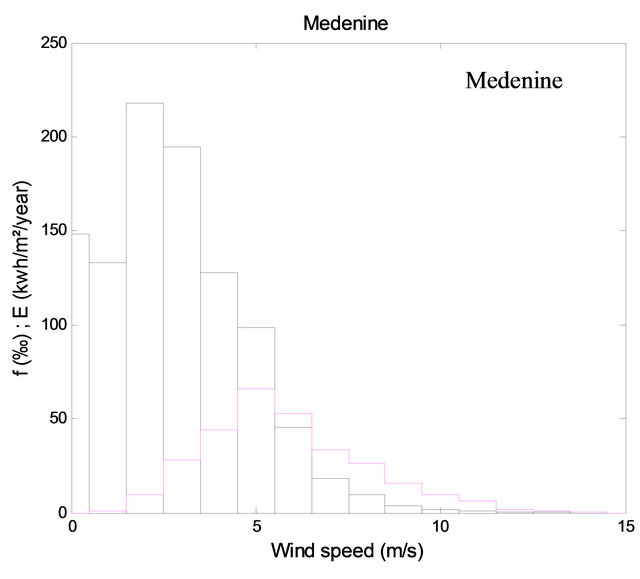
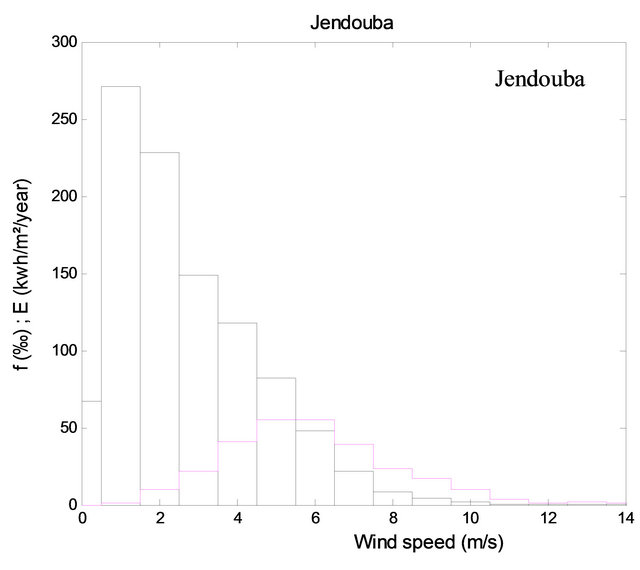
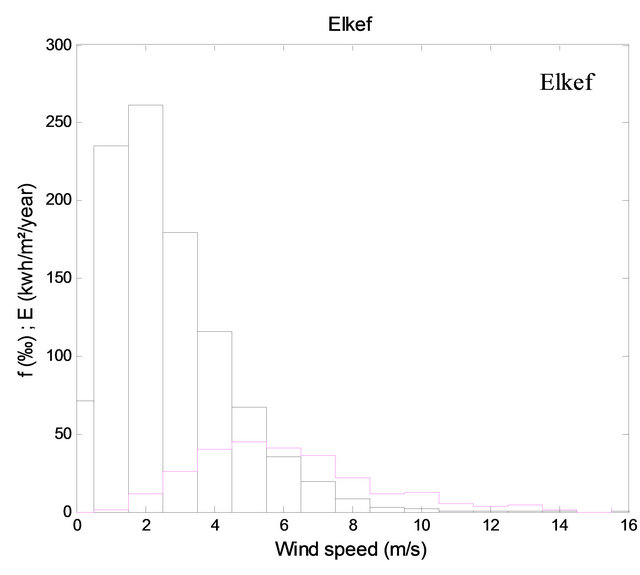
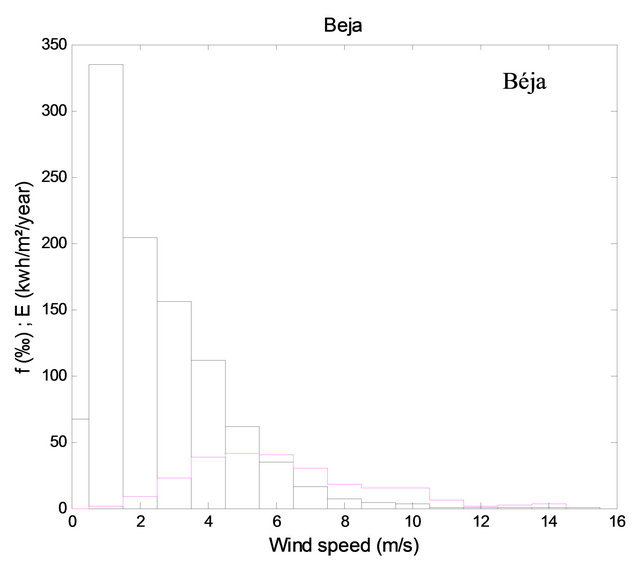
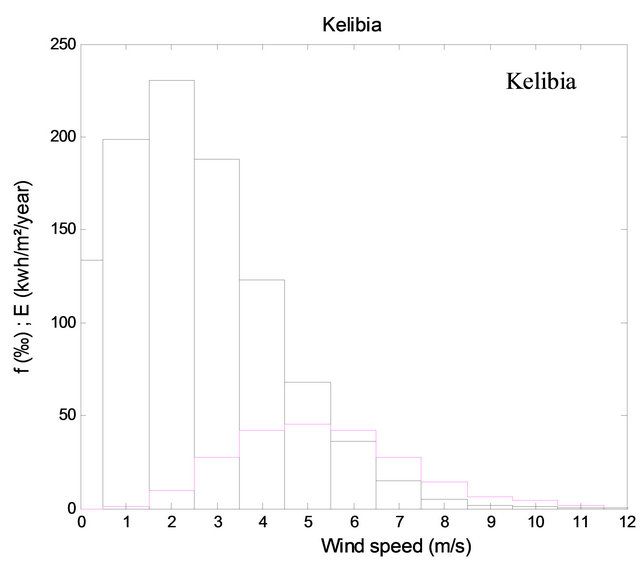
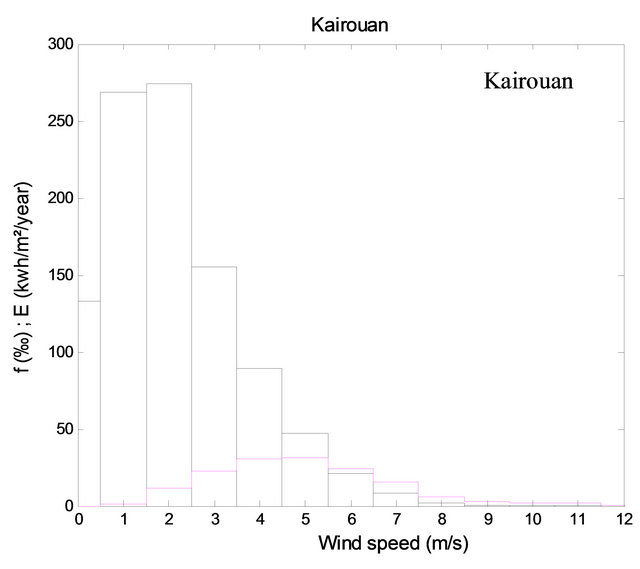

Figure 2. Frequency and energy distributions of the classified wind speeds for various sites to 11 m high in an open area.
general, an average is needed exceeding 4 m/s to justify the wind turbine installation. Similarly, the annual power density (respectively available wind energy), per unit of area, also varies between 17.29 W/m2 (respectively, 151.43 kW/m2/year) in Kairouan and 256.49 W/m2 (respectively 2246.83 kW/m2/year) in Thala.
The analysis of Table 1 has enabled us to classify these sites in four groups [9]:
Ÿ A first group of excellent wind potential, noted (A) whose energy is superior to 2000 kWh/m2/year. It is formed of two sites Thala and Kebili. It covers 20.49% of the available total energy in the twenty six sites. The annual mean wind speed exceeds 5 m/s. This group presents the energy zone and most promising for the exploitation of the wind power.
Ÿ A second group of good wind potential, noted (B), in which energy varies from 800 to 2000 kWh/m2/year. It comprises eight sites (Elborma, Tozeur, Jerba, Monastir, Nabeul, Gafsa, Bizerte and Kasserine) and accounts for 45.5% of total energy. The annual mean wind speed is between 4 and 5 m/s.
Ÿ A third group of average wind potential, noted (C), interests eight sites (Tunis, Tabarka, Sfax, Tataouine, Remada, Zaghouan, Gabès and Mahdia) and covers only 23.1% of total energy. Its wind energy varies from 350 to 800 kWh/m2/year. The annual mean wind speed is between 3 and 4 m/s.
Ÿ A fourth group of low wind potential, noted (D), concerns eight sites (Siliana, Kelibia, Jendouba, Sidi Bouzid, Medenine, Elkef, Béja and Kairouan) and covers only 10.91% of total energy. Its wind energy is lower than 350 kWh/m2/year. The annual mean wind speed is lower than 3 m/s.
Also, it was possible to establish maps of the annual spatial distribution of mean speed and available energy of wind for the whole country (Figures 3 and 4). These cards, as was expected, have significant similarities and clearly indicate the regions most favorable for the exploitation of the wind energy in Tunisia.
Thus, the most interesting zones for the exploitation of the wind energy arise clearly (Figures 1 and 2): they lie in the North, North-East, West and South of Tunisia. On the other hand, the zones where the annual mean wind speed is lower than 4 m/s, like the regions located inside the country in the North-West and South-East, are much less favorable to the use of the wind energy. As an example, in the Jandouba region, to recover a total energy identical to that which one can discount in Bizerte, it will be necessary to use a wind turbine of diameter more important and/or located on a higher pylon. The cost of the installation will be consequently much larger.
We also note that a variation of 30% of the annual mean wind speed from one site to another, which is not exceptional, involves a variation of wind energy of a factor 2 (for instance, see the characteristics of the Kasserine and Kebili sites).
Practically, it is interesting to implant the wind turbine distant from any obstacle and sufficiently high to take the maximum of energy [12-14]. That is why we are interested in the study of the influence of the mast height of the wind systems on energy profitability.
2.5. Influence of Height on the Wind Resource
The Von Karman theory showed that, for a flow under constant flux and neutral atmospheric conditions, the profile of the wind speed is a logarithmic curve of the
Table 1. Wind characteristics for different sites at 11 m height in an open area.
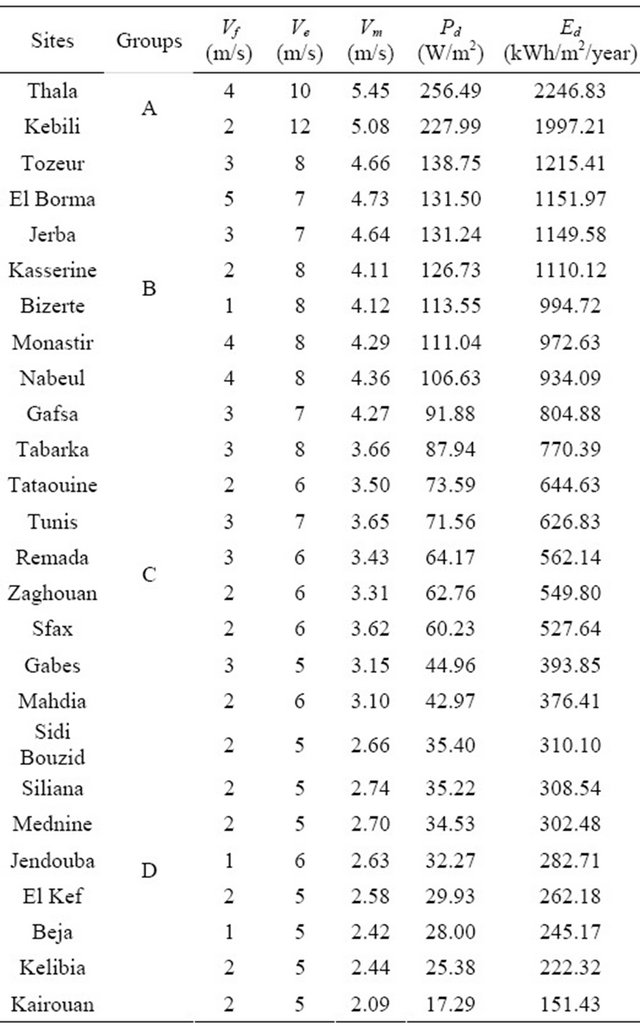
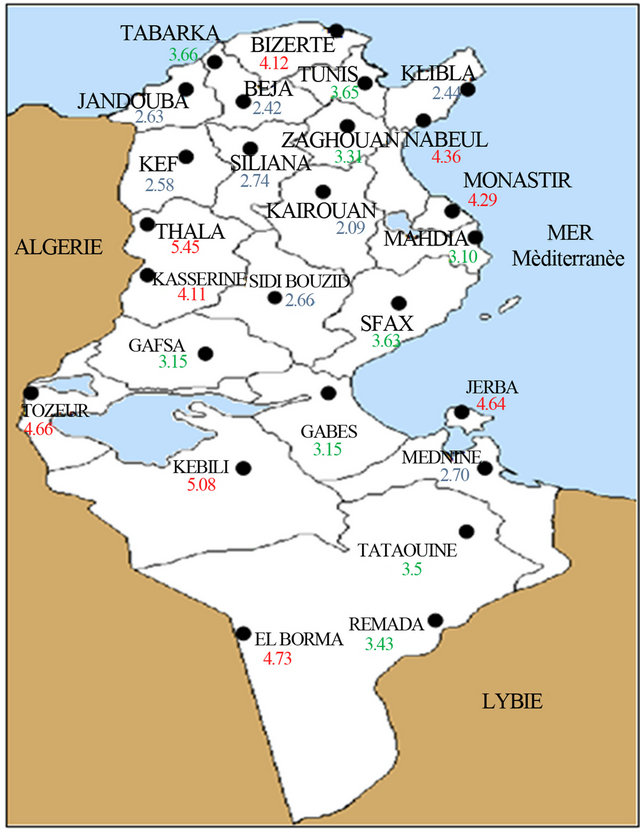
Figure 3. Annual mean wind speed at 11 m height in an open area (in m/s).
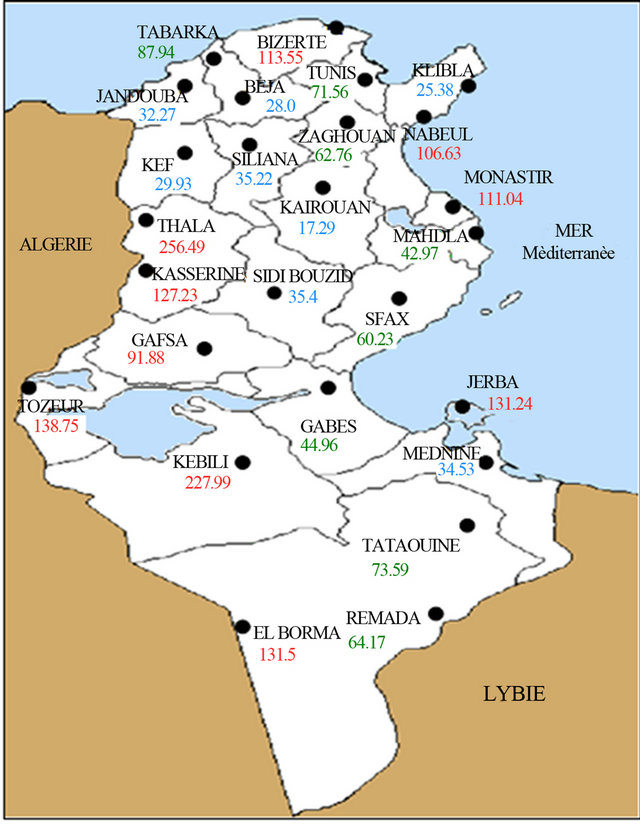
Figure 4. Available power density from wind at 11 m height in an open area (in W/m2).
form [11-15]:
 (7)
(7)
with:  is the mean flow speed to altitude
 .
.
In the Tunisian meteorological stations, the wind speeds measurements are taken to 11 m height above ground level. These stations are often located at airports and having an open area roughness ( = 0.07 m). So, to transpose the data that is available (at 11 m) at the level that interests us (such as the propeller height), it is necessary to correct the wind measurements.
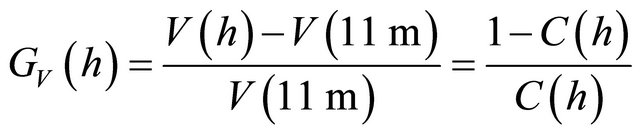
If we relate the measured speed (at 11 m) at height , we obtain the following correction factor
  (Figure 5):
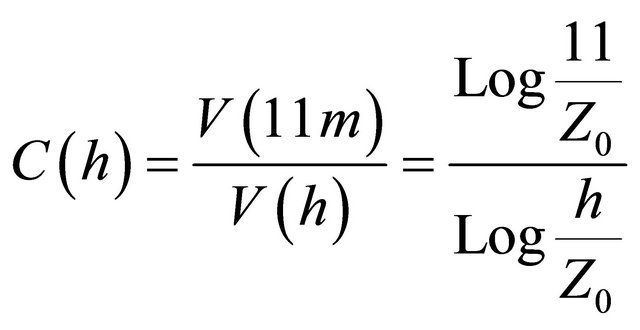 (8)
(8)
The new values of the wind characteristics  calculated at the height h will be estimated directly starting from the wind characteristics to the height 11 m by the following relations:
Corrected mean speed:
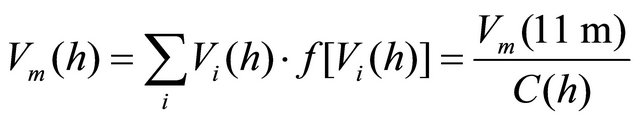 (9)
(9)
Corrected most frequent speed:
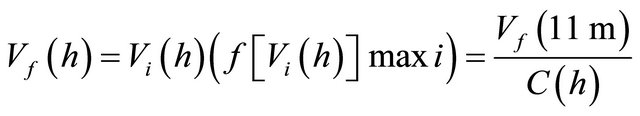 (10)
(10)
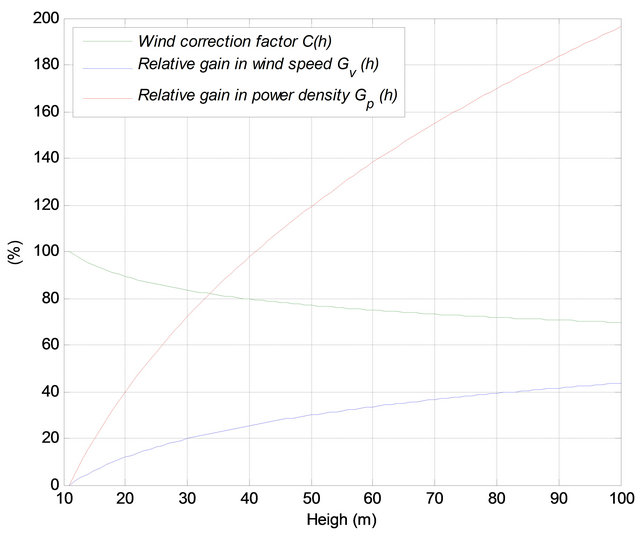
Figure 5. Influence of height on wind characteristics.
Corrected most energetic speed:
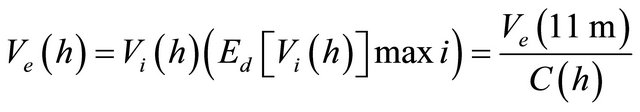 (11)
(11)
Corrected power density:
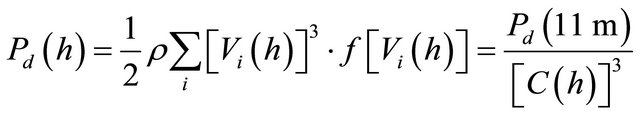 (12)
(12)
Corrected available wind energy:
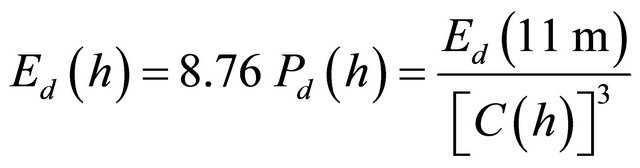 (13)
(13)
The vertical extrapolation of the measured wind characteristics at 11 m height to a desired height  implies a relative gain in speed
  and a relative gain in power
  of expressions:
 (14)
(14)
 (15)
(15)
For example, extrapolation of data measured at 100 m height enables an increase of 43% on the characteristic speeds (mean , energetic
  and frequent
 ) of the wind and 190% on the power density (Figure 5).
3. Site-Wind Turbine Adaptation
3.1. Usable Wind Energy
The typical curve of a wind turbine is defined by Figure 6. Because of the operating mode of the wind systems, recoverable energy at the exit of a wind system represents only one portion of the available energy  in the wind [16-19].
The usable wind energy varies both with the values of the machine characteristic speeds (cut-in speed , nominal speed
  and cut-out speed
 ), i.e. with the type of wind turbine considered, and with the site via the wind frequency distribution
 . It is defined, per unit area and during one year, as follows:
 (16)
(16)
The extrapolation of this energy in function of height h is written:
 (17)
(17)
The values of the characteristic speeds of a wind turbine depend on the type and the size of the wind machines.
They must be adapted in function of the wind characteristics of the establishment site. We study, for the 26 meteorological stations and the 7 types of wind turbines defined by , the wind energy ratio
 :
:
 (18)
(18)
and the annual operating time Tf :
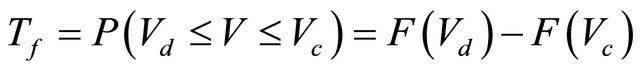 (19)
(19)
Let us note that  is independent of the nominal speed
  of the machine.
3.2. Application to the Tunisian Meteorological Sites
The objective of this paragraph is to provide a help to
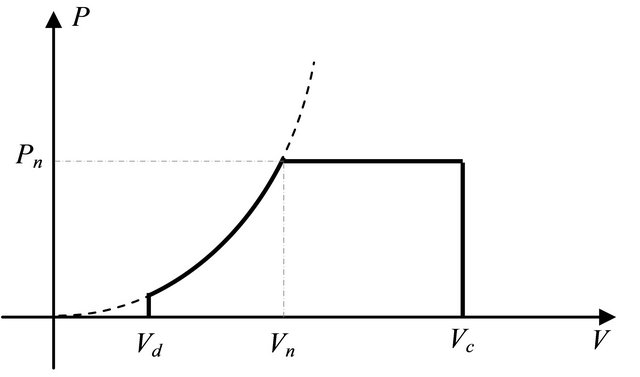
Figure 6. Ideal power curve of the wind turbine.
judiciously choose the best wind system adapted to a selected implantation site [6].
For this purpose, we have chosen 7 types of wind turbines defined by their nominal speeds 

 . The cut-in
  and cut-out
  speeds are constants and are respectively equal 3 and 25 m/s.
The selected height is of 60 m above ground level, which corresponds to a corrective factor  (60) = 75%, a relative gain in speed
  = 33% and a relative gain in power density
  = 137% (compared to the speed and the power density at 11 m height). Table 2 gives the new values of the wind characteristics to the 60 m height.
For the 26 meteorological stations distributed on the whole of the Tunisian territory and for 7 chosen types of wind turbines, Figures 7 and 8 give the annual wind energy ratio  and the annual operating time
 at the 60 m height.
The analysis of Figure 7 shows that:
Table 2. Extrapolation of the wind characteristics for different sites at 60 m height in an open area.
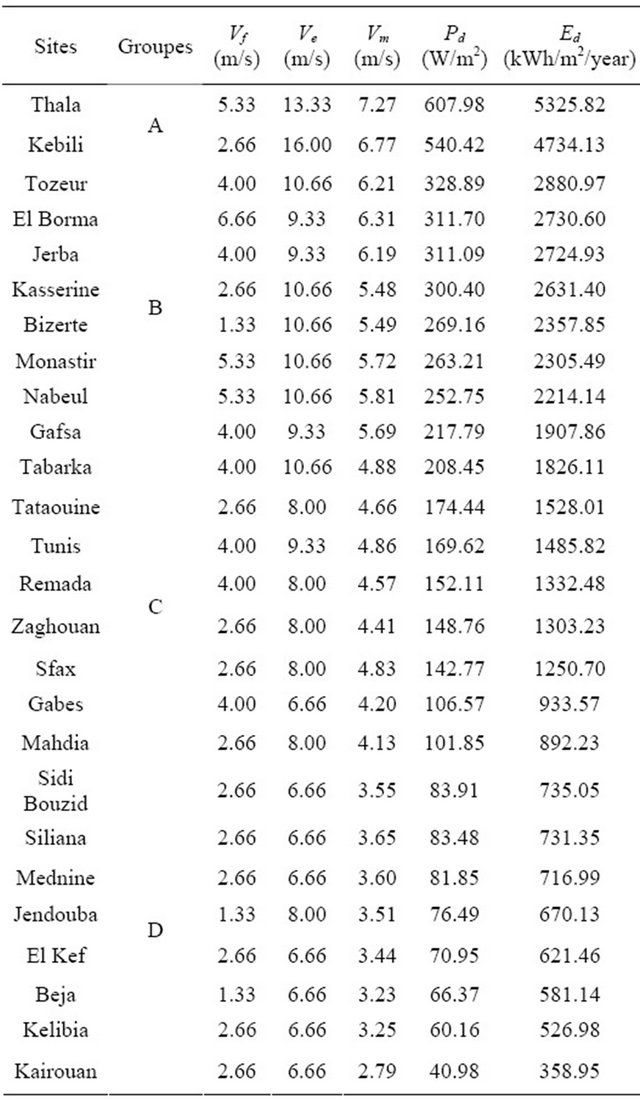
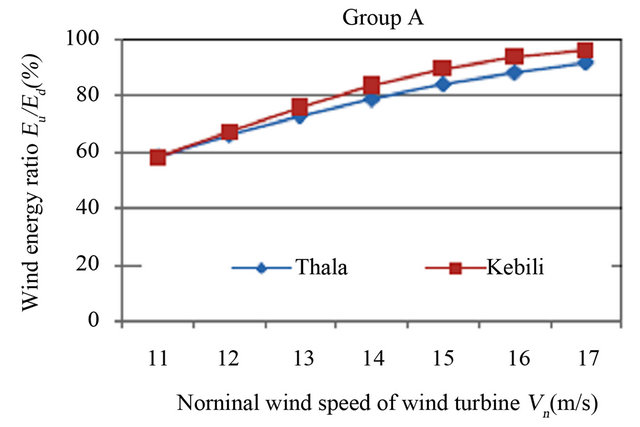
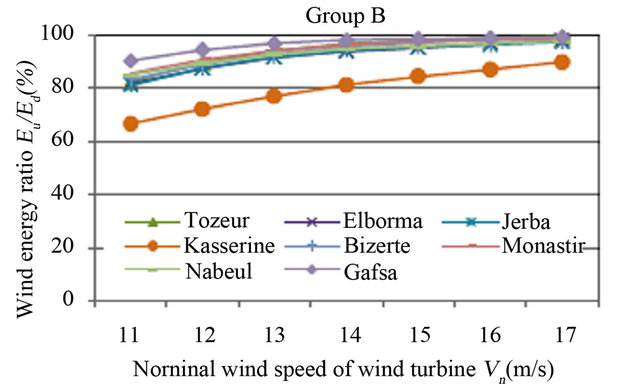
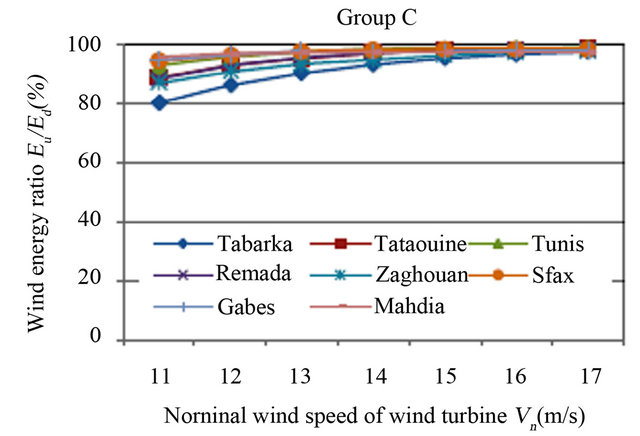
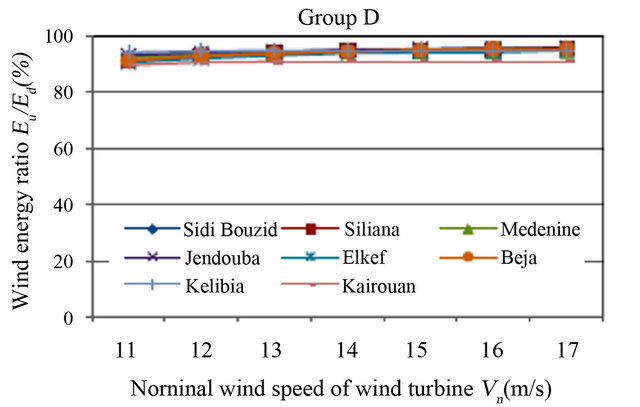
Figure 7. Annual percentages of wind energy ratio Eu/Ed at 60 m height for each sites group.
• For the most windy regions (sites of group A), the wind energy ratio increases with the nominal speed of the aerogenerator and varies between 60% and 95%.
• For the regions of good wind potential (sites of group B), the wind energy ratio is less sensitive to the machines of nominal speeds superior or equal to 15 m/s and varies between 96% and 98% (except for the Kasserine site).
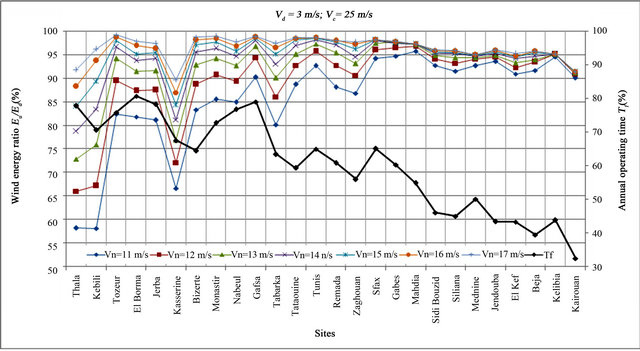
Figure 8. Annual percentages of operating time Tf and wind energy ratio Eu/Ed at 60 m height for seven types of wind turbine.
• For the regions of average wind potential (sites of group C), the variation of the wind energy ratio is weak and varies between 97% and 98% for machines of nominal speeds superior or equal to 14 m/s (except for the Tabarka site).
• For the slightly windy regions (sites of group D), the wind energy ratio is very high (superior to 90%) and varies little with the aerogenerator type.
The examination of Figure 8 shows that the annual percentage of the operating time of a wind system is better for the windiest regions (groups A and B). Indeed, this percentage varies between 64.5% (in Bizerte) and 80.6% (in Elborma). For the less windy regions (groups C and D), this percentage degrades and reaches the minimal value of 32.5% (in Kairouan).
The simultaneous comparison of the annual percentages of the operating time and the wind energy ratio shows the need to choose the type of machine which adapts better to the implantation site. Indeed, it is necessary to realize a compromise between a maximum recovery of energy, a high time of production, and a good economic and technical profitability of the installation. A satisfactory compromise would be obtained while choosing (Figure 8):
• Machine of  = 17 m/s for the very windy sites (group A).
• Machine of  = 15 m/s for the windy sites (group B).
• Machine of  = 14 m/s for the fairly windy sites (group C).
• Machine of  = 11 m/s for the slightly windy sites (group D).
All these observations are valid for an open area roughness, at the 60 m height and machines of cut-in speed 3 m/s and cut-out speed 25 m/s. They will be reconsidered for different roughnesses, heights and speeds [12-14].
4. Conclusions
This study presents a practical approach of assistance for the wind systems exploitation adapted to the Tunisian sites. After the evaluation of the wind characteristics of the twenty six meteorological sites distributed on the Tunisian territory, we estimated the annual operating time and the wind energy which can provide a wind turbine given on the Tunisian sites. This estimate which was carried out for seven types of machines and a 60 m height above ground level gives a choice of the wind systems best adapted for the Tunisian meteorological sites, by taking into account energy, economic and technical efficiencies of the wind farm.
This estimate could be carried out for other types of machines and several heights above ground level and constitutes a decision-making aid tool to the appropriate choice of wind system.
The results of this work also enable us to avoid the bad wind turbine implantations in Tunisia that can have adverse consequences on the energy production.
REFERENCES
- A. Ouammi, V. Ghigliotti, M. Robba, A. Mimet and R. Sacile, “A Decision Support System for the Optimal Exploitation of Wind Energy on Regional Scale,” Article in Press, Renewable Energy, Vol. 37, No. 1, 2012, pp. 299- 309. doi:10.1016/j.renene.2011.06.027
- K. Xie and R. Billinton, “Energy and Reliability Benefits of Wind Energy Conversion Systems,” Renewable Energy, Vol. 36, No. 7, 2011, pp. 1983-1988. doi:10.1016/j.renene.2010.12.011
- C. Kongnam and S. Nuchprayoon, “A Particle Swarm Optimization for Wind Energy Control Problem,” Renewable Energy, Vol. 35, No. 11, 2010, pp. 2431-2438. doi:10.1016/j.renene.2010.02.020
- I. Jarraya, F. B. Amar, M. Elamouri and R. Dhifaoui, “Choix des Systèmes Eoliens Appropriés Pour les Sites Tunisiens,” International Renewable Energy Congress, 5-7 November 2010, Sousse, pp. 162-168.
- F. Y. Ettoumi, A. H. Adane, M. L. Benzaoui and N. Bouzergui, “Comparative Simulation of Wind Park Design and Sitting in Algeria,” Renewable Energy, Vol. 33, No. 10, 2008, pp. 2333-2338. doi:10.1016/j.renene.2008.01.003
- K. A. Nigima and P. Parkerb, “Heuristic and Probabilistic Wind Power Availability Estimation Procedures: Improved Tools for Technology and Site Selection,” Renewable Energy, Vol. 32, No. 4, 2007, pp. 638-648. doi:10.1016/j.renene.2006.03.001
- A.-H. Marafia and H. A. Ashour, “Economics of OffShore/On-Shore Wind Energy Systems in Qatar,” Renewable Energy, Vol. 28, No. 12, 2003, pp. 1953-1963. doi:10.1016/S0960-1481(03)00060-0
- R. C. Bansal, T. S. Bhatti and D. P. Kothari, “On Some of the Design Aspects of Wind Energy Conversion Systems,” Energy Conversion and Management, Vol. 43, No. 16, 2002, pp. 2175-2187. doi:10.1016/S0196-8904(01)00166-2
- M. Elamouri and F. B. Amar, “Wind Energy Potential in Tunisia,” Renewable Energy, Vol. 33, No. 10, 2008, pp. 758-768. doi:10.1016/j.renene.2007.04.005
- F. B. Amar, M. Elamouri and R. Dhifaoui, “Energy Assessment of the First Wind Farm of Sidi Daoud, Tunisia,” Renewable Energy, Vol. 33, No. 10, 2008, pp. 2311- 2321. doi:10.1016/j.renene.2007.12.019
- M. Elamouri, F. B. Amar and A. Trabelsi. “Vertical Characterization of the Wind Mode and Its Effect on the Wind Farm Profitability of Sidi Daoud, Tunisia,” Energy Conversion and Management, Vol. 52, No. 2, 2011, pp. 1539-1549. doi:10.1016/j.enconman.2010.10.014
- S. Yahaya, “Dynamique de la Couche Limite de Surface Semi Aride: Approche des Caractéristiques Turbulentes par Anémométrie à Coupelles et Effet des Traitements du Surface du sol,” Thesis, Paris University, Paris, 2004.
- B. Lange, S. Larsen, J. Hόjstrup and R. Barthelmie, “Importance of Thermal Effects and Sea Surface Roughness for Offshore Wind Resource Assessment,” Journal of Wind Engineering and Industrial Aerodynamics, Vol. 92, No. 11, 2004, pp. 59-88.
- B. Henderson-Sellers, “Plume Rise Modelling: The Effects of including a Wind Shear and a Variable Surface Roughness,” Ecological Modelling, Vol. 37, No. 3-4, 1987, pp. 269-286.
- N. K. Merzouk, M. Merzouk and B. Benyoucef, “Pofil Vertical de la Vitesse du Vent Dans la Basse Couche Limite Atmosphérique,” Journées Internationales de Thermique, 28-30 August 2007, Albi, pp. 1-5.
- T. J. Chang, Y. T. Wu, H. Hsu, C. Chu and C. Liao, “Assessment of Wind Characteristics and Wind Turbine Characteristics in Taiwan,” Renewable Energy, Vol. 28, No. 6, 2003, pp. 851-871. doi:10.1016/S0960-1481(02)00184-2
- M. H. Abderrazzaq, “Energy Production Assessment of Small Wind Farms,” Renewable Energy, Vol. 29, No. 15, 2004, pp. 2261-2272. doi:10.1016/j.renene.2004.04.003
- A. E. Kavak and S. Akpinar, “An Assessment on Seasonal Analysis of Wind Energy Characteristics and Wind Turbine Characteristics,” Energy Conversion and Management, Vol. 46, No. 11-12, 2005, pp. 1848-1867.
- W. C. Cliff, “The Effect of Generalized Wind Characteristics on Annual Power Estimates from Wind Turbine Generators,” Report PNL-2436, US Department of Energy, October 1977.
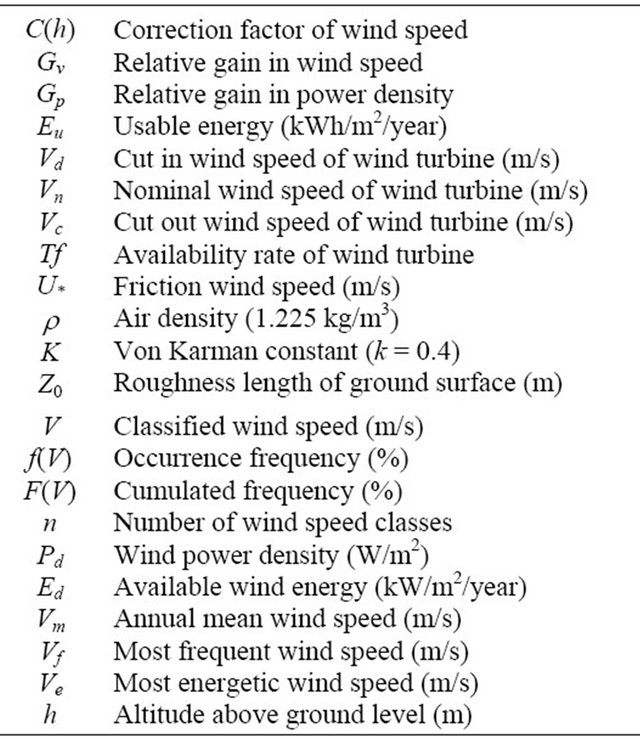
Nomenclature