Atmospheric and Climate Sciences
Vol.3 No.4(2013), Article ID:36804,11 pages DOI:10.4236/acs.2013.34051
Chemical Composition and Sources of Rainwater Collected at a Semi-Rural Site in Ya’an, Southwestern China
1Provincial Key Laboratory of Agricultural Environmental Engineering, College of Resources and Environment, Sichuan Agricultural University, Chengdu, China
2Meishan Environmental Monitoring Center, Meishan, China
Email: *lili@sicau.edu.cn, *dengshihuai@163.com
Copyright © 2013 Min Zhao et al. This is an open access article distributed under the Creative Commons Attribution License, which permits unrestricted use, distribution, and reproduction in any medium, provided the original work is properly cited.
Received August 3, 2013; revised August 28, 2013; accepted September 3, 2013
Keywords: Acid Rain; Chemical Composition; Ammonia; Source Apportionment; Ya’an
ABSTRACT
Rain and snow water samples were collected from Sep. 2010 to Jun. 2011 at a semi-rural site in Ya’an, a city located in the rain-belt along the Tibetan Plateau, to characterize the chemical composition and the sources of precipitation. The collected samples were severely acidified with an annual volume-weighted mean (VWM) pH of 4.03 and an annual acid rain frequency of 79%.  and
and  were the most abundant ions, followed by Ca2+, H+,
  , Cl−, K+, Na+, F− and Mg2+. The acidity of samples was predominantly generated by H2SO4 and HNO3, which were neutralized by
  and Ca2+ as much as 65%. NH3 played a major role in neutralizing the acid rain. The average ambient concentration of NH3 was 174.2 μg/m3 during sampling periods. Different source apportionment methods, including principle component analysis (PCA), enrichment factor (EF), correlation and back-trajectory analysis were used to track the sources of rainwater. The methods suggested that the pollutants in rainwater were from both local and long-distance transport (1:2.2), or they were from anthropogenic actions (86.4%), sea salts (8.1%) and crustal (5.5%) respectively.
1. Introduction
Acid rain has received worldwide attention during the past decades for its notably negative effects on aquatic and terrestrial ecosystems. Specifically, acid rain acidifies surface waters and soils, leads to widespread loss of fish population, forest decay and crop yield decline, and accelerates rust process of wild architectures [1,2]. Acid rain can also bring direct and indirect harm to human health. The main risk components are acidity and heavy metal elements [3].
In the past decades, many studies were conducted on acid rains in south China [4-6]. South China has been regarded as the third largest acid region in the world following Northeast America and Central Europe [4,7]. In these previous studies, major attentions were paid to urban areas because more anthropogenic pollutants, i.e. SO2 and NOx, are emitted in the industrialized sites. Although the negative effects of acid rain on rural areas, such as on forests, farmlands and water bodies, are as important as on urban areas, and acid rains in rural areas are usually obvious and caused by a significant influence of long range transport air pollutants [8], the knowledge of acid rains in extensive non-urban areas is still limited.
Ya’an is a famous rainy city located on the rain-belt along the Tibetan Plateau in the southwestern China. In Ya’an, about half of the days in a whole year are rainy. Ya’an is dominated by light rains and the annual average precipitation amount is around 1800 mm. Two reasons make us study the chemical composition and the sources of rainwater at a semi-rural site in Ya’an. By the first reason, Ya’an has abundant rains and it is close to the Tibetan Plateau (see in Figure 1(A)). Due to these unique topographic and climatic conditions, a large amount of pollutants in the long-distance transport air masses in Ya’an are obstructed by high mountains, washed out by rains and deposited in this area. These pollutants, represented by a majority of regional pollutions, can be used to track the origins of air pollutants in the research area. By the second reason, we are in shortage of a study associated with acid rains at rural-urban transit site on the rain-belt along the Tibetan Plateau. As far as we know, the transit regions are usually heavily influenced
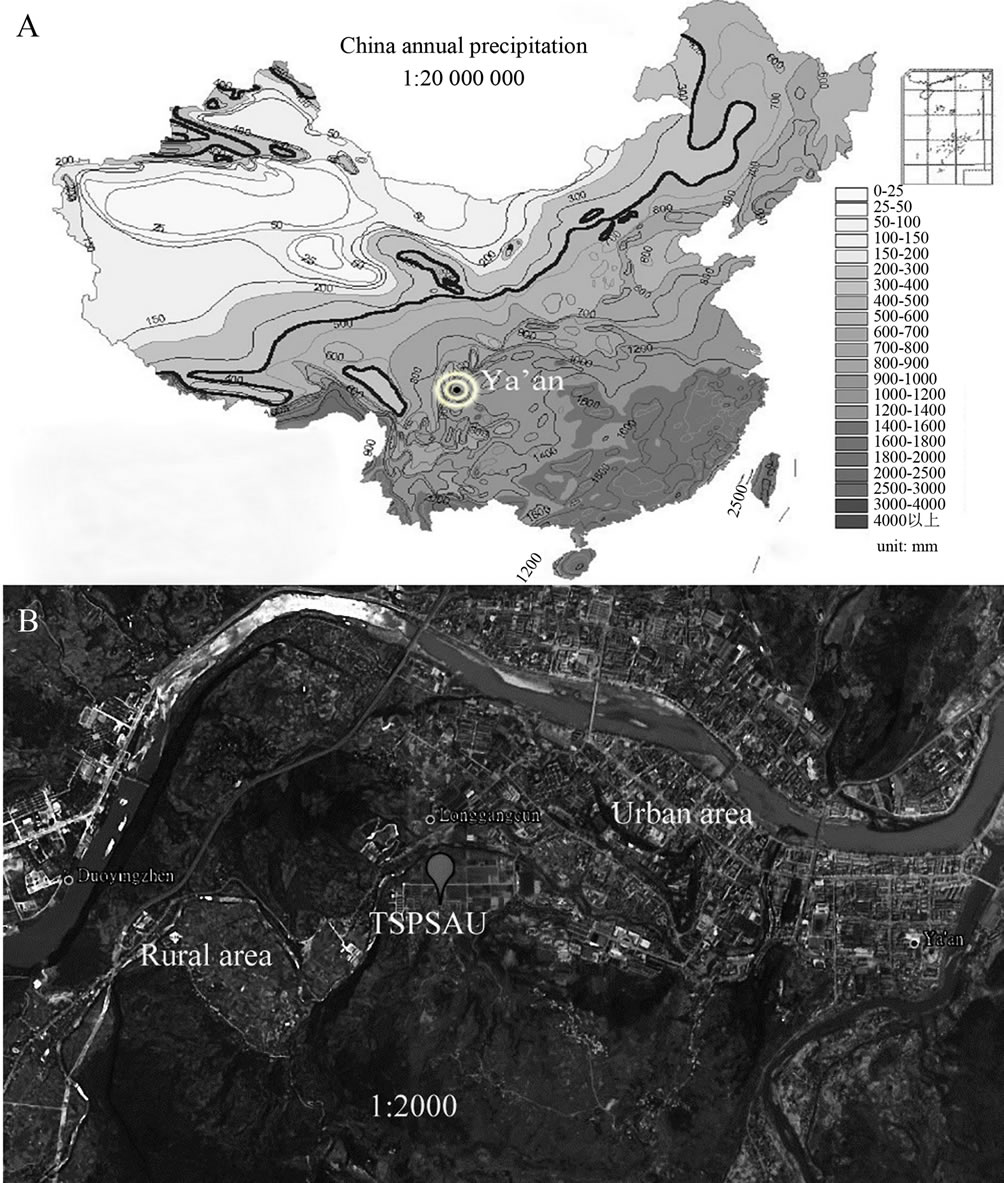
Figure 1. Locations of Ya’an and the sampling site (TSPSAU).
by anthropogenic actions, and in the regions environmental pollution has obvious impacts on extensive ecological lands.
Rain is an effective way to remove particulates and dissolved gases in the atmosphere [9]. The chemical compositions and pH values of rainwater are affected by the scavenging of atmospheric pollutants. These pollutants can be of many origins, for example, SO2 and NOx emitted from fuel burning and vehicles transforming into  and
and  through photochemical reactions and being washed out by rains; NH3 coming from agricultural sources, such as livestock breeding, fertilizer, soil emission and biomass burning [10], and undergoing gas-toparticle conversion processes to give rise to
 . Ca2+ mainly originates from daytime convection and vehicle/wind-driven roadside dust [11]. Other ions (e.g. Cl−, Na+, Mg2+ and K+) are primarily from natural sources such as soils, forest fires, and sea salts [12]. The acidity of rainwater is a result of the balance between acidic ions and alkaline ones upon their neutralization reactions [13]. To better understand the formation mechanism of the severe acidity of rainwater, it’s necessary to gain a deep insight into the chemical compositions of precipitation.
The objectives of the present study are: 1) to analyze chemical compositions and characterize seasonal variation of precipitation at a semi-rural site in Ya’an; 2) to discuss the formation mechanism of the acidity of the rainwater; and 3) to investigate the possible pollution sources as well as their relative contributions to the rains at the research site.
2. Materials and Methods
2.1. Site Description
The sampling site is situated on the roof of a two-story building (29˚58'58" N, 102˚58'44" E) about 7 m tall in Teaching and Scientific Park of Sichuan Agricultural University (TSPSAU). The total area of TSPSAU is 33.3 ha. It comprises a dozen of laboratory buildings, a livestock farm (a small number of animals are experimentally fed in this farm), a small wastewater treatment plant and a large area of experimental fields. The sampling site is kept at least 100 m from possible emission source, and no high obstruction stands nearby.
Figure 1 presents the geographic locations of TSPSAU and Ya’an. As we can see from Figure 1, the campus of Sichuan Agricultural University, which belongs to urban area, is located in the east of TSPSAU. At the same time, the extensive farmland, a typical rural area, is located in the west of TSPSAU. The collection site is a good representative of transit place between urban and rural area.
2.2. Sampling Method
Rainwater samples of four different seasons were collected in 17-28 Sep. 2010 (autumn), 31 Dec. 2010-14 Jan. 2011 (winter), 1-18 Apr. 2011(spring) and 3-16 Jun. 2011 (summer) respectively. All the samples were manually collected using polystyrene funnels on the event basis 1.5 m above the roof. The funnels were also used as rain gauges to record the precipitation amount. Samples collected from 20:00 on the first day to 20:00 of the next day were mixed as one sample. Before collections, the funnels were cleaned with 6 M hydrochloric acid solution and rinsed several times by Milli-Q water (resistivity: 18.2 MΩ/cm). In order to prevent contaminations from dry deposition, the funnels were opened and covered as quickly as possible at the beginning and the end of each rain event. Meteorological parameters (i.e. temperature, relative humidity and wind speed) were measured by a pocket weather meter (4500, Kestrel, USA) three times at 08:00, 14:00 and 20:00 every day. In total, 25 rainwater and 3 snow water samples were collected.
2.3. Chemical Analysis
At the end of each rainfall episode, rainwater was taken back to laboratory immediately. The pH values and conductivities for the rainwater samples were analyzed with a pH meter (pHS-3C+, Fangzhou, China) and a highprecision conductivity meter (DDS-12W, Lida, China) respectively. Subsequently, the samples were filtered through 0.45 µm hydrophilic microporous membrane equipped with a clean syringe. All water filtrates were preserved at 4˚C in a refrigerator until for analysis.
Anions (i.e., F−, Cl−,  and
and ) were measured by ion chromatography (ICS-90, Dionex, USA) equipped with a conductivity detector. Anions were separated on AS11-HC column using 25 mmol/L KOH (EGC II, Dionex) as eluent kept at a flow rate of 1.0 mL/min. Moreover, K+ and Na+ were measured by a flame photometer (6400 A, Shanghai Analy. Instru. Co., China), Ca2+ and Mg2+ were measured by a flame atomic absorption spectrometry (MKⅡM6, Thermo, USA), and
  was measured by a flow injection analytical instrument (FIAstar 5000, Foss, Sweden).
Accompanied with the acid rain monitoring, NH3 in the real-time atmosphere was also collected by a multifunctional sampler (6120, Laoshan elec. Co., China) using 0.005 M sulfuric acid as absorbent solution. The concentrations of NH3 in the absorbent solutions were analyzed colorimetrically by a visible-light-spectrophotometer. Blank samples were prepared as the same as field samples only no flow rate. More detailed description of the measurement procedure please referred to Li et al. 2013 [14].
2.4. QA/QC
The sampling and analytical procedures for rainwater were performed according to the technical specifications established by Chinese Environmental Protection Administration (HJ/T165-2004 [15]). The detection limits (S/N = 3) were 0.056, 0.042, 0.015, 0.046, 0.033, 0.036, 0.056, 0.061 and 0.028 mg/L for F−, Cl−,  ,
,  , K+, Na+, Mg2+, Ca2+ and
 , respectively. The relative standard deviations (RSD) for the ionic analysis were better than 5%. Field blanks were taken by pouring ultra-pure water into funnels, and the background values were subtracted from the concentrations of field samples.
Moreover, the data quality for rainwater samples was checked by ionic balance. Data acquired in this study (more than 90%) is within the acceptable range of ion difference given by Rastogi et al. 2005 [16], 15% - 30% between cations and anions for rainwater samples with ionic sum higher than 100 μeq/L. The linear regression between ∑anions and ∑cations is fairly good (see in Figure 2(A), R2 = 0.91).
3. Results and Discussion
3.1. pH Value and Conductivity
Table 1 lists the chemical compositions of the rainwater collected during sampling periods. The frequency distribution of the pH values of the rainwater is presented
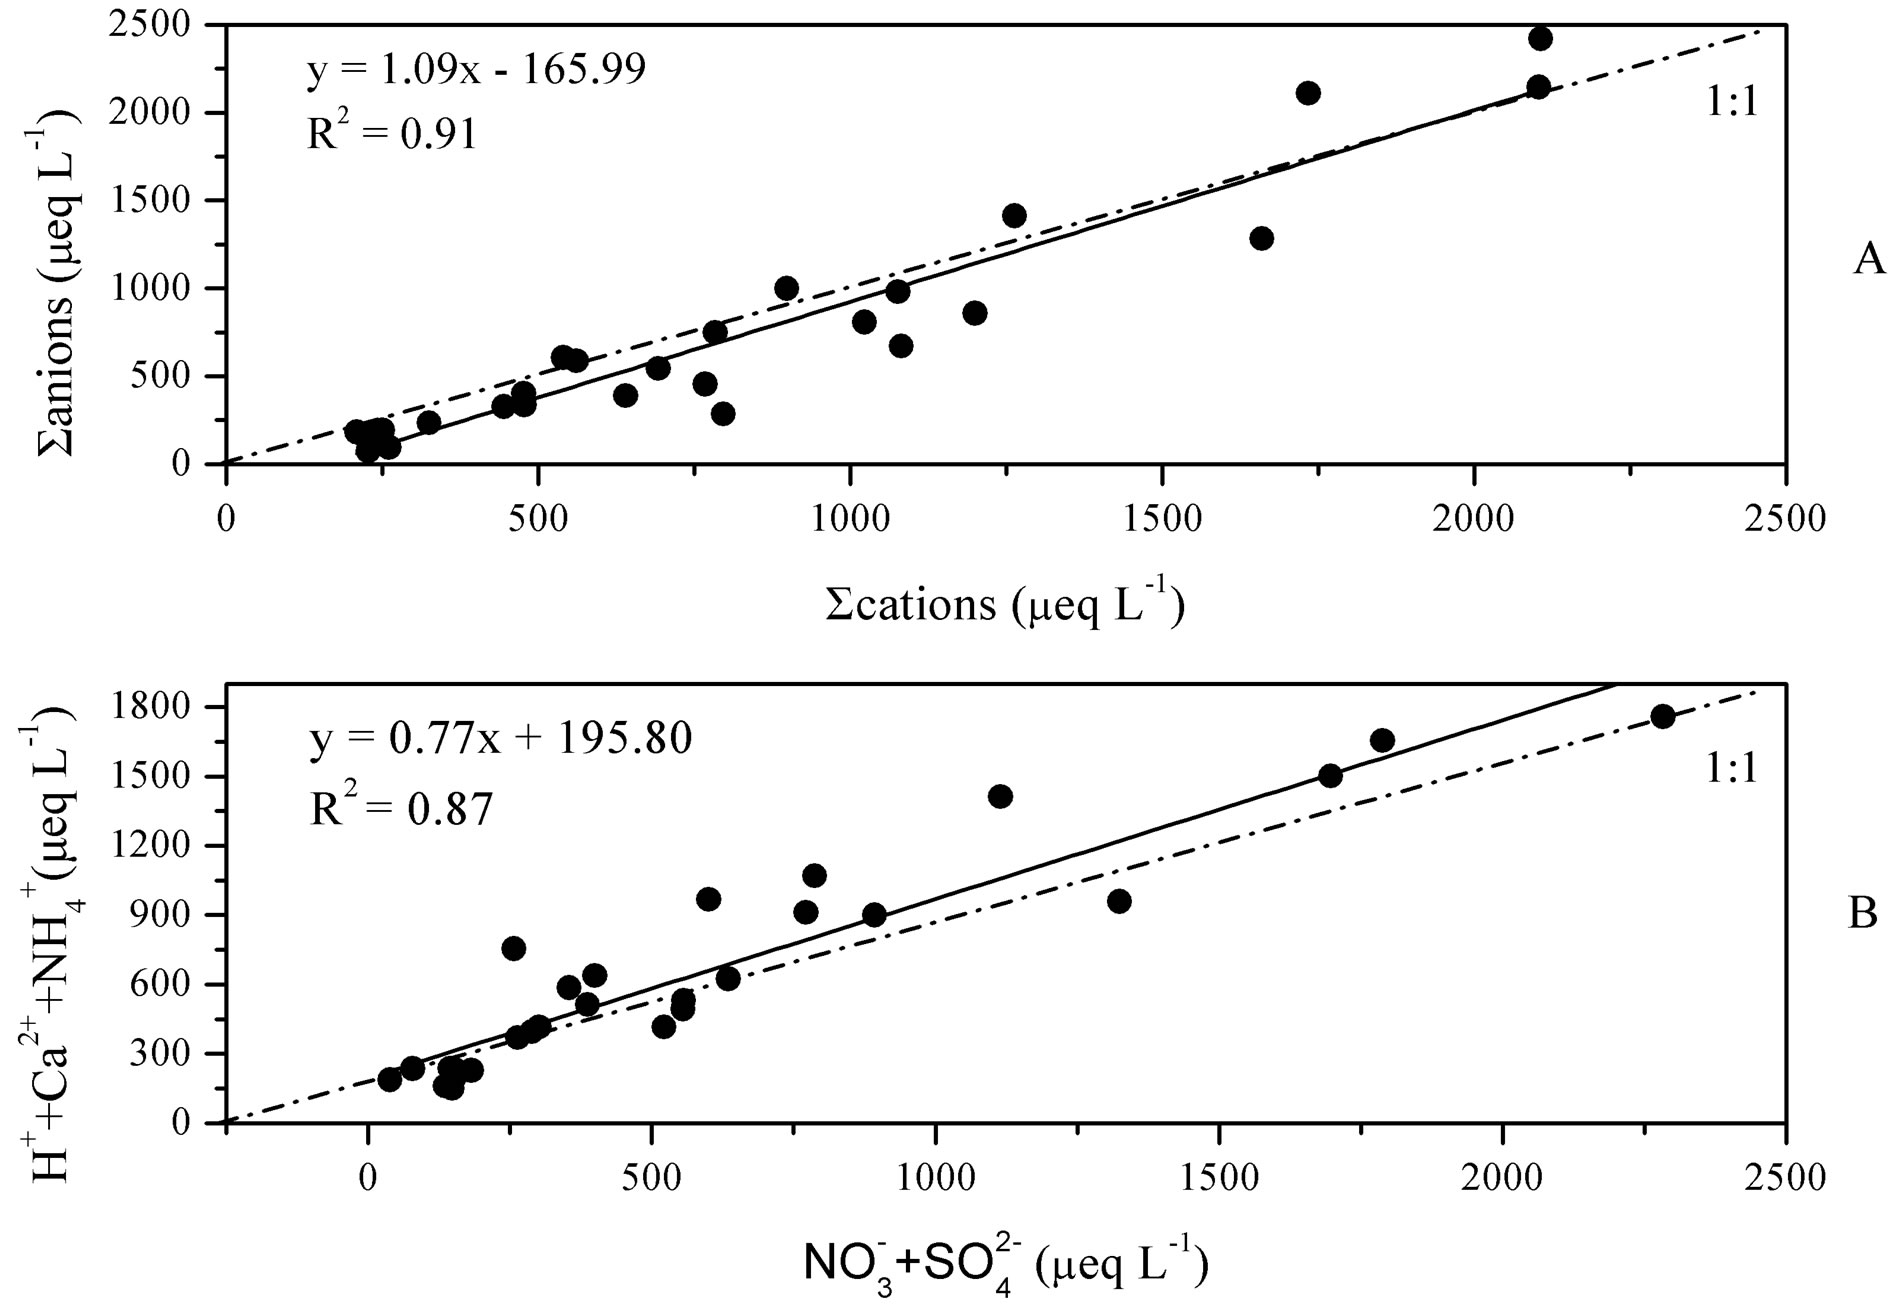
Figure 2. Linear regressions between ∑cations and ∑anions (A) and between summed concentrations of H+ + Ca2+ +  and
and  +
+  (B).
(B).
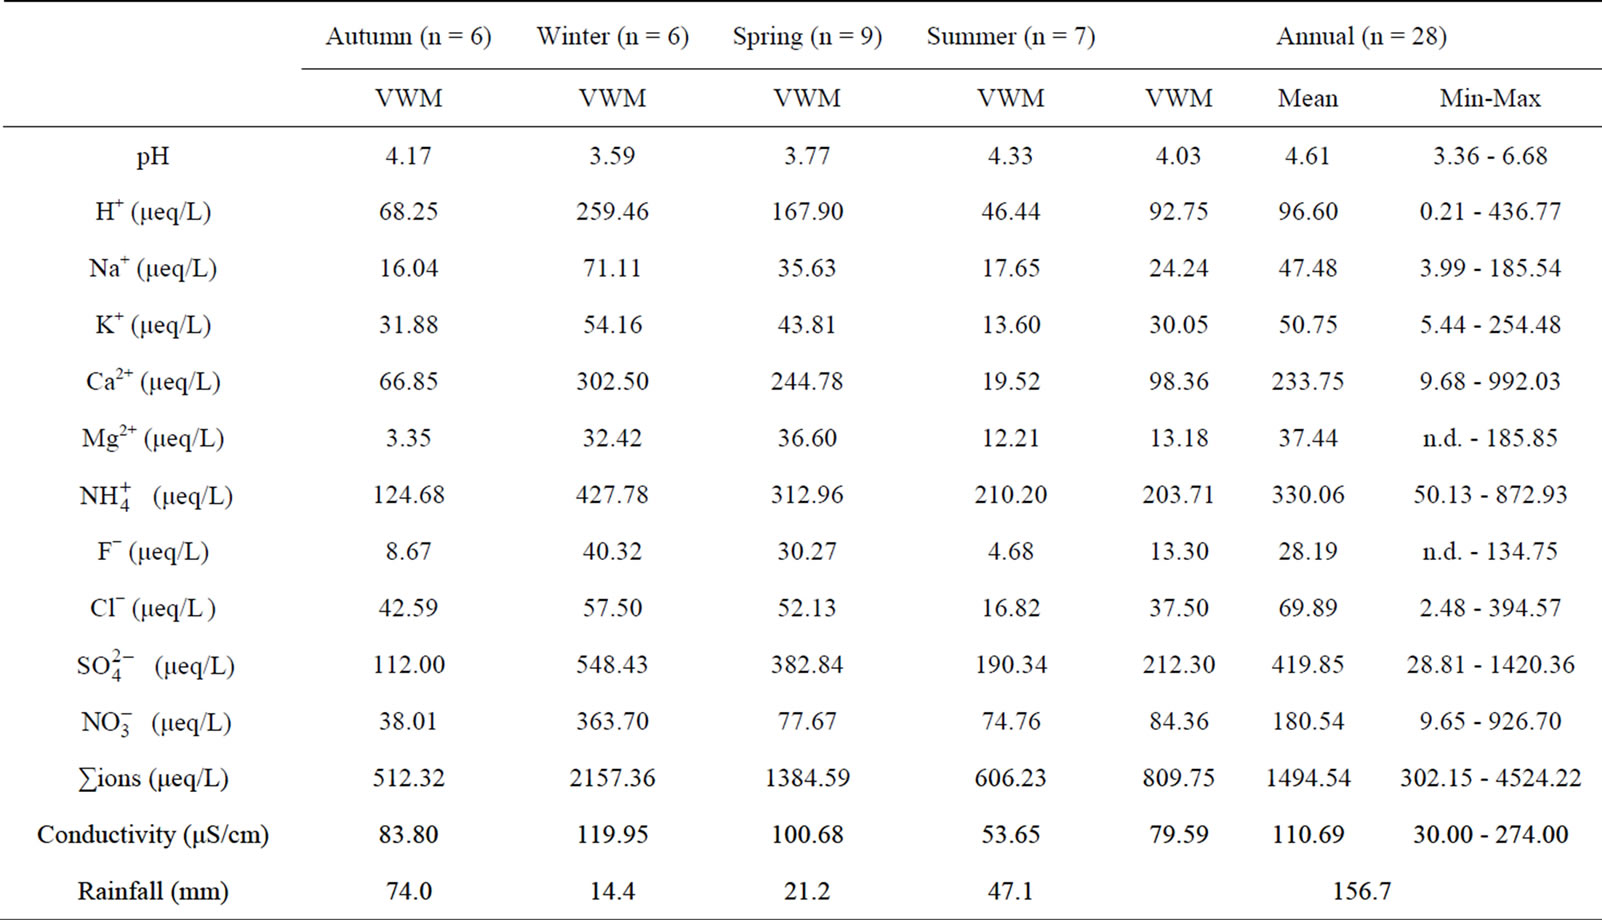
Table 1. Chemical composition of rainwater collected at TSPSAU.
in Figure 3. From Table 1 and Figure 3, it can be seen that the pH values for the individual precipitation are varied from 3.36 to 6.68, with an annual VWM (volumeweight mean) of 4.03. Up to 68% of the pH values were in the range of 3.0 - 4.5, indicating a severe acidification of the rainwater at TSPSAU. On the other hand, 21% samples had the pH values above 5.60, which is the pH value of unpolluted water equilibrated with atmospheric CO2. Compared with the VWM pH values measured for other areas in China, 5.12 (Beijing [17]); 4.49 (Shanghai [5]); 4.49 (Guangzhou [6]); 4.54 (Jinhua, Zhejiang Province [4]); 4.10 - 4.13 (Tie Shan Ping, Chongqing [8]); 4.44 (Lei Gong Shan, Kaili, Guizhou Province [8]); and for the overseas areas, 4.52 (Tokyo [18]); 4.60 (Newark, New Jersey, USA [19]); 5.20 (São Paulo, Brazil [20]); 6.0 (Kampangsan, Thailand [21]), the VWM pH value for TSPSAU was low. The VMW pH value of the rainwater collected at TSPSAU are even obviously lower than that of Chengdu [22] (5.1, Jan.-Dec., 2008), which is located about 150 km to the northeast of Ya’an. The lacking of alkaline substances like Ca2+ in rainwater and the significant anthropogenic influences in the semi-rural atmosphere may be the main causes for the severe acidification of the rainwater collected at TSPSAU.
Electrical conductivity (EC) of rainwater collected at TSPSAU was ranged from 30.00 to 274.00 µS/cm, with a VWM value of 79.59 µS/cm. EC can be looked as a good indicator for the total concentrations of soluble ions. The
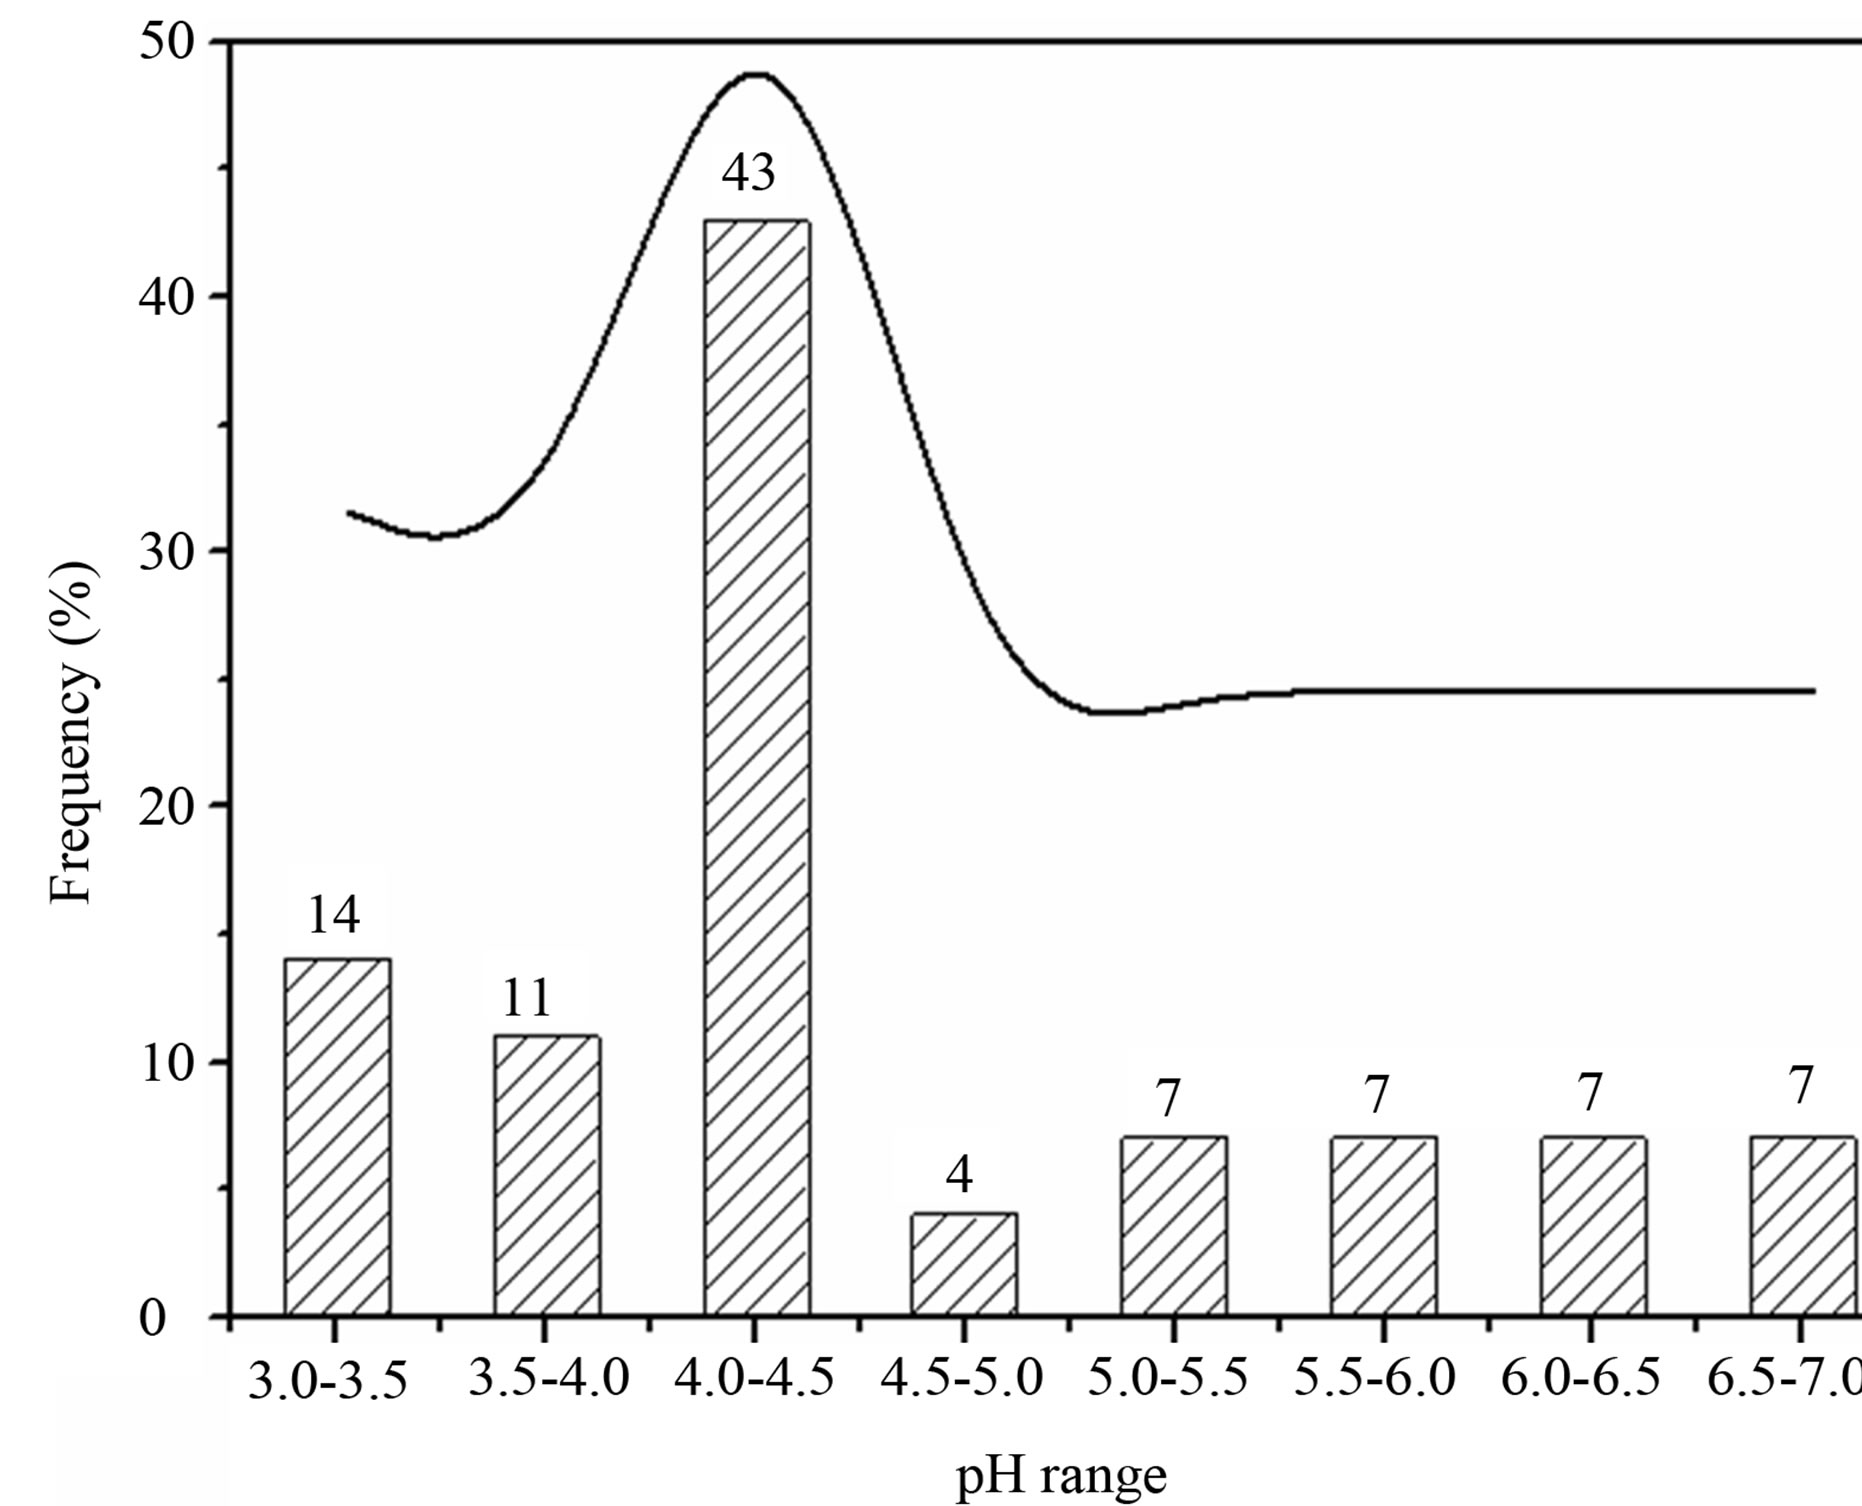
Figure 3. Frequency distribution of pH values for rainwater samples collected at TSPSAU.
VWM conductivity of rainwater collected at TSPSAU was obviously higher than those of coastal sites in the southeastern China, such as Jinhua [4] (20.3 µS/cm) and Shenzhen [23] (25.52 µS/cm), however, comparable to that of Beijing [17] (76.88 µS/cm), and lower than those of inland arid areas, such as Urumqi [24] (91.04 µS/cm) and Jordan [25] (95.00 µS/cm).
3.2. Ionic Composition
Average concentration and standard deviation of ∑ions for rainwater collected at TSPSAU were 1494.54 ± 1193.17 µeq/L, with a VWM value of 809.75 µeq/L during one whole year (see in Table 1). Major ions show a general trend:  >
>  > Ca2+ > H+ >
  > Cl− > K+ > Na+ > F− > Mg2+ in the VWM concentrations.
 , as the dominant anion with the highest level among all ionic species of a VWM of 212.30 µeq/L, accounted for 26.2% of the total ionic concentrations (see in Figure 4" target="_self"> Figure 4). It suggests that acid rain at the research site is of sulfuric-acid type caused mainly by the input of sulfuric acid from anthropogenic sources.
Moreover,  was the predominant cation with a VWM of 203.71 µeq/L during sampling period. The formation of
  is tightly connected with gas-toparticle conversion of NH3 in atmosphere. Table 2 presents the ambient concentrations of NH3 monitored during sampling periods. The average concentration of NH3 was 174.2 μg/m3 at TSPSAU. Biswas et al. 2008 [26] reported that the average ambient concentrations of NH3 ranged from 21.2 to 81.3 μg/m3 with a mean of 50.1 μg/m3 in Lahore, a large city of Pakistan, during 23 Dec. 2005 to 14 Feb. 2006. The high levels of atmospheric NH3 in Ya’an were comparable to Lahore. It suggests that NH3 in the areas around the Tibetan Plateau is often very abundant in the lower troposphere.
As a major crustal element, Ca2+ is come from calcareous soils and dusts driven by winds and anthropogenic construction actions, and it accounted for 12.15% of ∑ions of rainwater. H+ accounted for 11.45% of the total ionic concentration, showing an obvious lack of alkaline ions and a severe acidification of rainwater at the research site (see in Figure 4).
3.3. Seasonal Variation
Figure 5 shows the temporal trends of water soluble ions in rainwater samples collected during one-year long term observation. From Figure 5, it can be seen that the major ions in the autumn rainwater include ,
,  , Cl−,
  , Ca2+, K+ and H+. The concentrations of Cl− and K+ were correspondingly higher than those of
  and
and  on 27 Sep. 2010, suggesting an obvious influence from biomass burning. Moreover, the dominating ions in the winter and spring samples were
 ,
,  , Ca2+ and
 . The concentrations of Ca2+, an indicator element of soil dust, were higher in the winter and spring than in the summer and autumn, indicating soil dust is heavier in the former seasons than in the latter. Furthermore, the important ions in the summer rainwater were
 ,
,  and
and , implying a strong photooxidation processing during this time. All rainwater chemical species showed the highest concentrations in winter compared to the other three seasons possibly due to the short rainfall amount in this season only except for Mg2+ (see in Table 1).
3.4. Correlation Analysis
Table 3 presents a Pearson correlation analysis result for
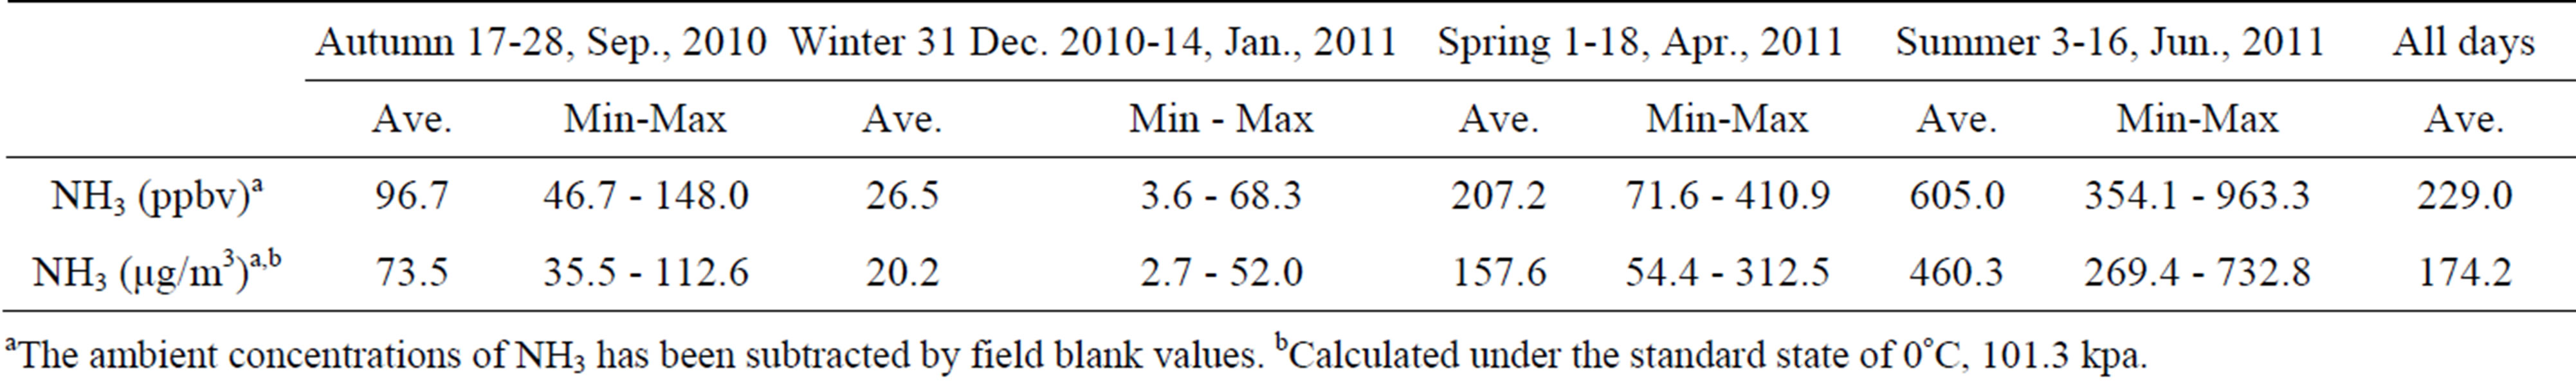
Table 2. Ambient concentrations of NH3 monitored at TSPSAU (24 hr intervals).
aThe ambient concentrations of NH3 has been subtracted by field blank values. bCalculated under the standard state of 0˚C, 101.3 kpa.
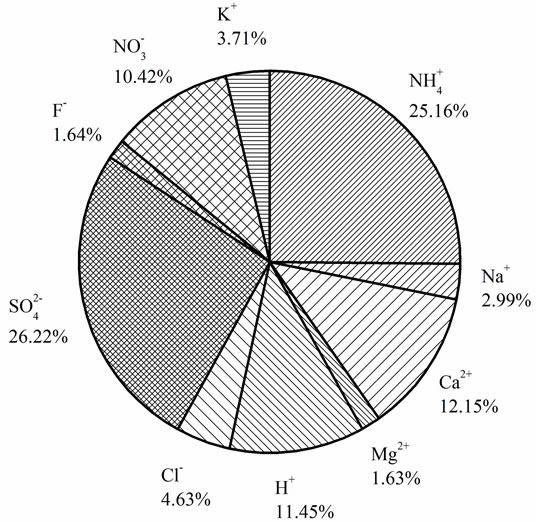
Figure 4. % contribution of different ion species to ∑ions for rainwater samples collected in Ya’an (based on VWM values).
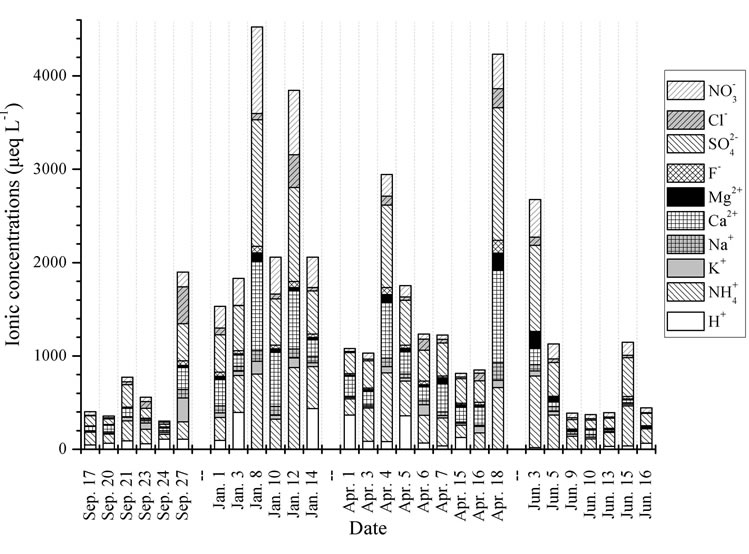
Figure 5. Temporal trends of ionic concentrations for the rainwater samples.
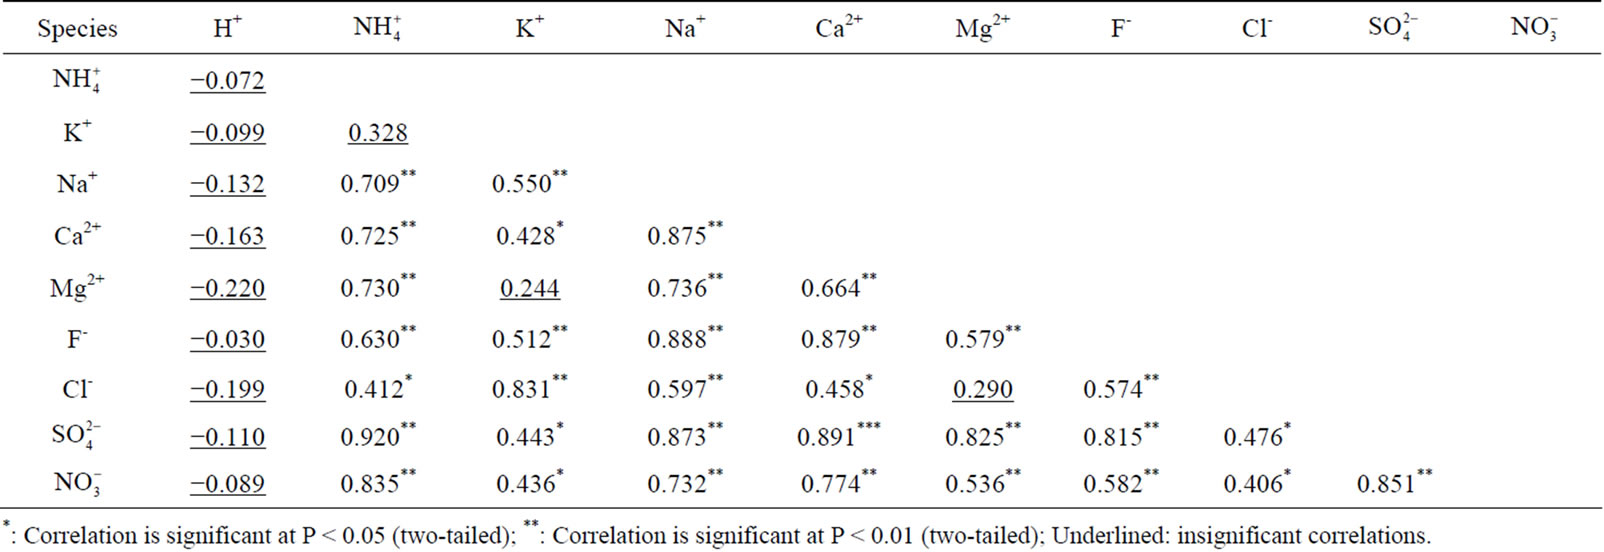
Table 3. Pearson correlation matrix for the ionic species measured in rainwater.
*: Correlation is significant at P < 0.05 (two-tailed); **: Correlation is significant at P < 0.01 (two-tailed); Underlined: insignificant correlations.
the major ions of the rainwater samples, which was performed using SPSS 19.0. From Table 3, it can be seen that the correlations between the major ions are all very good, with the exception of the correlations between K+ and Mg2+, Cl− and Mg2+, and  and K+. The highly significant correlation of K+ and Cl− (R2 = 0.831) implied a common origin of them (i.e. biomass burning) and possible combining form of KCl.
 ,
,  and
and  showed good relationships between each other (p < 0.01), suggesting that they came from one anthropogenic source and shared a common photochemical formation process as of (NH4)2SO4 and NH4NO3 in the ambient atmosphere. Moreover, good correlations between the acidic ions (
 ,
, and F−) and the cations (Ca2+, Mg2+ and Na+) demonstrated that the existence of combining substances, CaSO4, MgSO4, Na2SO4, NaNO3, etc., which were formed via neutralization reactions under atmospheric deposition processes.
3.5. Acid neutralization Indicators
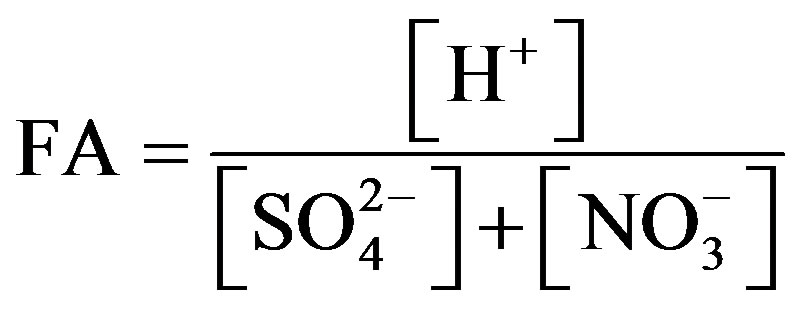
Fractional acidity (FA) is an indicator often used to measure acid neutralization capacity of rainwater. FA is expressed in the following form:
 (1)
(1)
The FA values at TSPSAU were varied from 0.0002 to 2.85, with an average of 0.35, indicating that about 65% of the acidity was neutralized by alkaline constituents. This result was higher than that of Jinhua [4] (0.24), of Guangzhou [27] (0.15), and of Pune [28] (0.013), but lower than that of Newark, New Jersey, USA [19] (0.47) and of Singapore [29] (0.64). FA values were in the middle level in Ya’an when compared to other locations all over the world.
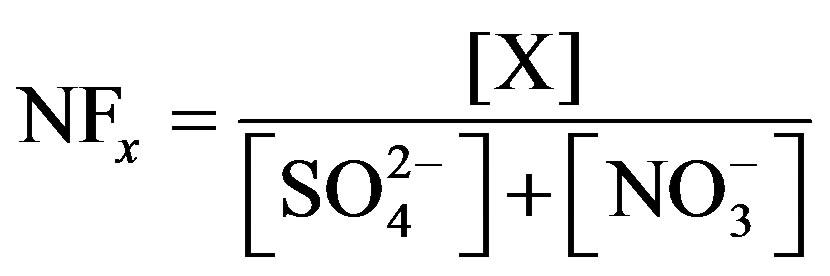
Similarly, the neutralization ability of different ions in rainwater can be estimated by neutralization factors (NF). NF is expressed as in Equation (2):
 (2)
(2)
where, X denotes the equivalent concentrations of alkaline components in rainwater. Average NF values for , Ca2+, Mg2+, K+ and Na+ were 0.71, 0.40, 0.05, 0.13 and 0.10 at TSPSAU, respectively.
  was the more important neutralization substance than Ca2+ in this study. It is different from many studies on other areas around the world (e.g. Shanghai [5]; Guangzhou [6]; Pune, India [28]), in those areas, the most important neutralization substance is Ca2+. It is agreement with the facts that the obvious NH3 emission and a small amount of soil dust in the air of Ya’an in continuous rainy and humid climate.
A good linear regression between the concentrations of the main anions ([ ] + [
] + [ ]) and the main cations ([H+] + [Ca2+] + [
 ]) is shown in Figure 2(B) (R2 = 0.873). It can be inferred that the acidity of rainwater was primarily affected by
 ,
, ,
,  and Ca2+. In order to assess the balance between acidity and alkalinity of rainwater, ratios between the neutralizing potential (NP) and the acidifying potential (AP) is evaluated in the following Equation (3):
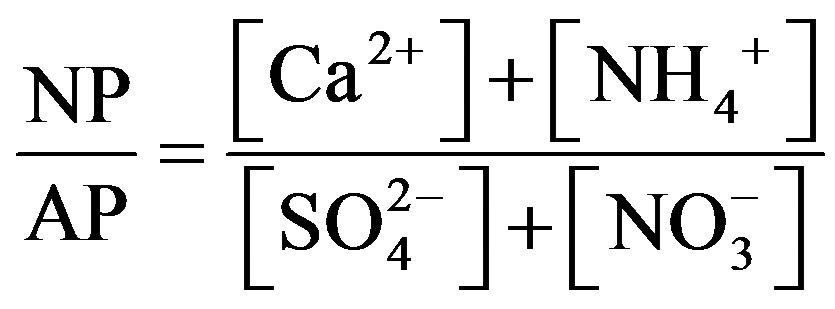 (3)
(3)
The NP/AP values were varied from 0.67 to 2.15 with an average of 1.10 in this study. It was close to the values reported for Beijing [30] (1.2) and Shenzhen [23] (1.24). The high NP/AP value indicates strong neutralization effects, alkaline inorganic ions offsetting the acidity caused by high loadings of H2SO4 and HNO3 in rainwater. It is worthy noting that the average pH value of rainwater collected at TSPSAU (VWM pH values: 4.03) is much lower than that of Beijing [30] (6.0), despite the fact that the NP/AP values for the two different sites are similar. The fact is tentatively explained by that the dominant cations in Beijing and Ya’an are different: Ca2+ is the dominant cation in Beijing while  in Ya’an. Acidity of rainwater is largely determined by the neutralization reactions between
  and
and  /
/ . The pH values of rainwater comprising mainly calcium salts are higher than those of rainwater comprising mainly ammonium salts due to that calcium hydroxide is a stronger base than NH3.
3.6. Source Analysis
3.6.1. Trajectory Analysis
To explore the origins of pollutants in rainwater, 48-h air mass backward trajectories were computed for each rain event using NOAA HYSPLIT4 Model and Reanalysis meteorological data from 1500 meter above ground level at the starting point. Based on the acquired backward trajectories, the air masses in the rainy days in this campaign can be divided into 3 clusters (see in Figure 6).
Air masses in Cluster 1 (SW) contributed 87.5% of the total rainfall during one-year observation. This cluster of air masses, originated from Tibet, Yunnan in China, and Burma and the Bay of Bengal, accounted for 71.9% of ∑ions during sampling periods (see in Table 4). Air masses in Cluster 2 (NW), accounting for 8.4% of the rainfall, were transferred from Qinghai, Gansu and Xinjiang. This cluster of air masses, characterized by very high loadings of ionic species, was severely polluted due to low rainfall amount and heavy anthropogenic emission
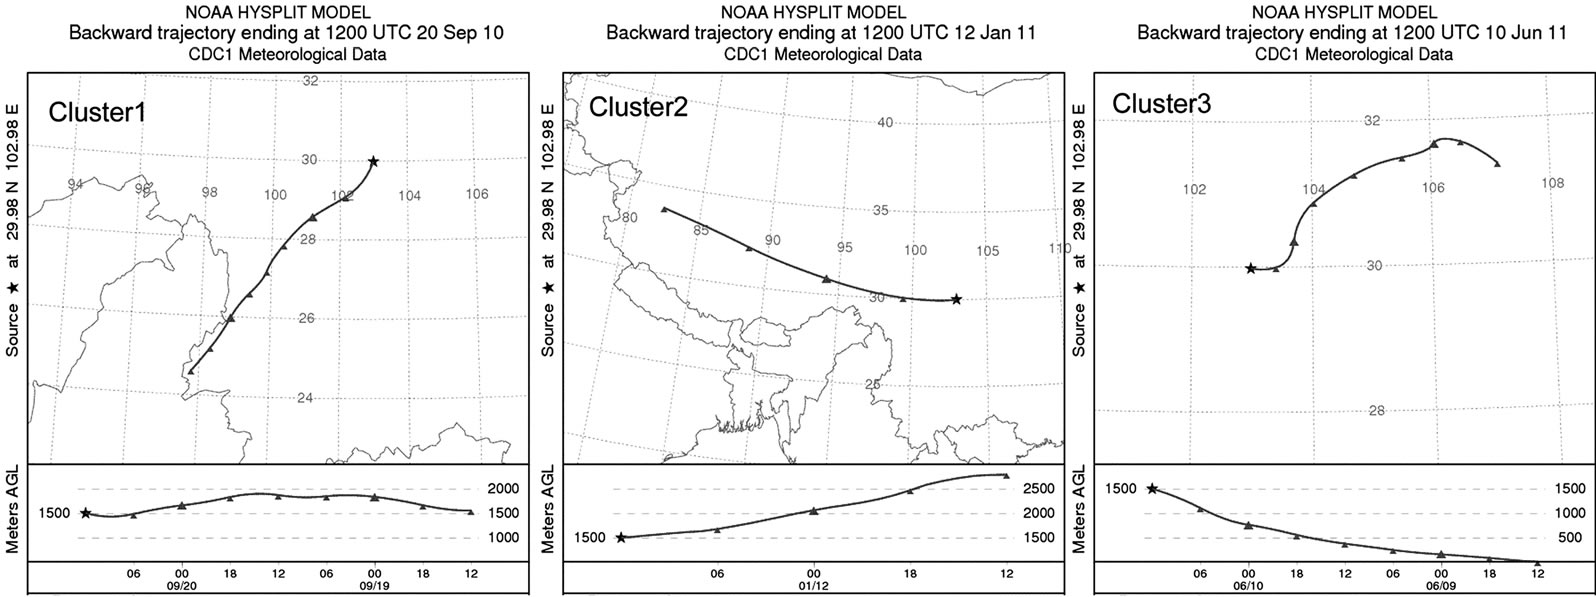
Figure 6. Representative wind directions drawn by HYSPLIT Trajectory Model.
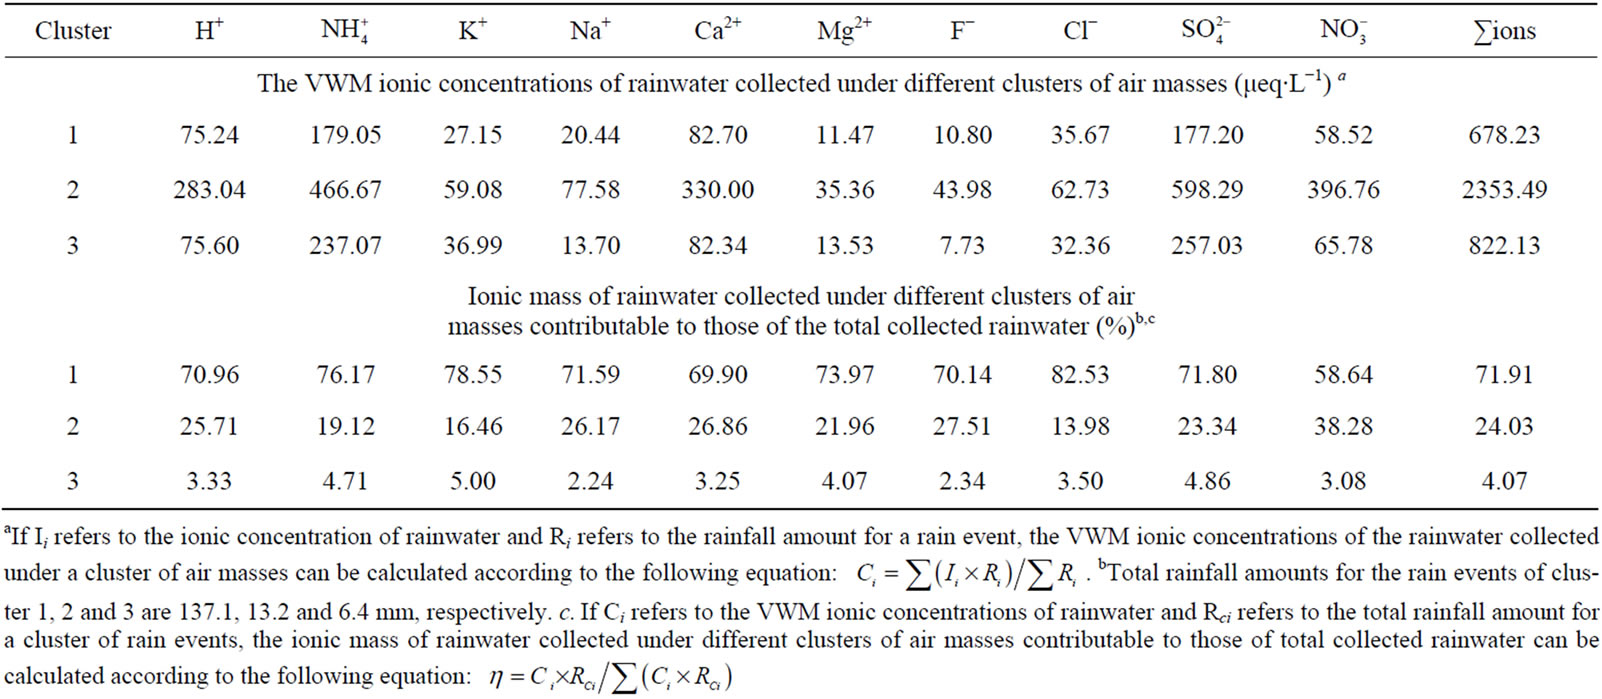
Table 4. The VWM ionic concentrations of rainwater collected under different clusters of air masses and the ionic mass of rainwater collected under different clusters of air masses contributable to those of the total collected rainwater (based on back trajectory analysis).
aIf Ii refers to the ionic concentration of rainwater and Ri refers to the rainfall amount for a rain event, the VWM ionic concentrations of the rainwater collected under a cluster of air masses can be calculated according to the following equation: . bTotal rainfall amounts for the rain events of cluster 1, 2 and 3 are 137.1, 13.2 and 6.4 mm, respectively. c. If Ci refers to the VWM ionic concentrations of rainwater and Rci refers to the total rainfall amount for a cluster of rain events, the ionic mass of rainwater collected under different clusters of air masses contributable to those of total collected rainwater can be calculated according to the following equation:
along the passing areas in wintertime. Air masses in Cluster 2 accounted for 24.0% of ∑ions during sampling periods. Moreover, air masses in Cluster 3 (NE-E-SE) contributing 4.1% of the total sampled rainfall, was primarily from a series of central cities in Sichuan basin, such as Chongqing, Chengdu, Leshan, Yibin and Dazhou. Air masses in Cluster 3 accounted for 4.1% of total ions. Air masses in Cluster 3 were slightly heavier polluted than those of cluster 1. It is agreement with the fact that there are denser population and more obvious anthropogenic influences in Sichuan Basin along path 3 than 1.
3.6.2. Principal Component Analysis
A varimax rotated principal component analysis was conducted using SPSS 19.0 to reveal the association among the major ions and further identify the source apportionment of chemical species measured in rainwater (the result is shown in Table 5" target="_self"> Table 5). Three factors with high eigenvalues more than 1 were extracted, which accounted in total for 86.0% of the variance. The first factor (PC1) explains 52.3% of the total variance, characterized by high loading of , K+, Na+, Ca2+, Mg2+, F−, Cl−,
  and
and . It demonstrates a well mixed source influenced by crustal, anthropogenic and marine origins, possibly transported over a long distance. The second factor (PC2) is shown by high loading of K+ and Cl−, accounting for 23.1% of the total variance and implying a local biomass burning source. The third factor (PC3) is highly loaded by H+ with a variation of 10.5%.
PC3 is explained to be closely related to the neutralization process of the acidity of rains, which is affected by the NH3 emission and the gas-to-particle conversion of NH3 obviously.
3.6.3. Enrichment Factor Analysis
Enrichment factors (EF) have been popularly used in source identification of rainwater elements. In EF method, Na is regarded as the reference element, and Na is assumed to be from only one marine origin. The enrichment factors relative to seawater values (EFseawater) for target ions can be calculated according to Equation (4).
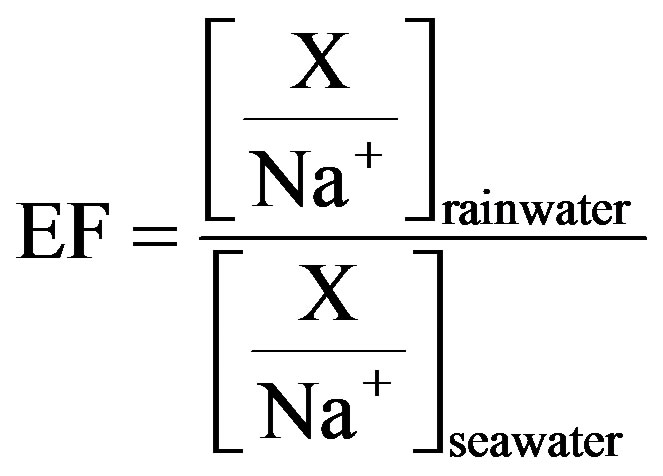 (4)
(4)
In Equation (4), X represents the different target ions. [X/Na+]seawater refers to the molar concentration ratios between the target ions and Na in seawater, which have already been measured (referred in Keene et al., 1986 [31]). In addition, [X/Na+]rainwater refers to the molar concentration ratios between the target ions and Na in rainwater samples. Because that ,
,  and F− are not significant components in sea salts, anthropogenic sources are responsible for the most of them, the EFseawater values are calculated only for K+, Ca2+, Mg2+,
  and Cl−.
Table 6 presents the EFseawater values calculated for the
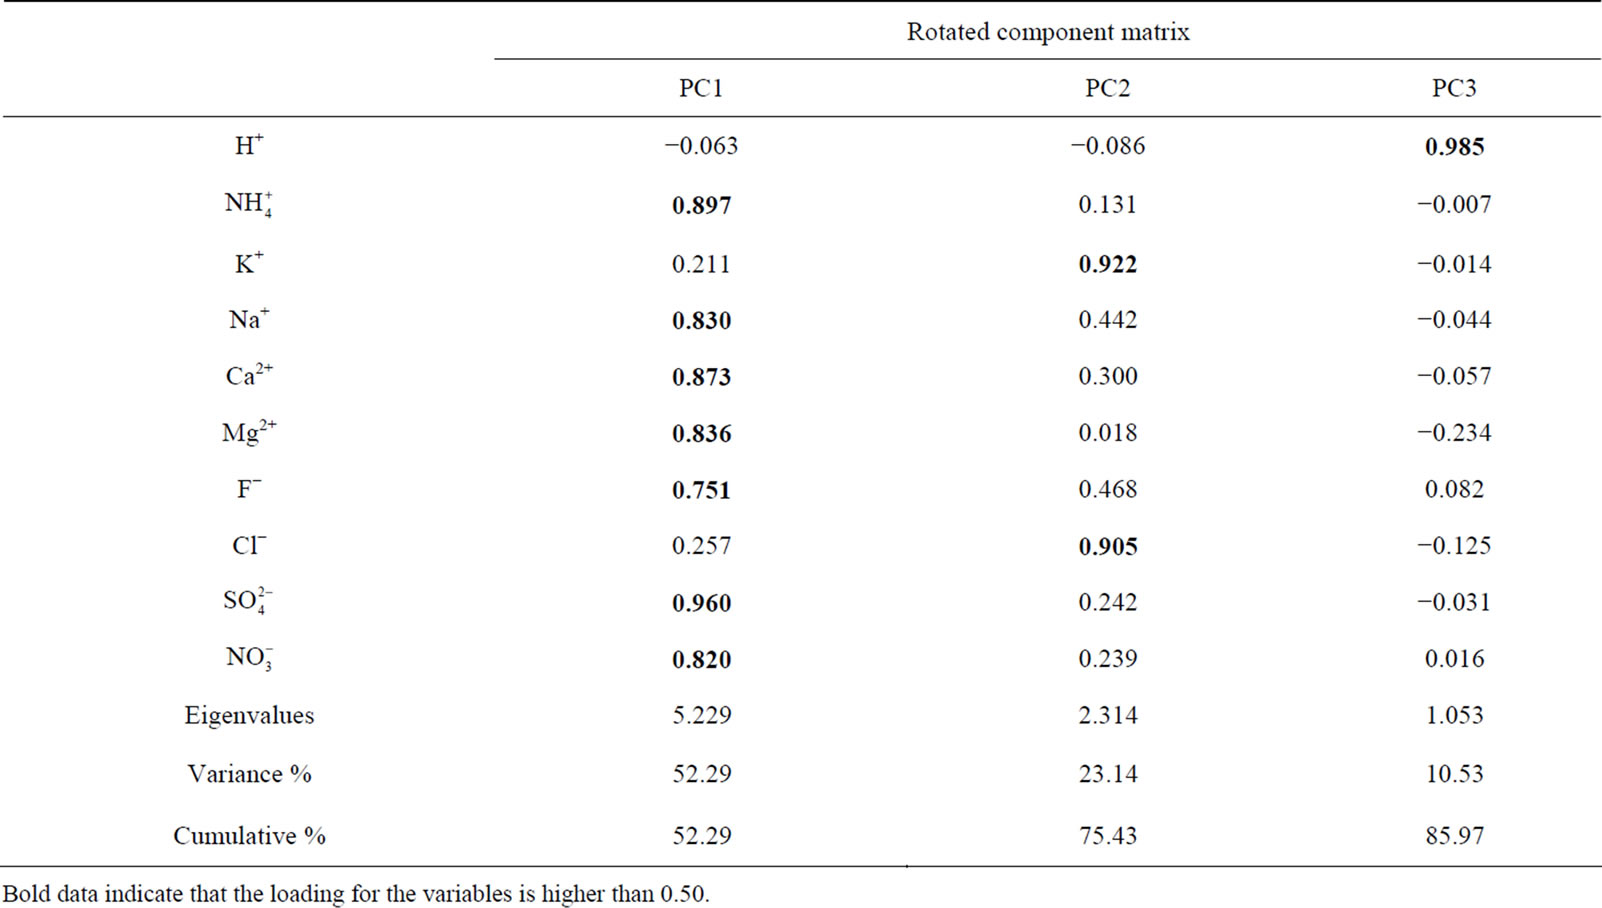
Table 5. Factor analysis on the chemical species of rainwater.
Bold data indicate that the loading for the variables is higher than 0.50.
target ions: the EFseawater value for Mg2+ is 3.41, indicating that marine source contributes a small fraction to the ion; K+, Ca2+ and  have strikingly high EFseawater values of 64.5, 128.2 and 93.7 respectively, implying almost no marine contribution to these ions in rainwater samples; the EFseawater value for Cl− is 1.42, demonstrating that Cl− involves an important proportion of marine origin in this study, which is ascribed to a long-range transport of sea salts from the Indian Ocean. However, the marine origin of Cl− may be overestimated using this method, because Cl− evaporates from rainwater to form gaseous HCl during transport when environmental condition is favorable.
3.6.4. Quantification of Major Ions from Different Sources
Providing that contributions from other natural sources are negligible, the ions in rainwater are absolutely from anthropogenic actions, crustal dusts and long-range transport of sea salts. To further evaluate the relative contribution of different sources to each kind of ion in rainwater, Na+ is used as marine reference, and the nonsea-salt fraction Mg2+ is regarded to be from crustal dusts only. The marine contribution for a given ion (i.e. K+, Ca2+, Mg2+, Cl− and ) can be calculated according to Equation (5):
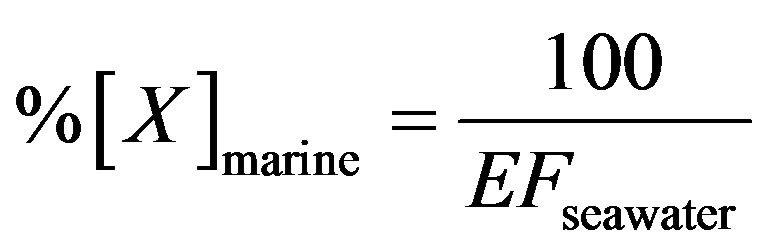 (5)
(5)
%[X]marine represents the contribution proportion of sea salt to the target ion in rainwater. Moreover, the crustal sources of K+ and Ca2+ can be evaluated based on the equivalent ratios of ([K+]/[Mg2+])crust and ([Ca2+]/ [Mg2+])crust of 0.48 and 1.87 respectively [5]. In addition, providing  from crustal source is supplied by gypsum, the equivalent ([
 ]/[Ca2+])crust ratio is 0.47 [5]. Following this line of thought, the crustal source of K+, Ca2+ and
  can be calculated based on the following relationship equations:
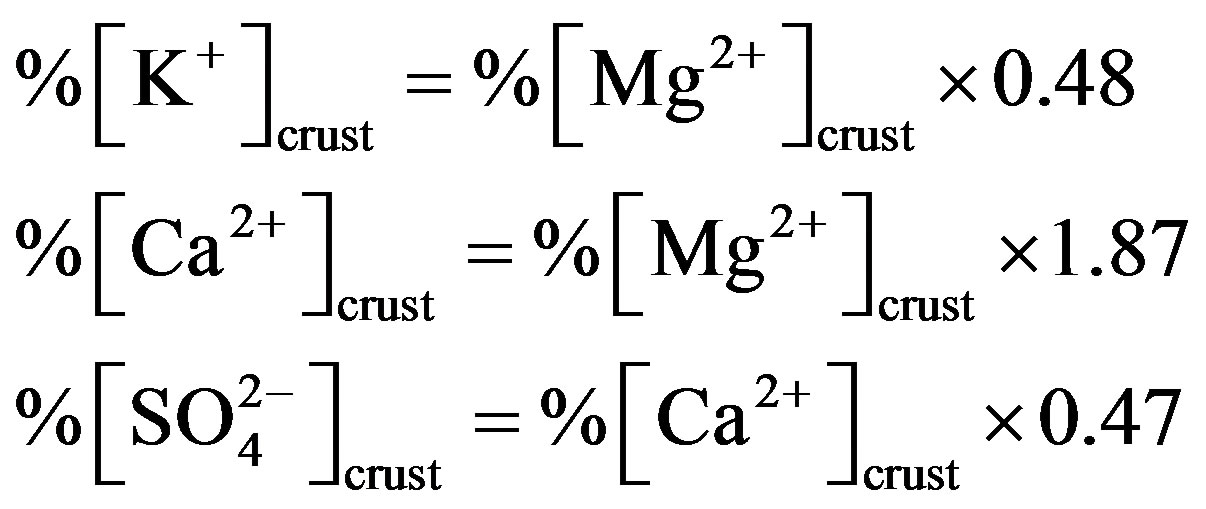 (6)
(6)
Furthermore, the anthropogenic source contributions of K+, Ca2+ and  can be easily calculated according to Equation (7):
 (7)
(7)
Table 7 shows the quantificational result of the source apportionment of the major ions in rainwater samples collected at TSPSAU. Sea salt, crustal and anthropogenic sources accounted for 8.1%, 5.5% and 86.4% of ionic mass for the rainwater samples respectively. Acid rain pollutions were caused mainly by anthropogenic influences in Ya’an.
4. Conclusion
Rainwater samples were collected at a semi-rural site in Ya’an from Sep. 2010 to Jun. 2011. Conductivity, pH values, and ionic concentrations of the rainwater samples were measured. The VWM concentration of the total ions of rainwater during a whole year was 809.75 µeq∙L−1. The annual VWM pH value was 4.03 and the annual acid rain frequency was 79%. Back-trajectory analysis indicated that the air masses in Ya’an can be divided into three types, prevailing in SW, NW and NE-E-SE respectively. Three principle factors were extracted from primary component analysis. The factors were explained by long-distance transport air masses, local biomass burning and the rain neutralization process respectively. Moreover, EF method was also used to identify the sources of rainwater. It revealed that the pollutants in wet deposition
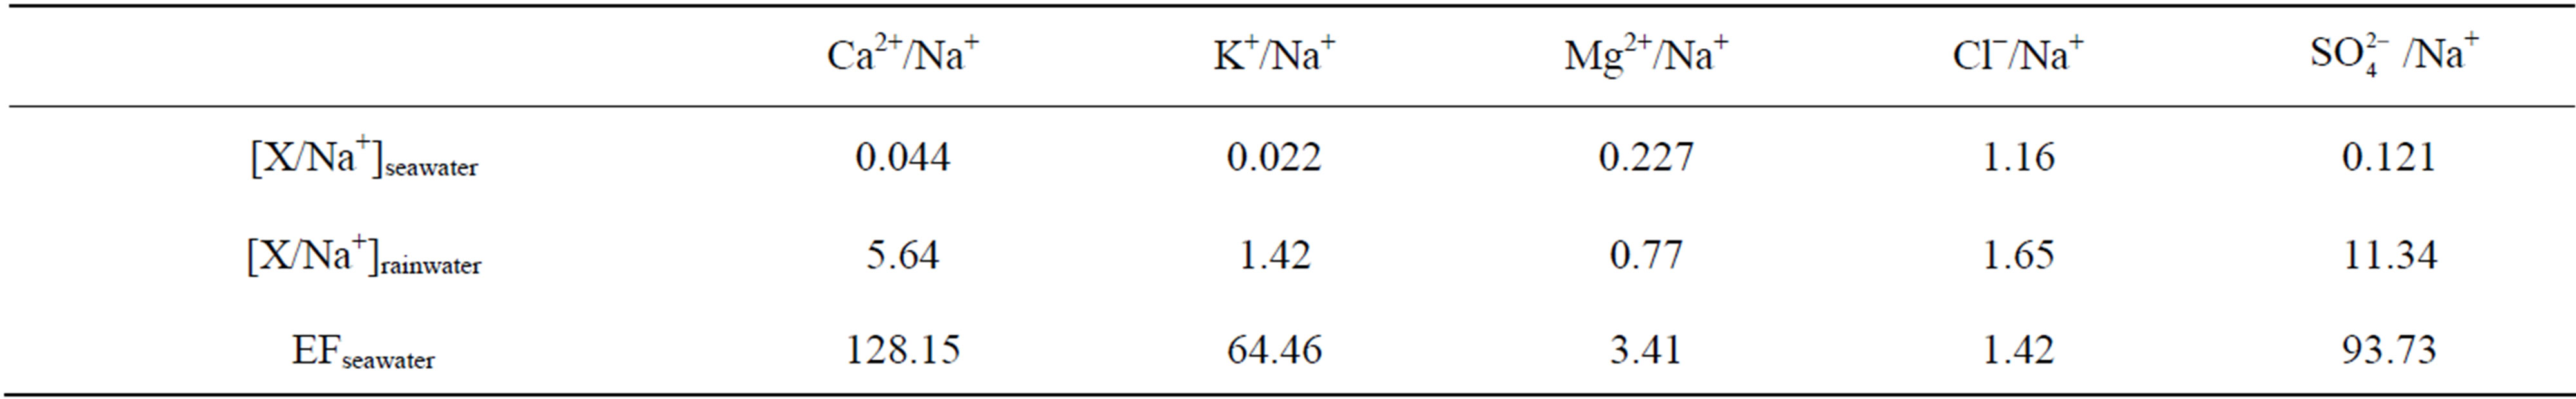
Table 6. EFseawater values calculated for different ionic species.
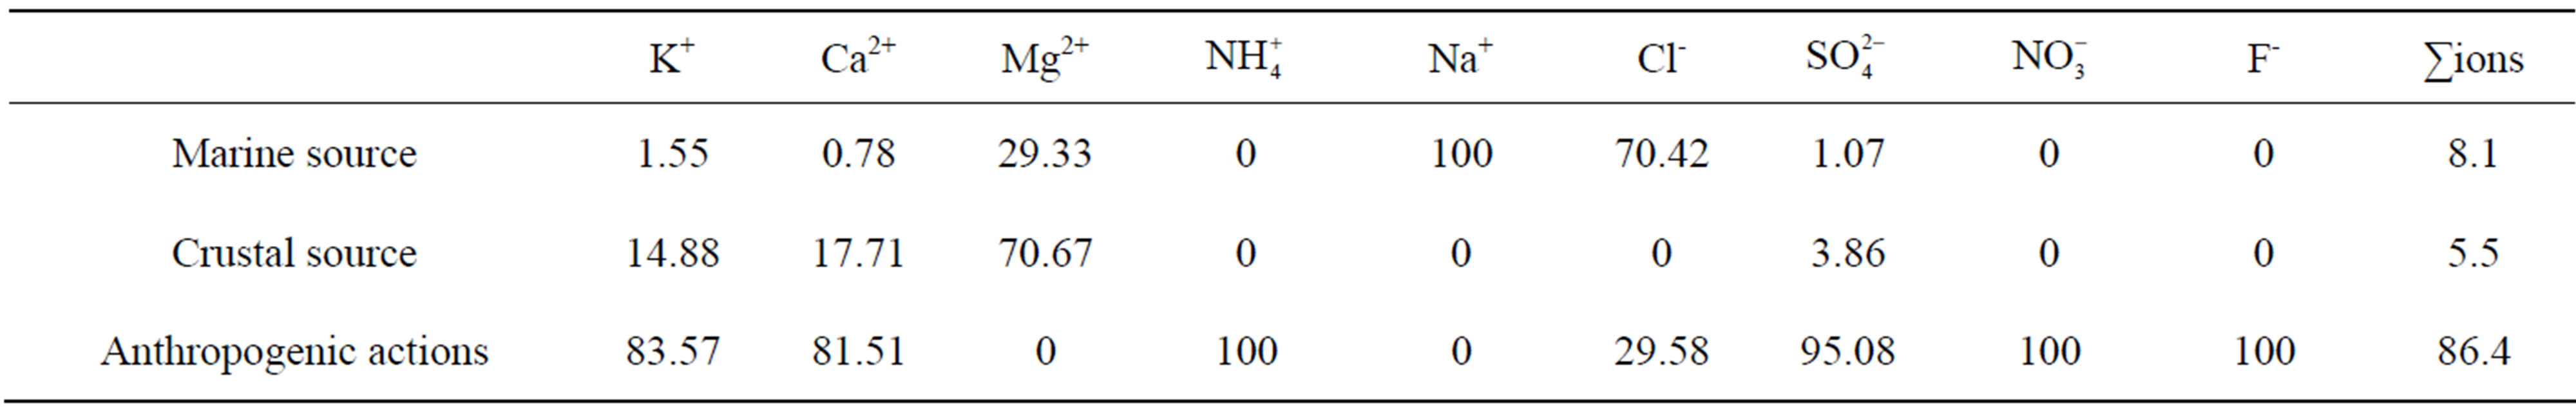
Table 7. Source apportionment of major ions in rainwater.
at the research site were from anthropogenic actions (86.4%), sea salts (8.1%) and crustal (5.5%) respectively.
5. Acknowledgements
This work was jointly supported by the Chinese National Natural Science Foundation (No. 41073101) and a key project of Sichuan Provincial Department of Education (No. 10ZA059). Zhilin Liu is supported by a Student Program of Scientific Interest Cultivation Plan of Sichuan Agricultural University.
REFERENCES
- T. Larssen, E. Lydersen, D. Tang, Y. He, J. Gao, H. Liu, L. Duan, H. M. Seip, R. D. Vogt, J. Mulder, M. Shao, Y. Wang, H. Shang, X. Zhang, S. Solberg, W. Aas, T. Økland, O. Eilertsen, V. Angell, Q. Liu, D. Zhao, R. Xiang, J. Xiao and J. Luo, “Acid Rain in China,” Environment Science & Technology, Vol. 40, No. 2, 2006, pp. 418-425. http://dx.doi.org/10.1021/es0626133
- T. Larssen, H. M. Seip, A. Semb, J Mulder, I. P. Muniz, R. D. Vogt, E. Lydersen, V. Angell, T. Dagang and O. Eilertsen, “Acid Deposition and Its Effects in China: An Overview,” Environmental Science & Policy, Vol. 2, No. 1, 1999, pp. 9-24. http://dx.doi.org/10.1016/S1462-9011(98)00043-4
- R. A. Goyer, J. Bachmann, T. W. Clarkson, B. G. Ferris, J. Graham, P. Mushak, D. P. Perl, D. P. Rall, R. Schlesinger, W. Sharpe and J. M. Wood, “Potential Human Health Effects of Acid Rain: Report of a Workshop,” Environmental Health Perspectives, Vol. 60, No. 5, 1985, pp. 355-368. http://dx.doi.org/10.1289/ehp.8560355
- M. Zhang, S. Wang, F. Wu, X. Yuan and Y. Zhang, “Chemical Compositions of Wet Precipitation and Anthropogenic Influences at a Developing Urban Site in Southeastern China,” Atmospheric Research, Vol. 84, No. 4, 2007, pp. 311-322. http://dx.doi.org/10.1016/j.atmosres.2006.09.003
- K. Huang, G. Zhuang, C. Xu, Y. Wang and A. Tang, “The Chemistry of the Severe Acidic Precipitation in Shanghai, China,” Atmospheric Research, Vol. 89, No. 1, 2008, pp. 149-160. http://dx.doi.org/10.1016/j.atmosres.2008.01.006
- D. Y. Huang, Y. G. Xu, P. Peng, H. H. Zhang and J. B. Lan, “Chemical Composition and Seasonal Variation of Acid Deposition in Guangzhou, South China: Comparison with Precipitation in Other Major Chinese Cities,” Environment Pollution, Vol. 157, No. 1, 2009, pp. 35-41. http://dx.doi.org/10.1016/j.envpol.2008.08.001
- W. X. Wang and T. Wang, “On the Origin and the Trend of Acid Precipitation in China,” Water, Air and Soil Pollution, Vol. 85, No. 4, 1995, pp. 2295-2300. http://dx.doi.org/10.1007/BF01186176
- W. Aas, M. Shao, L. Jin, T. Larssen, D. Zhao, R. J. Xiang, J. H. Zhang, J. S. Xiao and L. Duan, “Air Concentrations and Wet Deposition of Major Inorganic Ions Five NonUrban Sites in China, 2001-2003,” Atmospheric Environment, Vol. 41, No. 8, 2007, pp. 1706-1716. http://dx.doi.org/10.1016/j.atmosenv.2006.10.030
- D. Migliavacca, E. C. Teixeira, F. Wiegand, A. C. M. Machado and J. Sanchez, “Atmospheric Precipitation and Chemical Composition of an Urban Site, Guaíba Hydrographic Basin, Brazil,” Atmospheric Environment, Vol. 39, No. 10, 2005, pp. 1829-1844. http://dx.doi.org/10.1016/j.atmosenv.2004.12.005
- P. A. Roelle and V. P. Aneja, “Characterization of Ammonia Emissions from Soils in the Upper Coastal Plain, North Carolina,” Atmospheric Environment, Vol. 36, No. 20, 2002, pp. 1087-1097. http://dx.doi.org/10.1016/S1352-2310(01)00355-7
- K. Ali, G. A. Momin, S. Tiwari, P. D. Safai, D. M. Chate and P. S.-P. Rao, “Fog and Precipitation Chemistry at Delhi, North India,” Atmospheric Environment, Vol. 38, No. 25, 2004, pp. 4215-4222. |http://dx.doi.org/10.1016/j.atmosenv.2004.02.055
- A. Mihajlidi-Zelić, I. Deršek-Timotić, D. Relić, A. Popović and D. Đorđević, “Contribution of Marine and Continental Aerosols to the Content of Major Ions in the Precipitation of the Central Mediterranean,” Science of Total Environment, Vol. 370, No. 2, 2006, pp. 441-451. http://dx.doi.org/10.1016/j.scitotenv.2006.07.017
- H. Rodhe, F. Dentener and M. Schulz, “The Global Distribution of Acidifying Wet Deposition,” Environment Science & Technology, Vol. 36, No. 20, 2002, pp. 4382- 4388. http://dx.doi.org/10.1021/es020057g
- L. Li, D. J. Dai, S. H. Deng, J. L. Feng, M. Zhao, J. Wu, L. Liu, X. H. Yang, S. S. Wu, H. Qi, G. Yang, X. H. Zhang, Y. J. Wang and Y. Z. Zhang, “Concentration, Distribution and Variation of Polar Organic Aerosol Tracers in Ya’an, a Middle-Sized City in Western China,” Atmospheric Research, Vol. 120, No. 2, 2013, pp. 29-42. http://dx.doi.org/10.1016/j.atmosres.2012.07.024
- HJ/T165, “Technical Specifications for Acid Deposition Monitoring,” State Environmental Protection Administration of China, Beijing, 2004. (in Chinese)
- N. Rastogi and M. M. Sarin, “Chemical Characteristics of Individual Rain Events from a Semi-Arid Region in India: Three-Year Study,” Atmospheric Environment, Vol. 39, No. 18, 2005, pp. 3313-3323.
- Z. F. Xu and G. L. Han, “Chemical and Strontium Isotope Characterization of Rainwater in Beijing, China,” Atmospheric Environment, Vol. 43, No. 12, 2009, pp. 1954- 1961. http://dx.doi.org/10.1016/j.atmosenv.2009.01.010
- T. Okuda, T. Iwase, H. Ueda, Y. Suda, S. Tanaka, Y. Dokiya, K. Fushimi and M. Hosoe, “Long-Term Trend of Chemical Constituents in Precipitation in Tokyo Metropolitan Area, Japan, from 1990 to 2002,” Science of Total Environment, Vol. 339, No. 1, 2005, pp. 127-141. http://dx.doi.org/10.1016/j.scitotenv.2004.07.024
- F. Song and Y. Gao, “Chemical Characteristics of Precipitation at Metropolitan Newark in the US East Coast,” Atmospheric Environment, Vol. 43, No. 32, 2009, pp. 4903-4913.
- M. A. Santos, C. F. Illanes, A. Fornaro and J. J. Pedrotti, “Acid Rain in Downtown Sao Paulo City, Brazil,” Water, Air and Soil Pollution, Vol. 7, No. 1, 2007, pp. 85-92.
- M. Panyakapo and R. Onchang, “A Four-Year Investigation on Wet Deposition in Western Thailand,” Journal of Environmental Sciences, 2008, Vol. 20, No. 4, 2008, pp. 441-448.
- H. Wang and G. L. Han, “Chemical Composition of Rainwater and Anthropogenic Influences in Chengdu, Southwest China,” Atmospheric Research, 2011, Vol. 99, No. 2, 2011, pp. 190-196.
- Y. Huang, Y. Wang and L. Zhang, “Long-Term Trend of Chemical Composition of Wet Atmospheric Precipitation during 1986-2006 at Shenzhen City, China,” Atmospheric Environment, Vol. 42, No. 16, 2008, pp. 3740-3750. http://dx.doi.org/10.1016/j.atmosenv.2007.12.063
- M. Xu, A. H. Lu, F. Xu and B. Wang, “Seasonal Chemical Composition Variations of Wet Deposition in Urumchi, Northwestern China,” Atmospheric Environment, Vol. 42, No. 5, 2008, pp. 1042-1048. http://dx.doi.org/10.1016/j.atmosenv.2007.11.008
- K. Ali Al-Khashman, “Chemical Characteristics of Rainwater Collected at a Western Site of Jordan,” Atmospheric Research, Vol. 91, No. 1, 2009, pp. 53-61. http://dx.doi.org/10.1016/j.atmosres.2008.05.007
- K. F. Biswas, B. M. Ghauri and L. Husain, “Gaseous and Aerosol Pollutants during Fog and Clear Episodes in South Asian Urban Atmosphere,” Atmospheric Environment, Vol. 42, No. 33, 2008, pp. 7775-7785. http://dx.doi.org/10.1016/j.atmosenv.2008.04.056
- Y. Cao, S. Wang, G. Zhang, J. Luo and S. Lu, “Chemical Characteristics of Wet Precipitation at an Urban Site of Guangzhou, South China,” Atmospheric Research, Vol. 94, No. 3, 2009, pp. 462-469. http://dx.doi.org/10.1016/j.atmosres.2009.07.004
- P. D. Safai, P. S. P. Rao, G. A. Momin, K. Ali, D. M. Chate and P. S. Praveen, “Chemical Composition of Precipitation during 1984-2002 at Pune, India,” Atmospheric Environment, Vol. 38, No. 12, 2007, pp. 1705-1714. http://dx.doi.org/10.1016/j.atmosenv.2003.12.016
- R. Balasubramanian, T. Victor and N. Chun, “Chemical and Statistical Analysis of Precipitation in Singapore,” Water, Air and Soil Pollution, Vol. 130, No. 1, 2001, pp. 451-456. http://dx.doi.org/10.1023/A:1013801805621
- F. Yang, J. Tan, Z. Shi, Y. Cai, K. He, Y. Ma, F. Duan, T. Okuda, S. Tanaka and G. Chen, “Five-Year Record of Atmospheric Precipitation Chemistry in Urban Beijing, China,” Atmospheric Chemistry and Physics, Vol. 12, No. 4, 2012, pp. 2025-2035. http://dx.doi.org/10.5194/acp-12-2025-2012
- W. C. Keene, A. A.-P. Pszenny, J. N. Galloway and M. E. Hawley, “Sea-Salt Corrections and Interpretation of Constituent Ratios in Marine Precipitation,” Journal of Geophysical Research, Vol. 91, No. D6, 1986, pp. 6647-6658. http://dx.doi.org/10.1029/JD091iD06p06647
NOTES
*Corresponding author.