Atmospheric and Climate Sciences
Vol.3 No.1(2013), Article ID:27574,12 pages DOI:10.4236/acs.2013.31009
Preliminary Results of a Data Assimilation System
ISAC-CNR, UOS of Rome, via del Fosso del Cavaliere, Rome, Italy
Email: s.federico@isac.cnr.it
Received September 2, 2012; revised October 1, 2012; accepted October 9, 2013
Keywords: Meteorological Analysis; Forecasting Systems; Short-Term Forecast of Winds; Variational Methods
ABSTRACT
A data assimilation system combines all available information on the atmospheric state in a given time-window to produce an estimate of atmospheric conditions valid at a prescribed analysis time. Nowadays, increased computing power coupled with greater access to real-time asynoptic data is paving the way toward a new generation of high-resolution (i.e. on the order of 10 km) operational mesoscale analyses and forecasting systems. Moreover, better initial conditions are increasingly considered of the utmost importance for Numerical Weather Prediction (NWP) at the short range (0 - 12 h). This paper presents a general-purpose data assimilation system, which is coupled with the Regional Atmospheric Modelling System (RAMS) to give the analyses for: zonal and meridional wind components, temperature, relative humidity, and geopotential height. In order to show its potential, the data assimilation systems applied to produce analyses over Central Europe. For this application the background field is given by a short-range forecast (12 h) of the RAMS and analyses are produced by 2D-Var with 0.25˚ horizontal resolution. Results show the validity of the analyses because they are closer to the observations, consistently with the settings of the data assimilation system. To quantify the impact of improved initial conditions on the forecast, the analyses are then used as initial conditions of a short-range (6 h) forecast of the RAMS model. The results show that the RMSE is effectively reduced for the oneand two hours forecast, with some improvement for the three-hours forecast.
1. Introduction
Modern NWP data assimilation systems use information from a range of sources to provide the best estimate, i.e. the analysis, at a given time. These systems combine information coming from the observations, an a-priori estimate of the atmospheric state (the background or first-guess field), detailed error statistics, and the law of physics.
Nowadays, increased computing power coupled with greater access to real-time asynoptic data is paving the way toward a new generation of high-resolution (i.e., on the order of 10 km or less) operational mesoscale analyses and forecasting systems [1-5]. Moreover, better initial conditions are increasingly considered vital for a range of NWP applications, in particular at the short range (0 - 12 h [6-7]).
This paper shows preliminary results of a data assimilation system, which is under development with the following two purposes: 1) to produce analyses of meteorological parameter; 2) to improve the short-term forecast of atmospheric fields.
The analyses are given for the following parameters: zonal and meridional wind components, temperature, relative humidity, and geopotential height.
The data assimilation system is a stand-alone package that can be used with different backgrounds. However, in this paper it is used in conjunction with the RAMS model [8,9]. So, the data assimilation system uses the RAMS fields as background and the analyses are used to initialize the RAMS model.
The observations used in the data assimilation system are the profiles of the variables of interest, and in particular those distributed through the Global Telecommunication System (GTS).
The main features of the analysis system (2D-Var) used in this work are:
1) Incremental formulation of the cost-function [10], i.e. observations are assimilated to provide analysis increments. In this way, the analysis imbalance is kept at minimum as the first guess forecast, to which the increments are added, is already balanced because it usually comes from the output of a numerical model.
2) Preconditioning of the background cost function through a “control variable transformation” U defined as B = UUT, where B is the background error covariance matrix, which is formulated in a simple way.
3) Background error covariances are estimated via the National Meteorological Center (NMC, [11]) method, which gives the length-scale used in the background error covariance matrix. The background and observational errors, as well as the length-scale of the background error, are a function of the vertical level.
The goals of this paper are the following two: 1) to quantify the performance of the analyses at improving the initial state of the RAMS model; 2) to show the impact of the data assimilation system on the short-range forecast of the RAMS model.
It is important to highlight that a two-dimensional solution (2D-Var) is used to solve a three-dimensional problem, which is a limitation of this work because the vertical correlation of the error is neglected. This causes a loss of information in the analyses, which are less accurate compared to those computed with threeand fourdimensional methods [2,4,5]. Moreover the RAMDAS 4D-Var analysis system is also available for the RAMS model [5,12].
Nevertheless, the adoption of the 2D-Var system of this paper is motivated by the following three reasons: 1) the method is computationally faster, which is important from the operational point of view, and simpler to implement compared to threeand four-dimensional methods; 2) the 2D-Var solution may still produce analyses with a valuable impact on the short-term forecast; 3) a well designed 2D-Var method provides the base for the implementation of more advanced variational systems because many of the algorithms required by 3D-Var and 4D-Var methods (observation operators, minimization packages, background error covariances, etc.) are contained in 2D-Var.
The paper is divided as follows: Section 2 provides details about the method of solution used in this paper; Section 3 shows how the analysis system and the RAMS model are coupled and shows the strategy adopted to achieve the goals of this works; Section 4 gives the results, and; Section 5 gives conclusions.
2. The 2D-Var Method
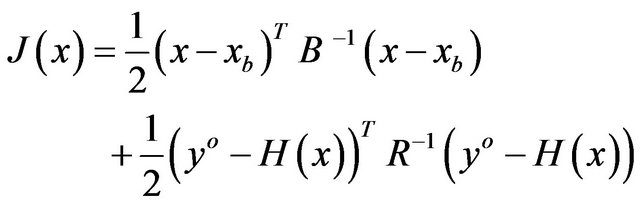
The basic goal of the 2D-Var algorithm is to produce an optimal estimate of the true atmospheric state at analysis time through iterative solution of a prescribed cost-function [13,14]:
 (1)
(1)
where J(x) is the costfunction, xb is the background state, H is the forward observational operator, yo is the vector of the observations, B, and R are the background, and observational error covariance matrices, respectively.
The problem can be summarized as the iterative solution of Equation (1) to find the analysis state x that minimizes J(x). This solution represents the a posteriori maximum likelihood estimate of the true state of the atmosphere given the two sources of a priori data: the background xb and observations yo [13].
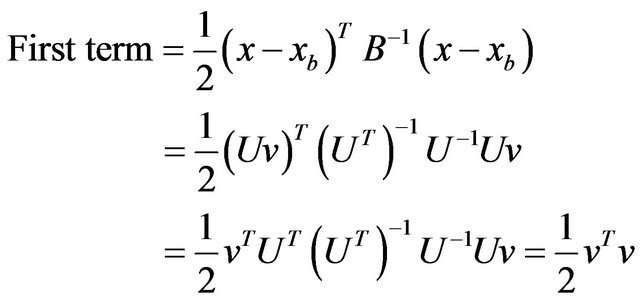
A preconditioning via a control variable v transform defined by x' = Uv is performed before the minimization of (1) where x' = x − xb. The transform U is chosen to satisfy the relationship B = UUT. Using the incremental formulation [10] and the control variable transform, the two terms of the r.h.s. of Equation (1) may be managed as follows:
For the second term we assume that the background xb gives a good estimate of the final state x and we notice that:
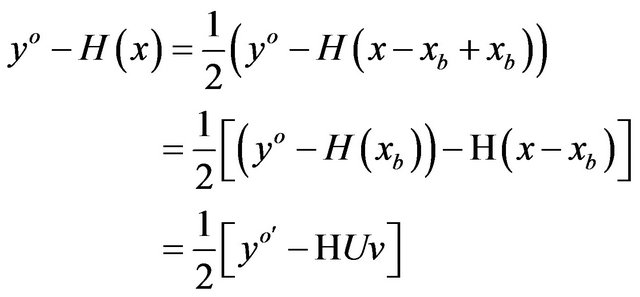
where yo' = yo – H(xb) is the innovation vector and H is the jacobian of the potentially nonlinear observation operator H used in the calculation of yo'.
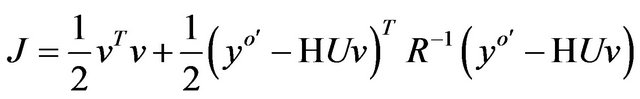
Considering the above results, the Equation (1) may be rewritten as:
 (2)
(2)
In this form, the background term is diagonalized, reducing the number of calculations required from O(n2) to O(n), where n is the dimension of x.
Another goal of the control variable transform is to represent spatial correlations in an accurate and simple form. In the implementation of the 2D-Var scheme of this paper, the transformation U is given by:
 (3)
(3)
where E and L are defined by: 
The background error matrix has a Gaussian shape whose length scale is derived by the NMC method, as shown in Appendix A. The background error matrix depends on the background error . In particular, B is an n × n matrix whose element ij is the value of the Gaussian for the distance between the grid points i and j multiplied by
 . The background
  and observational
  errors are introduced in the Appendix A and are derived from the bibliography.
The observational error covariance matrix R is a p × p diagonal matrix whose elements are all equal to the observational error  and p is the number of observations available at the analysis time for a level.
The values of the observational and background errors, as well as the length-scale for each parameter depend on the vertical level and the cost-function (1) is minimized for each vertical level.
The Numerical Experiment Set-Up
The background and the forecast are issued by the RAMS model (non-hydrostatic), version 6.0. Its physical setting is summarized in Table 1 and is the same of that used for operational forecast in southern Italy [21].
An important issue in coupling the RAMS model with the data assimilation system is that they use different coordinate systems both in the horizontal and in the vertical. The data assimilation system uses a regularly spaced longitude-latitude grid, while the RAMS model uses a rotated polar stereographic projection, whose pole is rotated near the centre of the domain to minimize the distortion of the projection in the main area of interest.
In the vertical direction, RAMS uses sigma-z terrain following coordinates [9], while the analysis algorithm uses pressure.
To cope with the differences between the analysis and forecast coordinate systems, two different RAMS settings are used: a “background run” and a “forecast run”. The background run has one domain with 10 km horizontal grid resolution (Table 2, Figure 1) and covers almost all Europe. The background run gives the firstguess fields for the analyses.
Then analyses are performed on the analysis grid, whose domain spans most of Europe (Table 2, Figure 1), and whose horizontal resolution is 0.25˚. The analysis grid is contained in the background grid, both horizontally and vertically.
The analyses are used to initialize a new run of the RAMS model, i.e. the forecast run, whose domain is contained inside the analysis domain, both horizontally and vertically (Table 2, Figure 1).
Table 1. RAMS model physical settings for the background and forecast run.
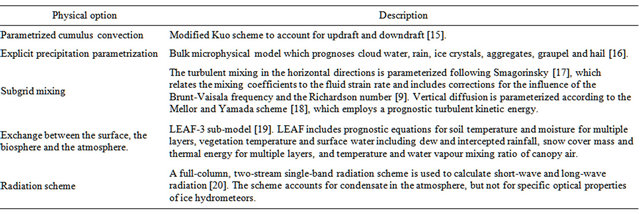
Table 2. RAMS grid-setting for the background and forecast run. NNXP, NNYP and NNYZ are the number of grid points in the west-east, north-south, and vertical directions. Lx (km), Ly (km), Lz (m) are the domain extension in the west-east, north-south, and vertical directions. DX (km) and DY (km) are the horizontal grid resolutions in the west-east and northsouth directions. CENTLON and CENTLAT are the geographical coordinates of the grid centres.
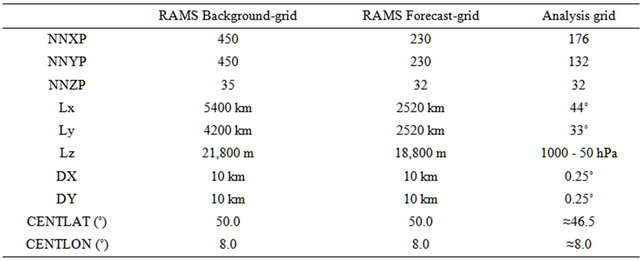
The analysis grid (rightmost column) is regularly spaced in longitude and latitude and uses pressure as vertical coordinate.
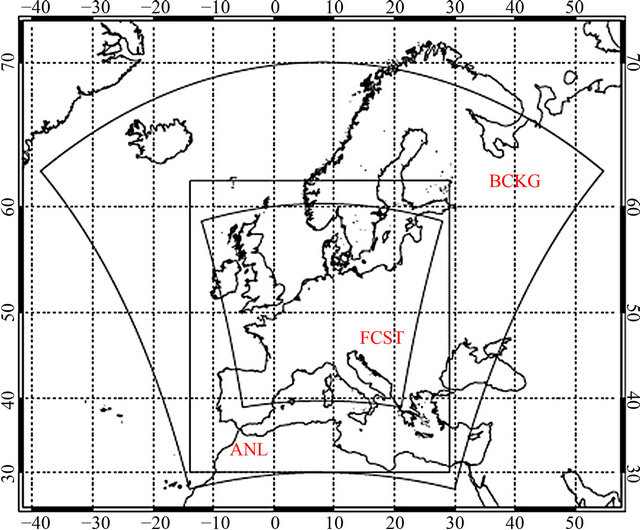
Figure 1. The three domains: BCKG is the domain of the background run; ANL is the domain of the data assimilation system; FCST is the domain of the forecast run.
In the vertical, the RAMS model uses thirty-five levels for the background run and thirty-two levels for the forecast run. Levels are not equally spaced: layers within the Planetary Boundary Layer (PBL) are between 50 and 200 m thick, whereas layers in the middle and upper troposphere are 1000 m thick.
The analysis grid uses thirty-one pressure levels from 1000 hPa to 50 hPa. Pressure levels are spaced every 50 hPa between 800 and 300 hPa, and every 25 hPa below 800 hPa and between 300 hPa and 150 hPa. Above 150 hPa the vertical levels used are: 130, 110, 100, 80, 65, and 50 hPa. This choice enhances the resolution near the surface, and is a compromise between the computing time and the resolution of the analyses.
Observations used in this work are TEMP (both land and ship) reports over Europe and the European wind profiler network.
TEMP reports contain, among others, vertical soundings of relative humidity, temperature, wind speed and direction, and height. The European wind profilers network measures the wind speed and direction in the vertical above the instrument.
Observations were downloaded from MARS (Meteorological Archive and Retrieval System, see also http:// www.ecmwf.int/publications/manuals/mars/) of ECMWF (European Centre for Medium Weather range Forecast) and were available from 1 to 30 August 20081.
To perform analyses, measurements are interpolated onto the vertical levels of the analysis grid. Temperature and relative humidity are interpolated assuming they are linear in log-pressure. The velocity components are assumed linear in pressure. The same behaviour of the variables with height is assumed to interpolate the fields between the RAMS sigma-z levels and the pressure levels of the analysis grid and vice versa.
Finally, only measurements whose difference with the background is under a fixed threshold are used in the analyses. The thresholds considered in this paper are equal for all levels and are the following: 25 m for geopotential height, 5 K for temperature, 10 m/s for zonal and meridional wind components and 30% for relative humidity. This is the only quality check adopted for the observations, and is used to discard measurements affected by gross errors.
To quantify the impact of the analysis both in the improvement of the initial state and in the short-term forecast of the RAMS model, the following strategy is adopted (Figure 2). For each day of August 2008 one background run lasting 24 h is made starting at 00 UTC. Its initial and boundary conditions are derived, every 6 h, from the operational analysis/240 h forecast cycle of the ECMWF. These fields are available at 0.5˚ horizontal resolution.
After 12 h of background run, an analysis is made at 12 UTC. This hour was chosen because there are several reporting TEMP and wind profiler reports, which can be used to analyse the parameters considered in this paper. Figure 3 shows the number of data available for the analyses for the period. It is noticeable that there are more data for the wind components because of the data coming from the European wind profiler network, noticeably below 500 hPa. It is also important to highlight that the results of this paper are shown up to 200 hPa because there are fewer data at higher levels and statistics become noisier.
Starting at the analysis time (12 UTC), a short-term RAMS forecast, lasting 6 h, is made using the forecast grid. For this run, the initial conditions are given by the analyses produced at 12 UTC, while the boundary conditions after 6 h are taken form the ECMWF operational analysis/240 h forecast cycle and are the same as the background run.
It is important to highlight that observations used at the analysis time are not used in the ECMWF 240 h forecast, which gives the boundary conditions for the background run and for the forecast run after the initialization time. The ECMWF 240 h forecast uses observations form a 6 h time window centered around the forecast initial time, (see http://www.ecmwf.int/products/ forecasts/guide/The_ECMWF_early_delivery_system.html). So the 12 UTC observations are used only in the initial conditions of the forecast run.
The root mean square error (RMSE) is computed between the background fields and observations, and between the forecast fields and observations for the whole period on the common forecast grid (Figure 1). The comparison of these statistics at the analysis time shows the performance of the data assimilation system (analysis stage); the same comparison for times following the analysis time quantify the impact of the analyses on the short-term forecast (forecast stage).
Finally, because the data for 10 August were not available, a total of thirty background run, analyses, and forecast run were collected for the whole period.
3. Results
3.1. The Analysis Stage
Hereafter the RMSE computed between the background run and the observations at a fixed time and for the whole period is referred as the background error (RMSE_b). Similarly, the RMSE computed between the forecast run and the observations at a fixed time and for the whole period is referred as the forecast error (RMSE_f). For the computation of both RMSEs, the grid point nearest to the observation is considered and the statistics are computed on the common forecast-grid domain (Figure 1).
It should also be emphasized that RMSE_f at the analysis time is computed after the analyses are used to initialize the RAMS model. So, the difference between the RMSE_b and RMSE_f accounts for the errors introduced by the interpolation between the RAMS and analysis grids.
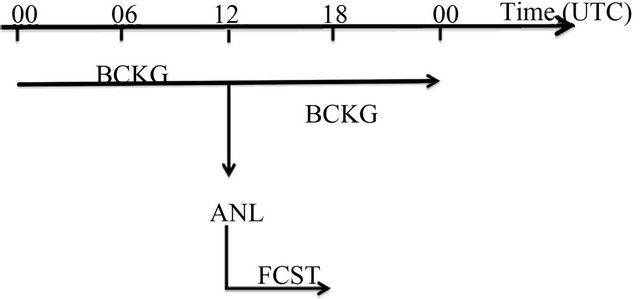
Figure 2. Synopsis of the simulations. BCKG is the background run, ANL is the analysis time, and FCST is the forecast run. One analysis is produced at 12 UTC.
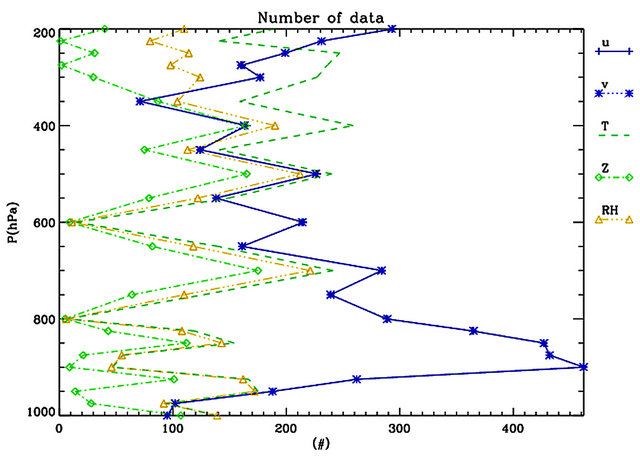
Figure 3. The number of data available at the analysis times for the whole period. The number of data for the wind components (u, v) is the same for all levels.
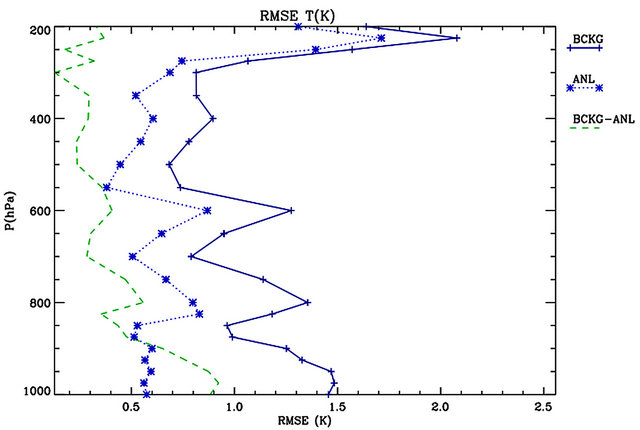
Figure 4(a) shows the RMSE_b and RMSE_f for the temperature. The RMSE_b varies between 0.7 K (500 hPa) and 2.1 K (225 hPa). The background error is larger above 300 hPa. The forecast error at the analysis time (RMSE_f) is reduced compared to the background error, as expected. It varies between 0.3 K and 0.9 K below 300 hPa and increases above this level.
From Figure 4(a) it is apparent that the analysis is effective at reducing the forecast error because RMSE_f is roughly halved compared to RMSE_b for several levels. This result is in agreement with the data assimilation system setting. In particular, considering that the model error  is two times the observational error
  at all levels (Appendix A), the analysis near an observation is closer to its value than to the background, and the error is more than halved. In particular, for this ideal case it can be easily shown that the analysis error (RMSE_f) is
  of the background error (RMSE_b; [1]), i.e. 0.33 of the background error for the setting of this paper.
The error reduction of this simple ideal case is never attained because: 1) the observations for each level are usually more than one and the innovations of these measurements, i.e. the differences between the background and observations, interact with each other in the analysis; 2) the difference between RMSE_f and RMSE_b of Figure 4 accounts for the errors introduced by the interpolation between the analysis and forecast grids.
It is important to note the decrease of the performance of the analysis with increasing height, as shown by the decrease of the difference between RMSE_b and RMSE_f with height. This occurs because the vertical resolution of the analysis grid decreases at higher levels2, and the errors introduced by the vertical interpolation between the analysis and RAMS grids are larger.
Figure 4(b) shows the RMSE_b and RMSE_f for the relative humidity. The RMSE_b varies between 10% and 27% depending on the level and increases with height. The error is effectively reduced by the analysis because the RMSE_f is more than halved compared to RMSE_b at several levels.
Figure 4(c) shows the RMSE for the zonal wind component. The RMSE_b is about 2.0 m/s from 925 hPa to 450 hPa, while it increases above this level having a maximum of 3.4 m/s at 300 hPa. The error decreases by more than 1.0 m/s for several levels showing that the analysis if effective at reducing the initial error of the RAMS model.
Similar considerations apply for the meridional wind component (Figure 4(d)), showing that: 1) the error reduction at the analysis time is consistent with the data assimilation system setting, and; 2) the analysis is effecttive at reducing the RAMS model error at the analysis time.
Figure 4(e) shows the results for the geopotential height. The background error varies between 8 and 23 m for all levels and RMSE_b increases near the surface. The forecast error is halved up to 800 hPa and then the difference between RMSE_b and RMSE_f decreases, particularly above 300 hPa, where the effect of the analyses on the initial conditions of the forecast run becomes negligible.
This behaviour of the errors again shows the effect of the vertical interpolation between the analysis and forecast grids.
3.2. The Forecast Stage
In this section the impact of the analysis is shown for the short range forecast (0 - 3 h). Statistics are presented for the zonal and meridional wind components only, because few data are available for other variables.
Figure 5 shows the difference between RMSE_b and RMSE_f for the wind components. If this difference is positive, the short term forecast has a lower error than the background and it is effectively improved by the use of the analyses as initial conditions. If the difference between RMSE_b and RMSE_f is negative, using the analysis worsen the short-term forecast.
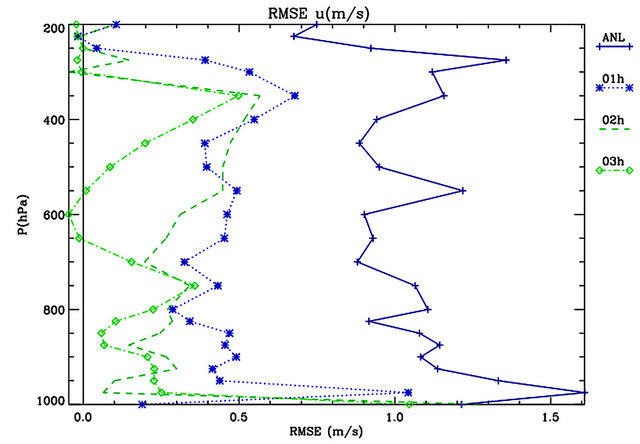
After one hour forecast, the improvement of the performance for the zonal velocity is evident. In particular, the difference of the RMSE_b and RMSE_f is positive with values ranging from 0.3 and 0.7 m/s, depending on the level, and for most levels it is about 0.5 m/s. The impact of the analysis is particularly positive at 975 hPa with an improvement of 1.0 m/s. The improvement of the wind forecast for lower levels, namely below 900 hPa, is important because it is useful to improve the wind forecast for wind power farms.
It is noticed that, even if there is an evident reduction of the improvement compared to the analysis time, analyses have a sizeable positive impact on the one-hour forecast (>0.2 m/s, see the discussion at the end of this section).
After two-hours forecast the improvement reduces. This is expected because the innovations introduced by the analyses to the background field have a radius of influence that depends on the height, but which is of the order of 150 km (Figure 6). So, as the forecast time progresses, these innovations are advected downwind and overpass the measurement position and its nearest gridpoint of the analysis grid, where the statistics RMSE_b and RMSE_f are computed.
Nevertheless, it is here noticed that the improvement it is well evident (>0.2 m/s) for most levels.
For the three-hours forecast, there is a further decrease
 (a)
(a)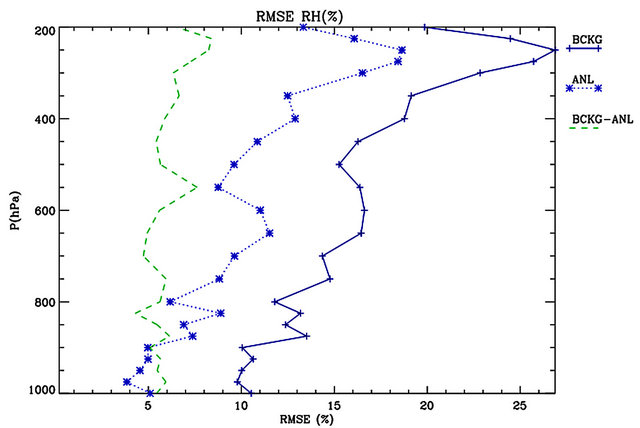 (b)
(b)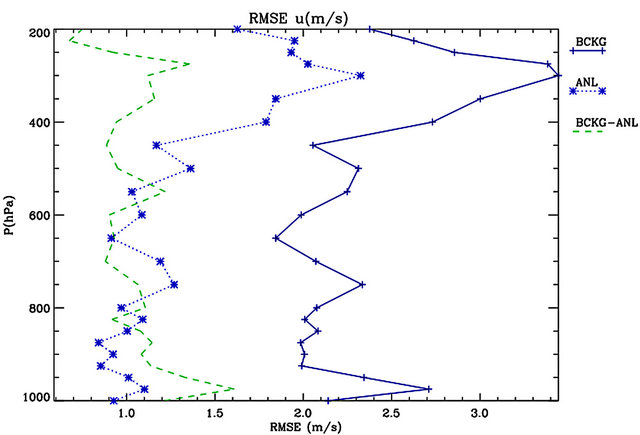 (c)
(c)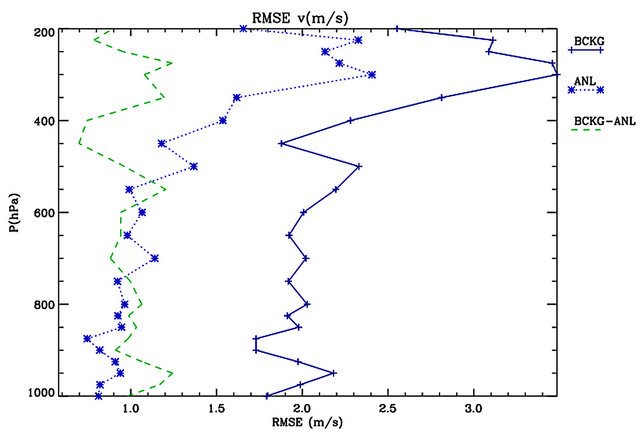 (d)
(d)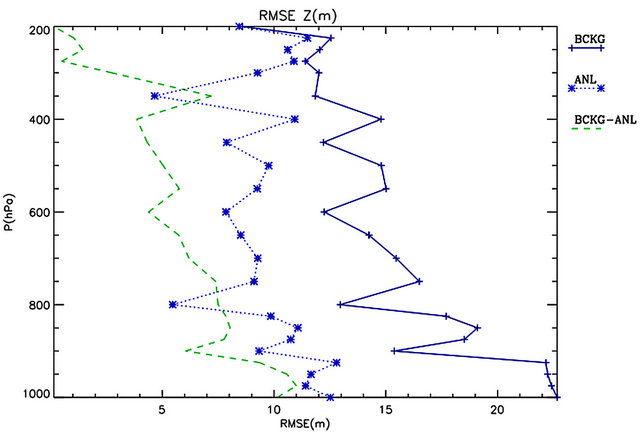 (e)
(e)
Figure 4. RMSE of the background field (BCKG) of the analyses (ANL), and their difference (BCKG-ANL) for: (a) Temperature; (b) Relative humidity; (c) Zonal wind component; (d) Meridional wind component; (e) Geopotential height. The RMSEs are computed for the whole period considering the grid-points nearest to the observations. The ANL statistics are computed after the RAMS model has been initialized from the analyses.
of the performance, as expected. There is still a sizeable improvement (>0.2 m/s) of the short-term forecast for some levels, noticeably below 900 hPa, but the improvement is negligible for most levels.
Using the analysis does not improve the twoand three-hours forecast above 300 hPa. This is a conesquence of the errors introduced by the interpolation between the RAMS and the analysis grids.
The differences between the background and forecast runs are small for forecasts longer than three-hours (absolute value less than 0.2 m/s, not shown), and, in practice, there isn’t an impact of the analyses on the short-term
 (a)
(a)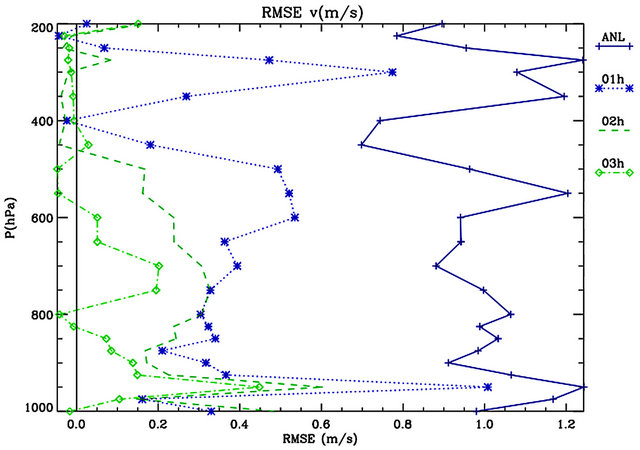 (b)
(b)
Figure 5. Differences between RMSE_b and RMSE_f for the analysis time (ANL), one—(01 h), two—(02 h), and three-hours (03 h) forecast for the: (a) Zonal wind component; (b) Meridional wind component. The RMSEs are computed for the whole period considering the grid-points nearest to the observations. The analysis time is shown to better understand the behaviour of the performance with time.
wind forecast after three-hours.
The results of Figure 5(a), applies similarly to those of Figure 5(b). In particular, after one-hour forecast the impact of the analysis on the short-term forecast reduces the error of about 0.2 - 0.8 m/s, for most levels. For these levels, the analysis is effective at reducing the forecast error. It is noticed that there is a decrease of the performance above 400 hPa because of the lower vertical resolution of the analysis.
After two-hours of forecast the improvement introduced by the analyses reduces for almost all levels, as expected. However, it is still sizeable below 550 hPa, and particularly below 900 hPa. After three-hours forecast the improvement is further reduced, but it is still present for few levels below 400 hPa. It is also noticed that the detrimental effect of using the analyses for the upper levels tends to affect a larger portion of the upper troposphere as the time progresses. However, the absolute value of this effect is small (less than 0.05 m/s), and does not increase with the forecasting time. For times larger than three-hours forecast, the differences between the background and forecast runs are small (absolute value less than 0.2 m/s, not shown) and will not be discussed further.
The model performance, both at the analysis time and for the short-term forecast, varies sizeably as a function of the pressure, as shown in Figure 5, and different performance may be obtained changing the vertical levels were measurements are recorded [22]. Nevertheless, it is expected that the results of Figures 4 and 5 are well representative of the model behaviour in the whole troposphere, because the statistics are reported for several levels in the low (including the planetary boundary layer), middle, and upper troposphere, then accounting for the different phenomena occurring in those layers.
It is interesting to quantify the impact that those results may have in practical applications. A useful measure of this quantity is the comparison of the difference between RMSE_b and RMSE_f (Figure 5) with the background error at the analysis time (Figures 4(c) and (d)). A useful threshold for this comparison is 10% of the background error, which corresponds to 0.2 m/s for most layers for both zonal and meridional wind components.
For the one-hour forecast, the difference between RMSE_b and RMSE_f is between 15% and 25% of the RMSE_b for most layers, both for the zonal and meridional wind components. So, the error reduction is a sizeable amount (>10%) of the initial background error, which is effectively reduced by the use of the analyses.
For the two-hours forecast, the improvement is reduced, but still larger than 10% of the initial background error for most levels. For the three-hours forecast the error reduction is larger than 10% of the initial error for several levels (9) of the zonal wind components and for few levels (3) of the meridional wind component.
So, from these results, it can be concluded that using the analysis may have a sizeable impact for the oneand two-hours forecast, with some improvement for the threehours forecast. Nevertheless, the results are encouraging and pave the way for improving the short-term forecast (0 - 3 h) of the RAMS model for wind.
4. Conclusions
This paper presents preliminary results of a general-purpose data assimilation system, which is under development with two main purposes: 1) to produce analyses of atmospheric parameters; 2) improve the short-term forecast of the RAMS model.
Analyses can be made for the following parameters: zonal and meridional wind components, relative humidity, geopotential height, and temperature. The data assimilation system in used together with the RAMS model, which gives the background fields for the analyses and can use the analyses as initial and boundary conditions.
The paper has two main goals: 1) to quantify the performance of the analyses at improving the initial state of the RAMS model; 2) to show the impact of the analyses on the short-term forecast. To get these two goals, the data assimilation system and the RAMS model have been used to make analyses/short-term forecasts for the month of August 2008. A total of thirty cases were collected.
The results for the analysis stage can be summarized as follows:
1) The analysis is effective at reducing the initial state RMSE. Because in the data assimilation system the measurements are considered more reliable than the background, it is expected a more than halved RMSE after analyses have been used to initialize the forecast run. This values, even if not attained for most levels, gives a good estimate of the error reduction showing the agreement between the results and the data assimilation system setting.
2) There is a decrease of the performance of the analysis at upper tropospheric levels because the level spacing increases and the errors introduced by the spatial interpolation between the RAMS and analysis levels are larger. Moreover, the background and analysis fields are more similar because there are comparatively fewer measurements at those levels. The decrease of the performance is unavoidable because a larger number of vertical levels would compromise the use of the system operationally.
The impact of the analyses on the short-term forecast was evaluated for the wind components only, because there are few measurements for other variables. The main conclusions are as follows:
1) Using the analyses improve the one-hour forecast for both wind components. In particular the use of the analyses reduces the RMSE between 15% and 25% of the background error for most levels.
2) The impact of the analyses on the two-hours forecast is reduced compared to the one-hour forecast. This result is expected because the radius of influence of the innovations is about 150 km for both wind components, so these innovations are advected downwind of the observational point, where statistics are computed, in few hours. Nevertheless, compared to the background error, the forecast error is reduced by more than 10% for most levels.
3) The impact of the analysis is negligible for most levels after three-hours forecast.
4) The detrimental effect of the analysis on the shortterm forecast, evident for few levels after twoand threehours forecast, is always small and does not increase with forecasting time.
It is finally noticed that the results of this paper are preliminary because they are limited to a short period of time. A definitive assessment of the impact of the data assimilation system on the improvement of the RAMS forecast would require much more simulations and is out of the scope of this paper.
5. Acknowledgements
This work was partially funded by the project “MAPVIC— Modellistica Agrometeorologica di Precisione per la Viticoltura Calabrese” funded by the Calabria Region. I am grateful to the “Aeronautica Militare Italiana” and to the ECMWF for the data and for their support in using the MARS archive. Part of the computation of this paper was performed on the ECMWF supercomputing enviroment through the special project SPITFEDE.
REFERENCES
- E. Kalnay, “Atmospheric Modeling, Data Assimilation and Predictability,” Cambridge University Press, Cambridge, 2003.
- D. M. Barker, W. Huang, Y. R. Guo and Q. N. Xiao, “A Three-Dimensional Variational Data Assimilation System for MM5: Implementation and Initial Results,” Monthly Weather Review, Vol. 132, No. 4, 2003, pp. 897-914. doi:10.1175/1520-0493(2004)132<0897:ATVDAS>2.0.CO;2
- S. M. Lazarus, C. M. Ciliberti, J. D. Horel and K. A. Brewster, “Near-Real-Time Applications of a Mesoscale Analysis System to Complex Terrain,” Weather Forecasting, Vol. 17, No. 5, 2002, pp. 149-160. doi:10.1175/1520-0434(2002)017<0971:NRTAOA>2.0.CO;2
- X.-Y. Huang, Q. N. Xiao, D. M. Barker, X. Zhang, J. Michalakes, W. Huang, T. Henderson, J. Bray, Y. S. Chen, Z. Z. Ma, J. Dudhia, Y. Guo, X. Y. Zhang, D. J. Won, H. C. Lin and Y.-H. Kuo, “Four-Dimensional Variational Data Assimilation for WRF: Formulation and Preliminary Results,” Monthly Weather Review, Vol. 137, No. 1, 2009, pp. 299-314. doi:10.1175/2008MWR2577.1
- M. Zupanski, D. Zupanski, T. Vukicevic, K. Eis and T. V. Haar, “CIRA/CSU Four-Dimensional Variational Data Assimilation System,” Monthly Weather Review, Vol. 133, No. 4, 2005, pp. 829-843. doi:10.1175/MWR2891.1
- F. Zhang, Z. Meng and A. Askoz, “Tests of an Ensemble Kalman Filter for Mesoscale and Regional-Scale Data Assimilation. Part I: Perfect Model Experiments,” Monthly Weather Review, Vol. 134, No. 2, 2005, pp. 722-736. doi:10.1175/MWR3101.1
- A. D. Schenkman, M. Xue, A. Shapiro, K. Brewster and J. Gao, “The Analysis and Prediction of the 8-9 May 2007 Oklahoma Tornadic Mesoscale Convective System by Assimilating WSR-88D and CASA Radar Data Using 3DVAR,” Monthly Weather Review, Vol. 139, No. 1, 2011, pp. 224-246. doi:10.1175/2010MWR3336.1
- W. R. Cotton, R. A. PielkeSr, R. L. Walko, G. E. Liston, C. J. Tremback, H. Jiang, R. L. McAnelly, J. Y. Harrington, M. E. Nicholls, C. G. Carrio and J. P. McFadden, “RAMS 2001: Current Status and Future Directions,” Meteorological and Atmospheric Physics, Vol. 82, No. 1-4, 2003, pp. 5-29.
- R. A. Pielke, “Mesoscale Meteorological Modeling,” Academic Press, San Diego, 2002.
- P. Courtier, J. N. Thépaut and A. Hollingsworth, “A Strategy for Operational Implementation of 4D-Var, Using an Incremental Approach,” Quarterly Journal of the Royal Meteorological Society, Vol. 120, No. 519, 1994, pp. 1367-1387. doi:10.1002/qj.49712051912
- D. F. Parrish and J. C. Derber, “The National Meteorological Center’s Spectral Statistical Interpolation Analysis System,” Monthly Weather Review, Vol. 120, No. 8, 1992, pp. 1747-1763. doi:10.1175/1520-0493(1992)120<1747:TNMCSS>2.0.CO;2
- R. Polkinghorne, T. Vukicevic and K. F. Evans, “Validation of Cloud-Resolving Model Background Data for Cloud Data Assimilation,” Monthly Weather Review, Vol. 138, No. 3, 2010, pp. 781-795. doi:10.1175/2009MWR3012.1
- K. Ide, P. Courtier, M. Ghil and A. C. Lorenc, “Unified Notation for Data Assimilation: Operational, Sequential and Variational,” Journal of the Meteorological Society of Japan, Vol. 75, No. 1B, 1997, pp. 181-189.
- A. C. Lorenc, “Analysis Methods for Numerical Weather Prediction,” Quarterly Journal of the Royal Meteorological Society, Vol. 112, No. 474, 1982, pp. 1177-1194.
- Molinari and T. Corsetti, “Incorporation of Cloud-Scale and Mesoscale Down-Drafts into a Cumulus Parametrization: Results of One and Three-Dimensional Integrations,” Monthly Weather Review, Vol. 113, No. 4, 1985, pp. 485-501. doi:10.1175/1520-0493(1985)113<0485:IOCSAM>2.0.CO;2
- R. L. Walko, W. R. Cotton, M. P. Meyers and J. Y. Harrington, “New RAMS Cloud Microphysics Parameterization Part I: The Single-Moment Scheme,” Atmospheric Research, Vol. 38, No. 1-4, 1995, pp. 29-62. doi:10.1016/0169-8095(94)00087-T
- J. Smagorinsky, “General Circulation Experiments with the Primitive Equations. Part I, the Basic Experiment,” Monthly Weather Review, Vol. 91, No. 3, 1963, pp. 99- 164. doi:10.1175/1520-0493(1963)091<0099:GCEWTP>2.3.CO;2
- G. Mellor and T. Yamada, “Development of a Turbulence Closure Model for Geophysical Fluid Problems,” Reviews of Geophysics and Space Physics, Vol. 20, No. 4, 1982, pp. 851-875. doi:10.1029/RG020i004p00851
- R. L. Walko, L. E. Band, J. Baron, T. G. Kittel, R. Lammers, T. J. Lee, D. Ojima, R. A. Pielke Sr., C. Taylor, C. Tague, C. J. Tremback and P. L. Vidale, “Coupled Atmosphere-Biosphere-Hydrology Models for Environmental Prediction,” Journal of Applied Meteorology, Vol. 39, No. 6, 2000, pp. 931-944. doi:10.1175/1520-0450(2000)039<0931:CABHMF>2.0.CO;2
- C. Chen and W. R. Cotton, “A One-Dimensional Simulation of the Stratocumulus-Capped Mixed Layer,” The Boundary Layer Meteorology, Vol. 25, No. 3, 1983, pp. 289-321. doi:10.1007/BF00119541
- S. Federico, “Verification of Surface Minimum, Mean, and Maximum Temperature Forecasts in Calabria for Summer 2008,” Natural Hazards and Earth System Sciences, Vol. 11, No. 2, 2011, pp. 487-500. doi:10.5194/nhess-11-487-2011
- A. Mazzarella, A. Giuliacci and I. Liritzis, “QBO of the Equatorial-Stratospheric Winds Revisited: New Methods to Verify the Dominance of 28-Month Cycle,” International Journal of Ocean and Climate Systems, Vol. 2, No. 1, 2011, pp. 19-26.
- D. K. Sashegyi, D. E. Harms, R. V. Madala and S. Raman, “Application of the Bratseth Scheme for the Analysis of GALE, Data Using a Mesoscale Model,” Monthly Weather Review , Vol. 121, No. 8, 1993, pp. 207-220. doi:10.1175/1520-0493(1993)121<0207:AOVMIT>2.0.CO;2
- P. Lönnberg and A. Hollingsworth, “The Statistical Structure of Short-Range Forecast Errors as Determined from Radiosonde Data. Part II: The Covariance of Height and Wind Errors,” Tellus, Vol. 38A, No. 2, 1986, pp. 137-161. doi:10.1111/j.1600-0870.1986.tb00461.x
Appendix A
This Appendix shows the details of the data assimilation system setting. In particular the observational and background errors are introduced, as well as the length-scale used for each parameter. All these quantities depend on the vertical level.
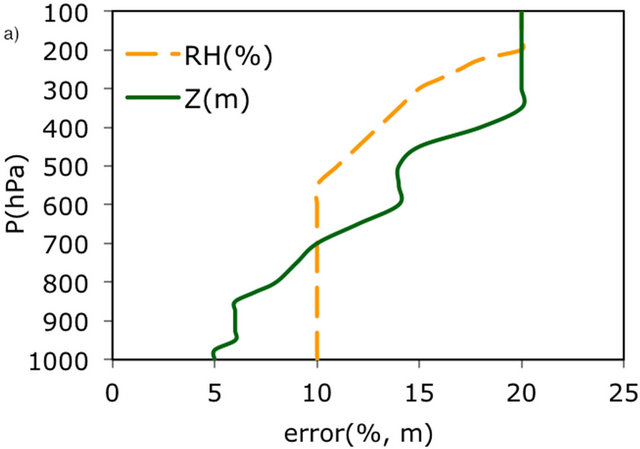
The Figure 7 shows the observational errors as a function of the pressure levels for the geopotential height and relative humidity (Figure 7(a)) and for the wind components and temperature (Figure 7(b)). All these errors were taken from the bibliography. In particular the errors for the wind components, relative humidity, and temperature were taken from Lazarus [3], while the error for the geopotential height is taken from Sashegyi [23].
The model error is assumed to be twice the observational error ( = 2.0
= 2.0 ) at all levels and for all parameters, i.e. measurements are assumed more reliable than the background. A planned improvement of the data assimilation system, which require the analysis of a longer period, is to compute the observational and model errors by the Lönnberg and Hollingsworth method [21, 24], which is based on the statistical properties of the model output and observations.
The length-scale d is determined by the NMC method and depends on the parameter and on the level. First the differences between two forecast states, verifying and the same time t, were computed:
 (A.1)
(A.1)
where T2 = 24 h and T1 = 12 h. The difference in (A.1) was computed considering all the days of August 2008. In particular all the background runs of 00 UTC lasted 24 h and the fields at the end of each simulation was used in (A.1) as xT2. Similarly, the fields at the end of each 12 UTC background simulation were used in (A.1) as xT1.
In Equation (A.1) i, j, k, and t show the dependence on the x, y, z, and time dimensions. For a fixed level and time, the average of x' is computed and subtracted to x', obtaining the variable n(i, j, t). Then the covariance of the n(i, j, t) variable is computed over all the simulations as a function of the distance obtaining the new variable cov(i, j, i', j'). This covariance is binned as a function of the distance between the points i, j and i', j' obtaining the variable B(r), where r is the distance between the gridpoints i, j and i', j'. Finally, assuming a Gaussian form for the correlation, an estimate of the length-scale d is made taking the natural logarithm of the Gaussian and fitting the data to a straight-line y = mr + c:
 (A.2)
(A.2)
and finally d=1/m.
Figure 6 shows that the length-scales for all the parameters. The length-scales for the geopotential height are the largest, i.e. the error correlation decreases more slowly with the horizontal distance, and varies between 250 and 350 km, depending on the level. As expected, the length-scales for the zonal and meridional wind components are similar and vary between 120 and 160 km. The length-scale for the relative humidity is the smallest with values ranging from 50 km (below 900 hPa) to 140 km (between 450 and 300 hPa). The length-scale for the temperature increases with height from 100 km, below 950 hPa, to 260 km, at 400 - 350 hPa.
With the exception of the geopotential height, all the length-scales increase with height. This result is expected because the interaction between the atmosphere and the orography generates features at the mesoscale, which are smaller than the synoptic-scale features of the middle and upper troposphere.
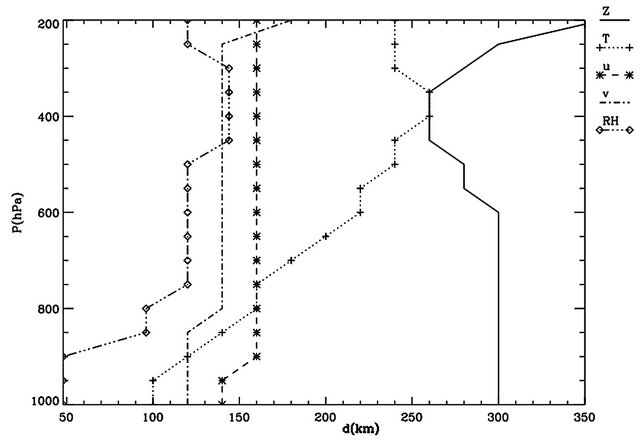
Figure 6. Length-scales of the different parameters as a function of the pressure level. Z is for the geopotential height, T is for the temperature, u is for the zonal velocity, v is for the meridional velocity, and RH is for the relative humidity.
 (a)
(a)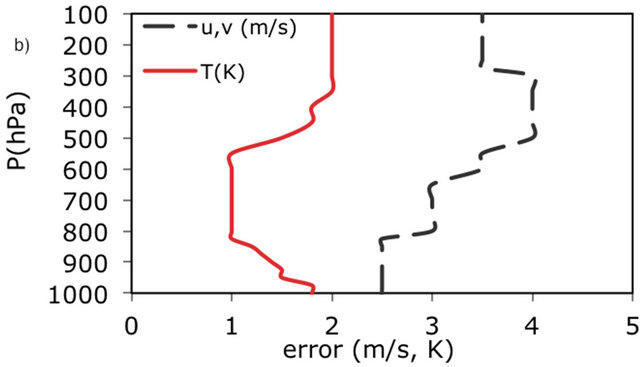 (b)
(b)
Figure 7. (a) Observational errors for the geopotential height and relative humidity. Both parameters share the same x-axis scale (m for geopotential height and % for relative humidity); (b) as in (a) for the zonal and meridional wind components and for temperature. The error for the two wind components is the same. The wind components and temperature share the same x-axis scale (m/s for wind and K for temperature).
NOTES
1The period of August 2008 was selected in this study for data availability.
2Even if its vertical resolution of the analysis grid is increased from 50 hPa to 25 hPa, the spacing of the analysis levels is about 1000 m above 350 hPa.