Journal of Diabetes Mellitus
Vol.2 No.2(2012), Article ID:19351,6 pages DOI:10.4236/jdm.2012.22033
Study of markers of atherosclerosis including insulin resistance in patients with chronic renal failure
![]()
1Postgraduate Department of Medicine, Sriram Chandra Bhanj Medical College, Cuttack, India; *Corresponding Author: drsidhartha.cuttack@gmail.com
2Department of Nephrology, Sriram Chandra Bhanj Medical College, Cuttack, India
Received 16 February 2012; revised 15 March 2012; accepted 29 April 2012
Keywords: CKD; CRF; CrCl; Atherosclerosis; HOMA-IR; HOMA-B; CRP; CIMT
ABSTRACT
Objectives: The present study was designed to assess the markers of atherosclerosis including Insulin resistance (IR) in naïve patients with chronic renal failure (CRF). Methods: Eighty consecutive naïve patients with CRF were taken up for study. They were divided into non-diabetic group, Group A (N = 50) and diabetic group, Group B (N = 30). Twenty healthy individuals were taken as controls, Group C (N = 20). Patients undergoing renal replacement therapy, having chronic liver disease and with concomitant acute or chronic infection were excluded from the study. Routine hemogram, fasting plasma glucose, fasting serum insulin, lipid profile, renal function tests, C-reactive protein (CRP), serum uric acid levels, ultrasound of abdomen and ultrasound B scan for carotid intima medial thickness (CIMT) were done for all patients and control. The data collected were analyzed to inter-correlate the parameters using SPSS 16. Results: On comparing parameters between the three groups, values of HOMA-IR, CRP, uric acid, VLDL and CIMT were significantly higher in Groups A and B than Group C whereas values of HOMA-B, HDL and LDL were lower in both groups A and Bas compared to group C. HOMA-IR had significant negative correlation with creatinine clearance (Crcl) (r = −0.449, p = 0.01) in Group A and (r = −0.483, p = 0.007) in Group B. HOMA-IR had significant positive correlation with CIMT (r = 0.413, p = 0.03) in Group A and (r = 0.581, p = 0.001) in Group B. Crcl had significant negative correlation with CIMT(r = −0.375, p = 0.007) in Group A and (r = −0.705, p = 0.001) in Group B. Crclnegatively correlated with C-reactive protein (r = −0.460, p = 0.001) in Group A and (r = 0.431, p = 0.01) in Group B. HOMA-B positively correlated with Crcl (r = 0.667, p = 0.001) and also with CIMT (r = −0.531, p = 0.003) among Group B individuals. Conclusion: There is a significant increase in insulin resistance (IR) and β cell dysfunction in patients with CRF. Also IR linearly increases with reduction in renal function. CRP and uric acid are also significantly increased, reflecting the existence of a chronic inflammatory milieu in these patients. All these factors contribute to accelerated atherosclerosis, signifying CRF per se is independent risk factor for atherosclerosis.
1. INTRODUCTION
Chronic Kidney Disease (CKD) encompasses a spectrum of different pathophysiologic processes associated with abnormal kidney function and a progressive decline in GFR [1]. The term Chronic Renal Failure (CRF) applies to the process of continuing significant irreversible reduction in nephron number and typically corresponds to Stage 3 to Stage 5 of CKD [1]. Cardiovascular disease is the leading cause of morbidity and mortality in patients at every stage of CKD [2]. The presence of any stage of CKD is a major risk factor for ischemic cardiovascular disease, including occlusive coronary, cerebrovascular and peripheral vascular disease. The prevalence of dyslipidemia in patients with CKD is greater than in the general population, the disorder of lipoprotein metabolism increase in frequency and severity as renal insufficiency advances [3]. Peripheral resistance to insulin is seen even in patients with early stages of CKD. This abnormality is clinically important because it is positively correlateswith enhanced cardiovascular risk and to the rate of progression of CKD [4]. CRP is an acute phase reactant and a marker for inflammation. It has also become recognized as important link in the development of atheroma in CKD [2].
2. MATERIALS
The present study was done on 80 consecutive naïve patients who had CRF admitted to the medicine/nephrology wards of S.C.B. Medical College and Hospital, Cuttack during the period of 2009-2012. It included adult patients of all age groups and both genders who were naive patients with chronic renal failure (estimated GFR < 60 ml/min per 1.73 m2). Patients with CRF who had undergone dialysis or transplant, who had a concomitant acute or chronic infection, with chronic liver disease, immunocompromised patients, HBSAg, HCV positive patients were excluded from the study.
3. METHODS
Patients were evaluated for history of angina, cerebrovascular accident, peripheral artery disease and clinically examined for presence of pallor, edemaand hypertensionalong with detailed systemic examination. Laboratory investigations done were routine hemogram done by five part automated cell counter (Sysmex XT 2000i), urine for routine and microscopic examination, blood glucose, serum urea, uric acid and creatinine were done using automated analyzer (SelectrasPro M). Serum insulin was estimated using automated analyzer (Elecsys 2010, Roche, Hitachi) Serum C-reactive protein estimation was done using an automated analyzer (Biolis 24i, Tokyo Boeki Medical System) Radiological investigations namely, ultrasonography of abdomen and pelvis and ultrasound B scan for carotid intima medial thickness
(Siemens) were done. The data collected were tabulated and analyzed using SPSS software (version 16) by using Pearson’s correlation, bivariate analysisand the means and standard deviations of different groups were compared using two-tailed tests.
(Homeostatic Model for Assessment of Insulin Resistance)
HOMA-IR = fasting serum insulin (µU/ml) × fasting plasma glucose (mg/dl) [5]
405
(Homeostatic Model for Assessment of β cell function)
HOMA-B = 360 × fasting serum insulin (µU/ml) [5]
Fasting plasma glucose (mg/dl)-63
4. OBSERVATIONS
The age of the patients studied ranged from 20 - 90 years Mean age in Group A was 51.8 ± 13.6 years, in Group B was 51.6 ± 14.4 years and in Group C was 50.9 ± 18.2 years. Comparison of mean and standard deviations of various parameters of the three groups and statistical significance are summarized in the Table 1. The results of statistical analysis to deduce Pearson’s correlation coefficient between various parameters are represented in Tables 2 and 3. The study revealed a significant negative correlation between Crcl and HOMA-IR in both Group A (r = −0.449, p = 0.01) and Group B (r = −0.483, p = 0.007) as represented in Figures 1 and 2. Crcl had significant negative correlation with CIMT in both Group A (r = −0.375, p = 0.007) and Group B (r = −0.705, p = 0.0001) as depicted in Figures 3 and 4. Crcl also correlated negatively with CRP in both Group A (r = −0.460, p = 0.01) and Group B (r = −0.431, p = 0.01). In Group A HOMA-IR had positive correlation with CIMT (r
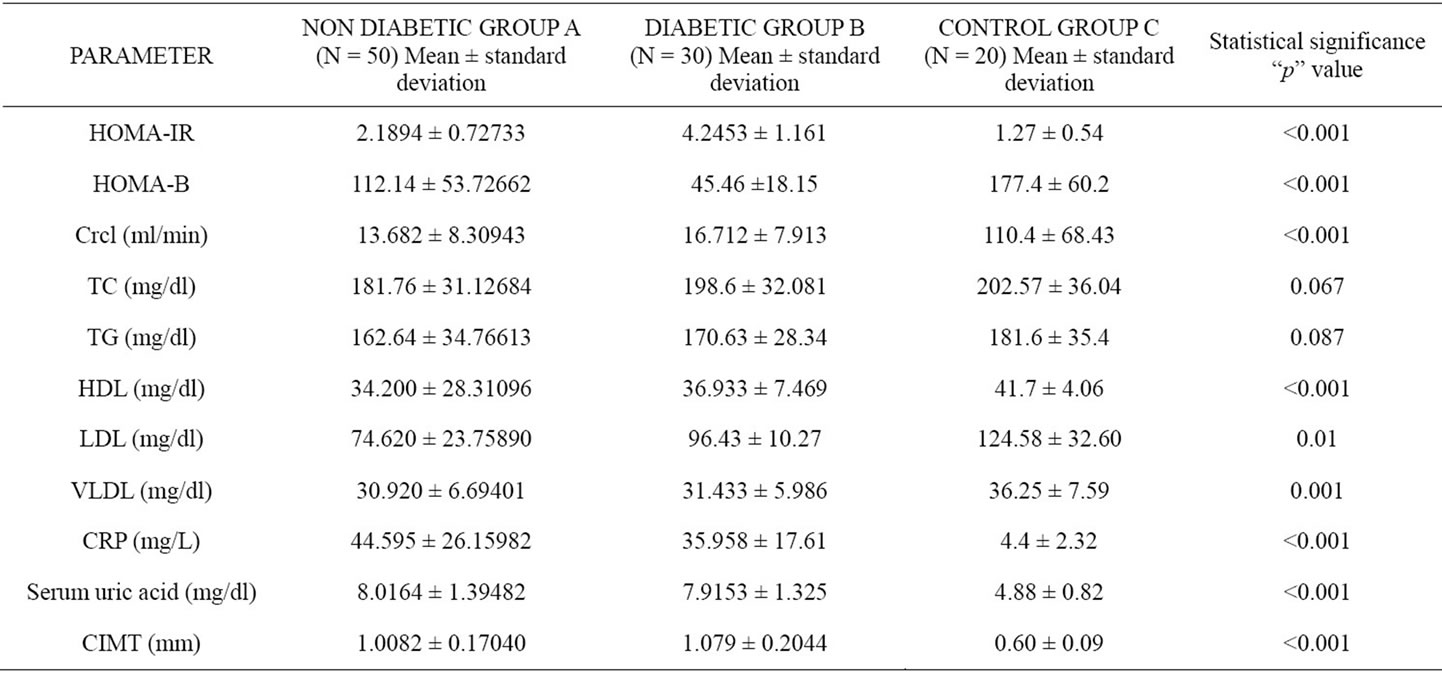
Table 1. Comparison of mean and standard deviation of parameters in the three groups and their statistical significance.
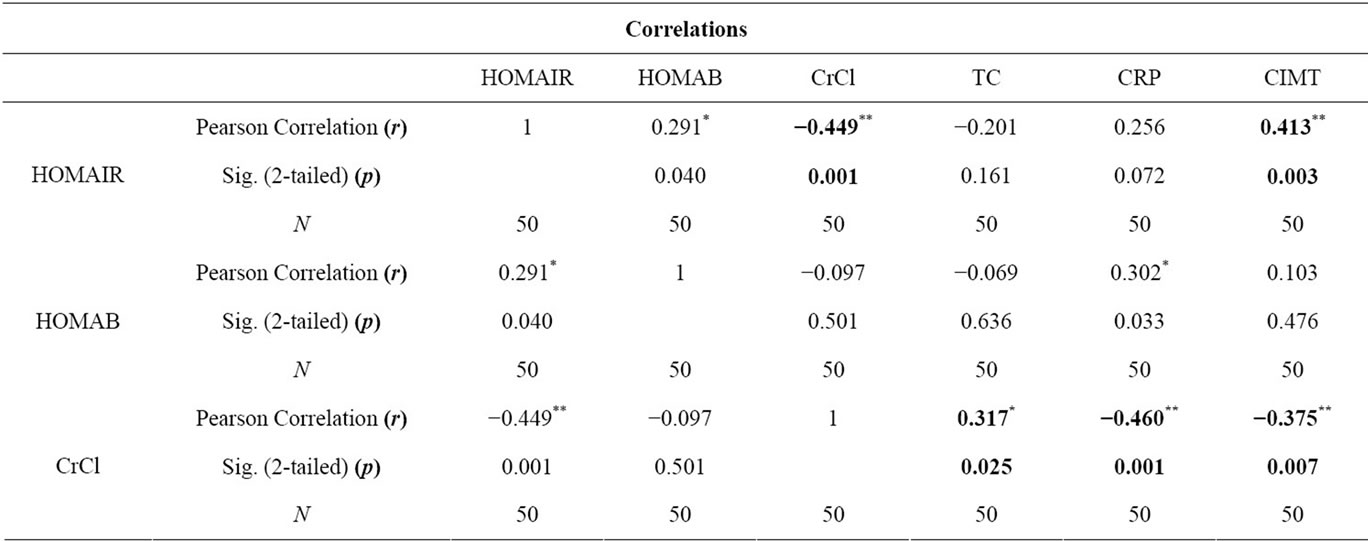
Table 2. Correlation of parameters in Group A.
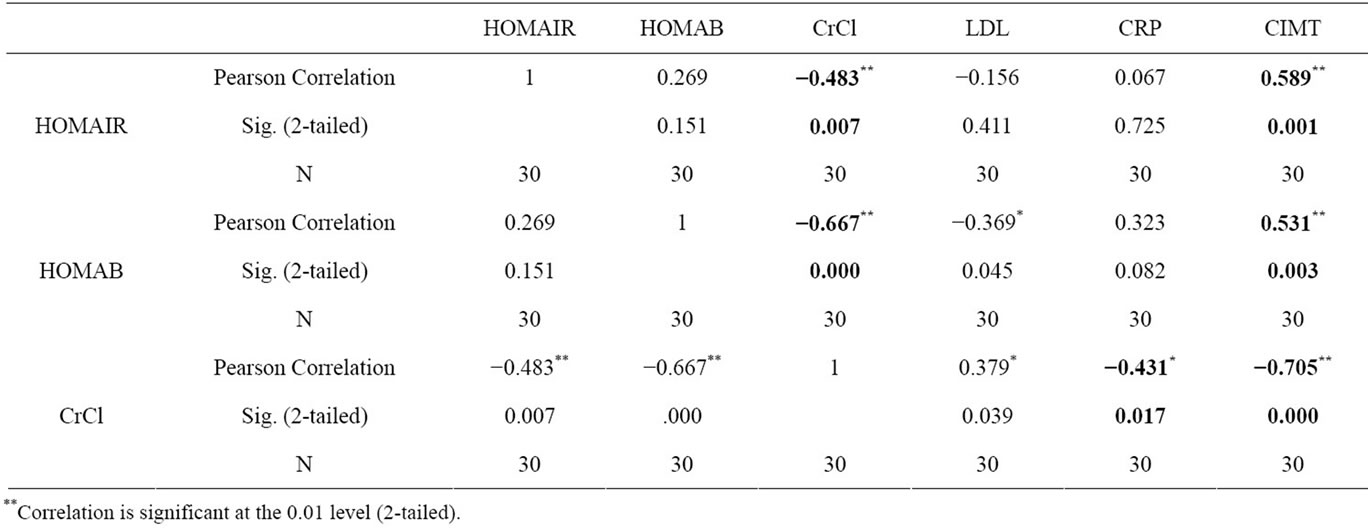
Table 3. Correlation of parameters in Group B.
= 0.413, p = 0.003), and also in Group B (r = 0.589, p = 0.01). In Group B, HOMA-B had significant negative correlation with Crcl (r = 0.667, p = 0.0001) and CIMT (r = −0.531, p = 0.003). Crcl positively correlated with total plasma cholesterol in Group A (r = 0.317, p = 0.02), but with LDL levels in Group B (r = 0.379, p = 0.03) only. CRP had significant positive correlation with CIMT in Group A (r = 0.342, p = 0.01).
5. DISCUSSION
Eighty consecutive previously untreated patients with chronic renal failure were taken up for study. They were divided into a Group A and Group B. Twenty healthy age matched individuals were taken as controls, Group C. Mean age in Group A, Group B and Group C were comparable. 74% of Group A subjects were in the age Group 40 - 70 where as 71% of Group B subjects were in the age group 50 - 80. Presentation of CRF was a decade earlier in Group A subjects, as these individuals harbor primary renal disease. Majority of individuals in Group B were suffering from Type 2 diabetes mellitus. Nephropathy begins to develop about 10years after the onset of Type 2 DM, and it takes much more time to progress to CRF [1]. This explains why CRF occurs a decade later among diabetics when compared to the non-diabetics.
Mean Crcl in Group A was 13.682 ± 8.30943, in Group B was 16.712 ± 7.913 and in Group C was 110.4 ± 68.43 respectively. In Group A, mean HOMA-IR was 2.1894 ± 0.72733, in Group B was 4.2453 ± 1.161 and in Group C was 1.27 ± 0.54. HOMA-IR was significantly higher in both Group A and Group B than Group C (p < 0.0001). CKD even without diabetes mellitus is associated with significantly high IR. Jing Chen et al. and Kobayashi et al. from US reported a high prevalence of IR among CKD patients [6,7]. Our study revealed similar results in Asian Indian population. Mean HOMA-B value
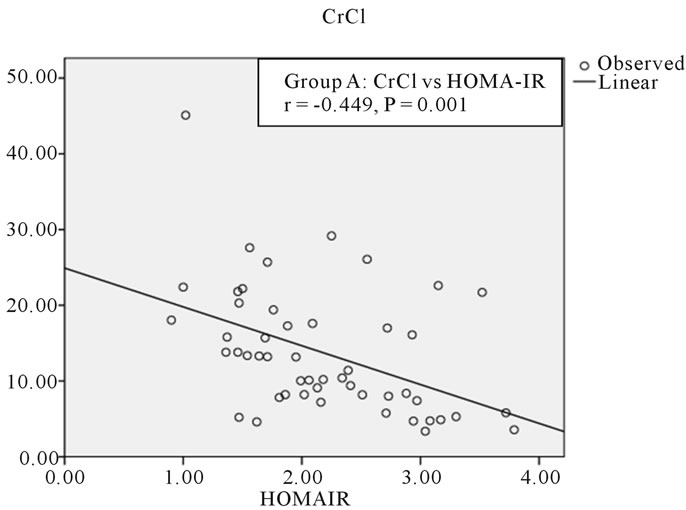
Figure 1. Correlation between CrCl and HOMA-IR in group A.
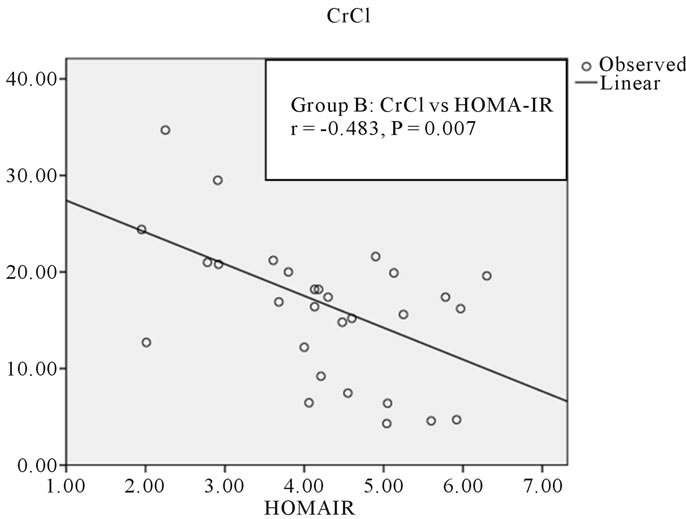
Figure 2. Correlation between CrCl and HOMA-IR in Group B.

Figure 3. Correlation between CrCl and CIMT in Group A.
in Group A was 112.14 ± 53.72, in Group B was 45.46 ± 18.15 and in Group C was 177.40 ± 60.2 respectively. So both Group A and Group B had significantly lower

Figure 4. Correlation between CrCl and CIMT in Group B.
HOMA-B values than Group C (p < 0.001). So patients with CRF had significant β cell dysfunction when compared to controls irrespective of their diabetic status. However β cell dysfunction was higher in diabetics than in non-diabetics. Insulin secretion is impaired in a substantial segment of CKD patients as uremia exerts an inhibitory effect over insulin secretion by β cells [3].
Both Group A and Group B had a significantly lower HDL levels when compared to Group C (p < 0.001). LDL levels were also lower in patients in Group A and B when compared to Group C (p = 0.001). VLDL levels were higher in both groups A and B than Group C (p = 0.001). The difference in the total cholesterol and triglyceride levels were not statistically significant. Therefore our study reveals normal total plasma cholesterol and triglycerides but reduced HDL cholesterol, normal LDL cholesterol and raised VLDL levels among CKD patients. According to Eberhard Ritz et al. “the most frequent constellation of lipid abnormalities in CKD comprises a decrease in HDL-cholesterol, an increase in VLDL and IDL cholesterol, normal LDL and total cholesterol levels and moderately raised triglycerides. LDL cholesterol may be even low reflecting redistribution of cholesterol from HDL to VLDL and IDL cholesterol” [3]. The results of the current study are comparable to those published by Aleix Cases and E. Col [8].
Mean CRP levels were significantly higher in Group A and Group B when compared to Group C (p < 0.001). CRP levels were significantly higher in CRF patients reflecting the existence of chronic inflammatory milieu in these patients. Vandanamenon et al. had found significantly high CRP levels in CKD patients with mean CRP levels 60 mg/L and positively correlated with cardiovascular morbidity and mortality. Mean CRP levels among CKD patients in MDRD (modified diet in renal disease) study was 23 mg/L [9]. Observations of high CRP levels in our CKD patients are at par with that published among other patient population.
Mean uric acid levels were significantly higher in Group A and Group B when compared to Group C (p < 0.001). Magdalena Madero et al. published similar results with high uric acid levels among CKD patients and had positively correlated with cardiovascular morbidity and mortality [10]. Results obtained in our study are highly consistent with these studies.
Mean CIMT was significantly higher in Group A and Group B when compared to Group C (p < 0.001). High CIMT values strongly suggest atherosclerosis, signifying CRF as an atherogenic state. Cheuk-Chun Szeto et al. had found high CIMT levels among CKD patients and positively correlated with CRP levels and cardiovascular events [11]. Similar results were revealed in our study.
On statistical analysis Crcl had statistically significant negative correlation with HOMA-IR in both Group A (r = −0.449, p = 0.01) and Group B (r = −0.483, p = 0.007). There was a linear increase in IR with the reduction in renal function, as depicted in Figures 1 and 2. Hence IR is significantly high in patients with CKD and significantly correlates with reduction in renal function. Kobayashi et al. from US reported the existence of a linear relationship between IR and Crcl among CKD patients [7]. Observations in the current study are consistent with this study.
Crcl has significant negative correlation with CIMT in both Group A (r = −0.375, p = 0.007) and Group B (r = −0.705, p = 0.0001), as depicted in Figures 3 and 4. This indicates that CKD, even without diabetes mellitus predisposes for accelerated atherosclerosis suggesting compromised renal function as an independent risk factor for atherosclerosis. Cheuk-Chun Szeto et al. reported that CIMT values were significantly raised among predialysis non-diabetic CKD patients and also had tight correlation with cardiovascular events [11].
There was a tight negative correlation between Crcl and CRP in both Group A (r = −0.460 p = 0.01) and Group B (r = −0.431, p = 0.01). CRP had significant positive correlation with CIMT in Group A (r = 0.342, p = 0.01). The Jackson Heart study among African-Americans by Ervin R. Fox et al. found a tight negative correlation between GFR and CRP and concluded that CRP levels were significantly raised in CKD patients and was associated with a high incidence of cardiovascular events. Our results are highly consistent with these studies [12].
HOMA-IR positively correlated with CIMT in both Group A (r = 0.413, p = 0.003) and Group B (r = 0.589, p = 0.01). IR was associated with significantly high incidence of atherosclerosis. S. Das et al. reported that IR significantly increases the incidence of atherosclerosis. When IR is present in conjunction with Type 2 Diabetes mellitus, the chance of developing coronary artery disease strikingly increases [13]. Similar results were obtained in our study.
Among Group B individuals, HOMA-B values had statistically significant positive correlation with Crcl (r = 0.667, p = 0.0001) and negative correlation with CIMT (r = −0.531, p = 0.003). This suggests that the beta cell dysfunction increases as the renal function deteriorates and also significantly contributes to accelerated atherosclerosis especially among diabetic CKD patients. Similar results are reported by other investigators [4].
Crcl positively correlated with total plasma cholesterol levels among Group A patients (r = 0.317, p = 0.02), whereas with LDL levels in Group B (r = 0.379, p = 0.03). This is also represented in graphs 9 and 11. Dyslipidemia occurs more frequently in CKD patients and the severity increases as the renal function deteriorates. Aleix Cases and Elizabet Col reported similar results. Similar observations are duly published in literature [8].
Our study revealed that patients with CKD are associated with significantly high IR and beta cell dysfunction, dyslipidemia, raised CRP and uric acid levels and significantly increased CIMT, all contributing to accelerated atherosclerosis in these individuals. IR and beta cell dysfunction linearly increase with reduction in renal function and is tightly correlated with increased CIMT reflecting a high incidence of atherosclerosis in these individuals. Inflammatory markers like CRP and uric acid are raised in individuals with CKD indicating the existence of chronic inflammatory milieu. The levels of CRP and uric acid increase as the renal function deteriorates and contribute to accelerated atherosclerosis among CKD patients. CIMT which is the best noninvasive surrogate marker for the atherosclerotic status of blood vessels are significantly increased in CKD patients strongly suggesting CKD as an independent risk factor for atherosclerosis.
6. CONCLUSIONS
Comparison of various parameters between the three groups revealed that insulin resistance, β cell dysfunction, dyslipidemia, C-reactive protein, uric acid and carotid intima medial thickness were significantly higher among CKD patients than controls. Further, there was a greater degree of insulin resistance and β cell dysfunction in diabetics than non-diabetics.
Statistical analysis revealed that Crcl negatively correlated with HOMA-IR, CIMT, CRP (p = 0.001, p = 0.007, p = 0.001) respectively among non-diabetic CRF patients and (p = 0.007, p = 0.0001, p = 0.017) among diabetics respectively. Also Crcl positively correlated with total cholesterol in non-diabetics (p = 0.025) and with LDL in diabetics (0.036). HOMA-IR correlated positively with CIMT among both non-diabetics (p = 0.003) and diabetics (p = 0.001). Also CRP positively correlated with CIMT in non-diabetic CRF patients (p = 0.01).
CKD is an independent risk factor for the development of atherosclerosis and hence for cardiovascular disease. There is a significant increase in insulin resistance and β cell dysfunction and is closely associated with accelerated atherosclerosis in patients with CKD. CRP and uric acid levels are significantly raised, reflecting the existence of a chronic inflammatory milieu in CKD patients.
![]()
![]()
REFERENCES
- Bargman, J.M. and Skorecki, K. (2011) Chronic kidney disease. In: Longo, D., Fauci, A., Kasper, D., Hauser, S., Jameson, J. and Loscalzo, J., Eds., Harrison’s Principles of Internal Medicine, 18th Edition, McGraw Hill, New York, 2308-2321.
- McMahon, L.P. and Parfrey, P.S. (2008) Cardiovascular aspects of chronic kidney disease. In: Brenner, B.M. and Rector, F.C., Eds., The Kidney, 8th Edition, Saunders, Philadelphia, 1697-1727.
- Ritz, E., Adamczack, M. and Wiecek, A. Metabolic and Endocrine Dysfunctions in Uremia. In: Schrier, R.W., Ed., Diseases of the Kidney and Urinary Tract, 8th Edition, Lippincott Williams & Wilkins, Philadelphia, 96, 2502- 2538.
- Fadda, G.Z. and Massry, S.G. (1995) Glucose and insulin metabolism. Metabolism and endocrine disturbances in uremia. In: Massry, S.G. and Glassock, R.J., Eds., Massry and Glassok’s Textbook of Clinical Nephrology, Lippincott Williams & Wilkins, Philadelphia, 1390-1394.
- Matthews, D.R., Hosker, J.B., Rudenski, A.S., Naylor, B.A., Treacher, D.F. and Turner, R.C. (1985) Homeostasis model assessment: Insulin resistance and β-cell function from fasting plasma glucose and insulin concentrations in man. Diabetologia, 28, 412-419. doi:10.1007/BF00280883
- Chen, J., Muntner, P., Hamm, L.L., Fonseca, V., Batuman, V., Whelton, P.K. and He, J. (2003) Insulin resistance and risk of chronic kidney disease in nondiabetic US adults. Journal of the American Society of Nephrology, 14, 469- 477. doi:10.1097/01.ASN.0000046029.53933.09
- Kobayashi, S., Maesato, K., Moriya, H., Ohtake, T. and Ikeda, T. (2005) Insulin resistance in patients with chronic kidney disease. American Journal of Kidney Disease, 45, 275-280. doi:10.1053/j.ajkd.2004.09.034
- Cases, A. and Coll, E. (2005) Dyslipidemia and the progression of renal disease in chronic renal failure patients. Kidney International, 68, 87-93. doi:10.1111/j.1523-1755.2005.09916.x
- Menon, V. (2005) The epidemiology of chronic kidney disease, stages 1 to 4 and cardiovascular disease: A high risk combination. American Journal of Kidney Diease, 45, 223-232. doi:10.1053/j.ajkd.2004.09.022
- Madero, M., Sarnak, M.J., Wang, X.L., Greene, T., Beck, G.J., Kusek, J.W., Collins, A.J., Levey, A.S. and Menon, V. (2009) Uric acid and long-term outcomes in CKD. American Journal of Kidney Disease, 53, 796-803. doi:10.1053/j.ajkd.2008.12.021
- Szeto, C.-C., Chow, K.-M., Woo, K.-S., Chook, P., Kwan, B.C.H., Leung, C.-B. and Li, P.K.T. (2007) Carotid intima media thickness predicts cardiovascular diseases in Chinese predialysis patients with chronic kidney disease. Journal of the American Society of Nephrology, 18, 1966- 1972
- Fox, E.R., Benjamin, E.J., Sarpong, D.F., Nagarajarao, H., Taylor, J.K., Steffes, M.W. and Salahudeen, A.K. (2010) The relation of C-reactive protein to chronic kidney disease in African Americans: The Jackson heart study. BMC Nephrology, 11.
- Das, S., Dash, G.K., Behera, M., Routray, S.N., Minz, N.T. and Pattnaik, M. (2007) Prevalence of metabolic syndrome in angiographically established coronary artery disease patients. South Asian Journal of Preventive Cardiology, 11, 93-100.