Journal of Behavioral and Brain Science
Vol.2 No.3(2012), Article ID:22094,4 pages DOI:10.4236/jbbs.2012.23040
Increased Cortical Thickness in Male-to-Female Transsexualism
1Laboratory of Neuro Imaging, Department of Neurology, UCLA School of Medicine, Los Angeles, USA
2Center for Society & Genetics, Department of Human Genetics, UCLA School of Medicine, Los Angeles, USA
3Center for Imaging Neurodegenerative Diseases, US Department of Veterans Affairs, Washington DC, USA
4Department of Psychiatry, University of Jena, Jena, Germany
Email: evilain@ucla.edu
Received July 15, 2011; revised September 13, 2011; accepted October 13, 2011
Keywords: Brain; Cortex; Gender Identity Disorder; MRI; Transgender; Gender Dysphoria; Gender Incongruence; Gender Nonconformity
ABSTRACT
Background: The degree to which one identifies as male or female has a profound impact on one’s life. Yet, there is a limited understanding of what contributes to this important characteristic termed gender identity. In order to reveal factors influencing gender identity, studies have focused on people who report strong feelings of being the opposite sex, such as male-to-female (MTF) transsexuals. Method: To investigate potential neuroanatomical variations associated with transsexualism, we compared the regional thickness of the cerebral cortex between 24 MTF transsexuals who had not yet been treated with cross-sex hormones and 24 age-matched control males. Results: Results revealed thicker cortices in MTF transsexuals, both within regions of the left hemisphere (i.e., frontal and orbito-frontal cortex, central sulcus, perisylvian regions, paracentral gyrus) and right hemisphere (i.e., pre-/post-central gyrus, parietal cortex, temporal cortex, precuneus, fusiform, lingual, and orbito-frontal gyrus). Conclusion: These findings provide further evidence that brain anatomy is associated with gender identity, where measures in MTF transsexuals appear to be shifted away from gender-congruent men.
1. Introduction
The underlying neuroanatomical correlates of gender identity (whether one thinks of oneself as a man or as a woman) have been investigated in only a limited number of structural studies. The majority of these studies compared particular regions of interest (ROI) in male-to-female (MTF) transsexuals with gender-congruent men and women [1-4]. However, traditional ROI studies cannot characterize group-related differences beyond any region defined a priori, and possible group differences in other areas might be overlooked.
Thus, more recent studies used fully-automated voxelby-voxel analysis techniques that allow for investigations across the entire brain while avoiding the subjectivity of ROI approaches as user bias is minimized. Nevertheless, existing voxel-wise studies are sparse, and outcomes are not fully comparable as they differ both with respect to the anatomical substrate and the sample examined. For example, Rametti et al. [5] reported that white matter fiber structure in female-to-male (FTM) transsexuals is more similar to the pattern observed in men (i.e., in subjects sharing gender identity) than in women. Our own study [6] revealed that regional gray matter characteristics in MTF transsexuals are more similar to the pattern found in men (i.e., in subjects sharing biological sex) than in women. However, we also noticed that brain characteristics in MTF transsexuals and in control men were not fully identical, and MTF transsexuals had significantly more gray matter in the putamen, especially in the right hemisphere [6].
To explore the possibility that there are additional neuroanatomical differences between MTF transsexuals and control men, we applied another fully automated whole-brain approach to compare the thickness of the cortex across the lateral and medial brain cortical surfaces at thousands of surface points. The cerebral cortex contains approximately 80% of the neurons of the central nervous system and contributes largely to factors such as social awareness, attitudes, and decision-making [7]. Given the immediate relevance of these factors in association with transsexualism, we expected cortical alterations in MTF transsexuals compared to control men. Importantly, to exclude possible confounding impacts of sex steroid hormones on brain structure [8], the MTF transsexual sample was restricted to individuals who had not been treated with sex hormones.
2. Methods
2.1. Participants
Twenty-four MTF transsexuals were recruited through fliers provided to local transsexual community organizations and to professionals who offer services to the transsexual community. Twenty-four men for the control group were selected from the International Consortium for Brain Mapping (ICBM) database of normal adults and matched for age. Age ranged between 23 and 72 years (mean [SD] age of transsexuals: 45.7 [13.8] years; mean [SD] age of males: 45.9 [13.7] years). Handedness in all participants was determined based on self-reports of hand preference for selected activities. Transsexual participants were 76% dextral while control men were 96% dextral; however this was not statistically significant (p = 0.097, Fisher’s Exact Test).
For study inclusion, transsexual participants needed to self-identify as a MTF transsexual, report no history of hormonal treatment, and declare the intention of undergoing estrogen replacement therapy. MTF transsexuals were evaluated to be free of psychosis according to a standardized diagnostic interview [9] and confirmed to be genetic males, as defined by the presence of the SRY gene in their genome [10]. All subjects of the control group also had to pass a physical and neurological screening examination performed by a neurologist [11]. While sexual orientation data were not available for the male controls, 6 transsexual participants reported being sexually attracted to men and 18 reported being sexually attracted to women. All participants gave informed consent according to institutional guidelines (Institutional Review Board of the University of Los Angeles, California [UCLA]).
2.2. Image Acquisition
Brain image data were acquired on a 1.5-T scanner (Siemens Sonata) using a 3D T1-weighted sequence (MPRAGE) with the following parameters: TR = 1900 ms; TE = 4.38 ms; flip angle = 15˚; 160 contiguous 1 mm sagittal slices; FOV = 256 mm × 256 mm; matrix size = 256 × 256, voxel size = 1.0 × 1.0 × 1.0 mm.
2.3. Image Preprocessing
Brain images were processed using automated software to remove skull, scalp, and other extra-meningeal tissues and to correct for intensity non-uniformity [12]. Image voxels were then classified according to tissue type, as detailed elsewhere [13]. Briefly, intensity-based and atlas-based information were combined to yield fuzzy membership function image volumes representing the fractions of cortical gray matter (GM), cerebral white matter (WM), sulcal cerebrospinal fluid (CSF), subcortical GM, cerebellar GM, cerebellar WM, ventricles, and brainstem within each image voxel. The cerebral WM membership function was further processed to fill the ventricles and subcortical GM structures (e.g., putamen, thalamus, and the caudate nucleus) with WM. To compensate for partial volume effects in thin sulcal regions, the cerebral GM membership function was automatically enhanced by creating thin (artificial) CSF separations within sulci [14].
Subsequently, the inner cortical surface (i.e., a surface representation that lies at the interface of WM and cortical GM) was generated [15]. This served as an initial surface for reconstructing the central cortical surface (i.e., a surface that resides in between the inner cortical surface and outer pial surface). More specifically, the central cortical surface was reconstructed by driving a topology-preserving geometric deformable surface model [15] toward the geometric center of the GM using a gradient vector flow derived from the enhanced GM membership function [16]. Each reconstructed central surface was a triangle mesh comprising approximately 300,000 vertices. The central cortical surface representation and the enhanced GM membership function image volumes were used as the starting points for the subsequent cortical thickness analysis, as described below.
2.4. Estimation of Cortical Thickness
The cortical GM is bounded by the CSF on the outside and by the WM on the inside. Cortical thickness at each point in the cortical GM is defined as the sum of the distances from that point to the GM/WM and GM/CSF tissue boundaries following a flow field that guarantees a one-to-one, symmetric, and continuous correspondence between the two tissue boundaries. The flow field with these properties was computed by solving Laplace’s equation with cortical GM as its domain [17]. Cortical thickness was estimated in millimeters at 3D image voxels on the GM tissue sheet and mapped onto the central cortical surface using trilinear interpolation at each vertex point.
To establish the spatial correspondence between homologous surface locations across participants, the central cortical surface model of each participant was spatially normalized to the geometry of a representative reference brain, the colin27 average [18], as detailed elsewhere [19]. Briefly, the central cortical surfaces were unfolded to a spherical shape using surface partial flattening and conformal mapping. Of note, this was done for left and right hemispheres separately, yielding a map of each cortical hemisphere onto its own unit sphere [20]. Anatomical correspondence between mesh nodes on the hemispheres of the subject brain and the reference brain were established by calculating a geometry-driven optical flow field which provides a dense representation of the displacement that is required to warp one cortex so that it best matches the other in the spherical coordinate system. As a result, individual thickness measures from homologous surface locations can be mapped onto the reference surface. Finally, independent sample Student’s t-tests were performed at each vertex point to compare cortical thickness between MTF transsexuals and control males. Statistical outcomes were corrected for multiple comparisons, using false discovery rate [21] thresholded at q = 0.05.
3. Results
As demonstrated in Figure 1, mean values of cortical thickness appear to be higher in several cortical regions in MTF transsexuals compared to control men (left panel). This visual impression was statistically confirmed both on the lateral and medial aspect of the cortical surface (right panel). More specifically, we detected a significantly thicker cortex in MTF transsexuals in the left hemisphere in the orbito-frontal cortex, the middle frontal gyrus, in the vicinity of the central sulcus (near midline), in perisylvian regions (close to the post central gyrus), as well as within the paracentral gyrus and orbito-frontal gyrus (medial surface). A significantly thicker cortex in MTF transsexuals in the right hemisphere was observed along the post and pre central gyrus (expanding into middle frontal regions), the parietal cortex (near midline), the superior temporal sulcus, the inferior temporal gyrus, as well as within the orbito-frontal, fusiform, and lingual gyrus, and the precuneus (medial surface). We did not detect any cortical region showing significantly increased cortical thickness values in control men compared to MTF transsexuals.
4. Discussion
When comparing the 24 MTF transsexuals and the 24 age-matched control men, we revealed thicker cortices in MTF transsexuals in a number of regions across the lateral and medial cortical surfaces, while there was no region where control men showed an increased cortical thickness compared to MTF transsexuals.
To our knowledge, this is the first study investigating cortical thickness as a possible underlying substrate associated with MTF transsexualism. Thus, comparable data do not exist. However, the thicker cortices in MTF transsexuals compared to control men (observed here) resemble the direction of previously reported gendertypical pattern among non-transsexuals, such as thicker cortices in women than in men [22-25]. Further-more, our findings are consistent with three post mortem studies that found atypical measurements in MTF trans-sexuals with respect to the size of the central subdivision of the bed nucleus of the stria terminalis (BSTc) [3]; the number of neurons in the BSTc [4], as well as the volume and neuronal densities of the interstitial nucleus of the anterior hypothalamus [INAH3; 1]. In addition, our
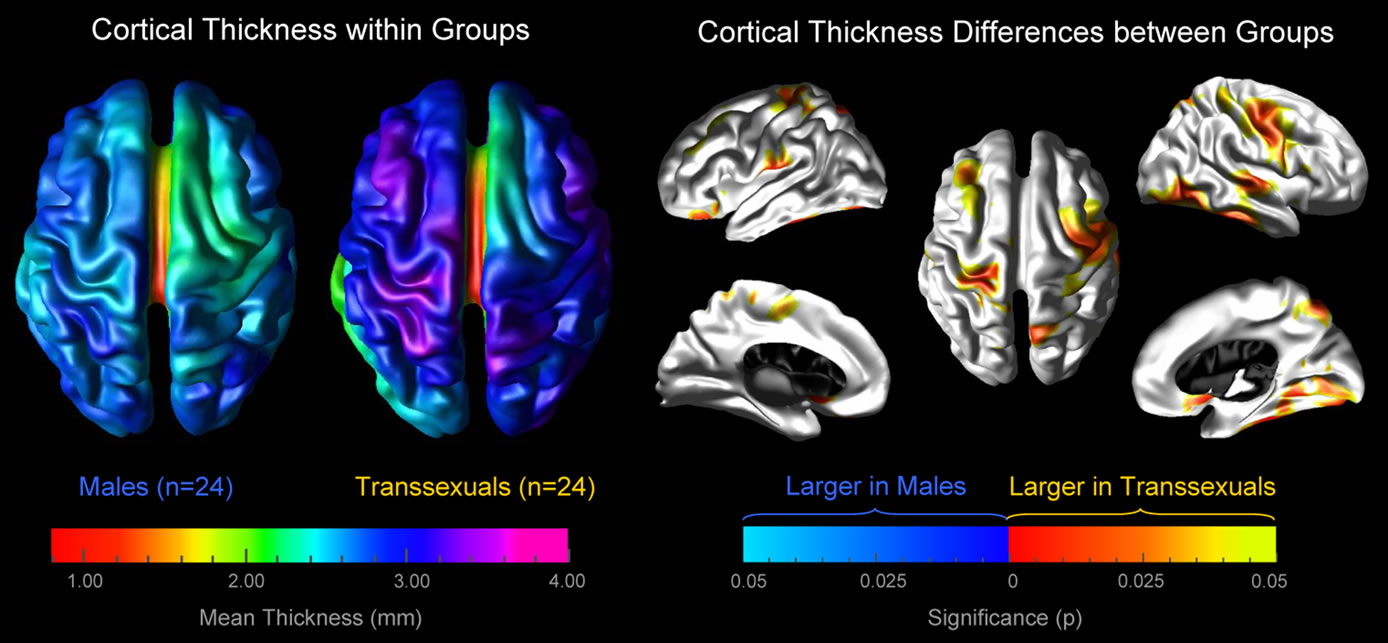
Figure 1. Increased cortical thickness in MTF transsexuals. Left panel: the brain maps illustrate the mean cortical thickness within MTF transsexuals and within control men, separately. The brain surfaces are color-coded according to the color bar where thickness is shown in millimeters (mm). Right panel: the brain maps illustrate where the cortex is significantly thicker in MTF transsexuals than in control men. The brain surfaces are color-coded according to FDR-corrected significance. Gray color indicates regions where both groups did not differ significantly. Callosal, subcallosal, and midbrain regions have been excluded on the medial aspects of the surface.
current findings of significantly thicker cortices in MTF transsexuals than in control men correspond with previous in vivo outcomes revealing that MTF transsexuals show significantly larger gray matter volumes than control men [6].
These earlier observations in subcortical regions (i.e., BSTc, INAH3, and putamen) could not be replicated within the current study as the applied approach addresses features of the cerebral cortex (not subcortex). Nevertheless, it appears rather surprising that the previous whole-brain approach analysing gray matter (Luders et al. 2009) did not detect any group differences in cortical regions (e.g., the ones revealed in the current study directed at cortical thickness). It is possible, however, that these two anatomical measurements reflect slightly different aspects on a micro-anatomical level as also suggested by studies investigating direct correlations between cortical thickness and gray matter concentration [26]. Importantly, the current approach also provides an additional dimension of cortical morphology such as its thickness in millimeters, which is not directly captured by voxel-wise analyses of signal intensity changes throughout the brain (Luders et al., 2009).
Thicker cortices in MTF transsexuals are likely to have functional significance and possibly account for differences between MTF transsexuals and males in terms of thinking, feeling, and behavior. Interestingly, we also observed that group effects are more extended in the right hemisphere, which resembles and extends the outcomes from our previous study [6]. There, we had detected differences between MTF transsexuals and control men bilaterally in the putamen; however, group effects reached statistical significance only within the right putamen. Such structural asymmetries are also intriguing as they are likely to have functional implications, although reports on significant differences between transsexuals and controls with respect to functional lateralization are rather sparse [27]. Altogether, further research characterizing the relationships between cerebral micro-structure and macro-structure as well as brain function is clearly necessary before these regional structural differences (and any inherent hemispheric effects) can be precisely interpreted. Notwithstanding, the variety of regions that show significant associations with transsexualism already seem to support the theory that there may be a neural “system”, rather than a single nodal area, that determines or influences the different parameters of human sexuality [7].
While the current study offers some unique results, it is important to note its main limitation. The MTF transsexual participants were treated as a homogenous group. Studies have highlighted that MTF transsexuals of different sexual orientations (e.g., those attracted to men versus those attracted to women) may have different biological substrates that lead to their cross-sex identity [28,29]. Given that our sample size limited the statistical power to compare sub-groups based on their sexual orientation, future studies need to explore the possibilities that brain anatomy in MTF transsexuals varies depending on whether they are attracted to men, attracted to women, or attracted to both. Ideally, those studies will also include heterosexual/homosexual control men, matched to MTF transsexuals with respect to their sexual orientation.
5. Conclusion
Gender identity is a central and fundamental human characteristic that can influence people’s well-being [30]. Yet, there have only been a limited number of studies investigating brain-structural correlates of what contributes to people’s sense of gender. We observed thicker cortices in 24 MTF transsexuals compared to 24 agematched control men in a number of regions across the lateral and medial cortical surfaces. In order to precisely interpret these findings with respect to their functional significance further research addressing the relationship between cerebral microand macro-structures as well as brain function is clearly necessary. Nevertheless, the current study provides evidence that brain anatomy is associated with gender identity, where measures in MTF transsexuals appear to be shifted away from gendercongruent men.
6. Acknowledgements
This work was supported by the National Institutes of Health through the NIH Roadmap for Medical Research, grant U54 RR021813 entitled Center for Computational Biology (CCB). Additional support was provided by the NIH/NCRR resource grants P41 RR013642, RR12169, RR13642 and RR00865, Dr. Sanchez’s NIH training grant 5 T32 HD07228:26, and Dr. Gaser’s BMBF grant 01EV0709. This works was also supported by grants from the Human Brain Project P20-MHDA52176 and 5P01-EB001955, the National Institute of Biomedical Imaging and Bioengineering, National Institute of Mental Health, National Institute for Drug Abuse, National Cancer Institute and the National Institute for Neurologic Disease and Stroke. For generous support the authors also wish to thank the Brain Mapping Medical Research Organization, the Brain Mapping Support Foundation, the Pierson-Lovelace Foundation, the Ahmanson Foundation, the Tamkin Foundation, the William M. and Linda R. Dietel Philanthropic Fund at the Northern Piedmont Community Foundation, the Jennifer Jones-Simon Foundation, the Capital Group Companies Charitable Foundation, and the Robson Family and Northstar Fund.
REFERENCES
- A. Garcia-Falgueras and D. F. Swaab, “A Sex Difference in the Hypothalamic Uncinate Nucleus: Relationship to Gender Identity,” Brain, Vol. 131, No. 12, 2008, pp. 3132- 3146. doi:10.1093/brain/awn276
- L. E. Emory, D. H. Williams, C. M. Cole, E. G. Amparo and W. J. Meyer, “Anatomic Variation of the Corpus Callosum in Persons with Gender Dysphoria,” Archives of Sexual Behavior, Vol. 20, No. 4, 1991, pp. 409-417. doi:10.1007/BF01542620
- J. N. Zhou, M. A. Hofman, L. J. Gooren and D. F. Swaab, “A Sex Difference in the Human Brain and Its Relation to Transsexuality,” Nature, Vol. 378, No. 6552, 1995, pp. 68-70. doi:10.1038/378068a0
- F. P. Kruijver, J. N. Zhou, C. W. Pool, M. A. Hofman, L. J. Gooren and D. F. Swaab, “Male-to-Female Transsexuals Have Female Neuron Numbers in a Limbic Nucleus,” Journal of Clinical Endocrinology & Metabolism, Vol. 85, No. 5, 2000, pp. 2034-2041. doi:10.1210/jc.85.5.2034
- G. Rametti, B. Carrillo, E. Gómez-Gil, C. Junque, S. Segovia, A. Gomez, et al., “White Matter Microstructure in Female to Male Transsexuals before Cross-Sex Hormonal Treatment. A Diffusion Tensor Imaging Study,” Journal of Psychiatric Research, Vol. 45, No. 3, 2011, pp. 199- 204. doi:10.1016/j.jpsychires.2010.05.006
- E. Luders, F. J. Sánchez, C. Gaser, A. W. Toga, K. L. Narr, L. S. Hamilton, et al., “Regional Gray Matter Variation in Male-to-Female Transsexualism,” NeuroImage, Vol. 46, No. 4, 2009, pp. 904-907. doi:10.1016/j.neuroimage.2009.03.048
- J. Herbert, “Who Do We Think We Are? The Brain and Gender Identity,” Brain, Vol. 131, No. 12, 2008, pp. 3115- 3117. doi:10.1093/brain/awn257
- H. E. H. Pol, P. T. Cohen-Kettenis, N. E. M. Van Haren, J. S. Peper, R. G. H. Brans, W. Cahn, et al., “Changing Your Sex Changes Your Brain: Influences of Testosterone and Estrogen on Adult Human Brain Structure,” European Journal of Endocrinology, Vol. 155, No. S1, 2006, pp. S107-S114. doi:10.1530/eje.1.02248
- L. N. Robins, J. Wing, H. U. Wittchen, J. E. Helzer, T. F. Babor, J. Burke, et al., “The Composite International Diagnostic Interview: An Epidemiologic Instrument Suitable for Use in Conjunction with Different Diagnostic Systems and in Different Cultures,” Archives of General Psychiatry, Vol. 45, No. 12, 1988, pp. 1069-1077.
- B. K. Jordan, M. Jain, S. Natarajan, S. D. Frasier and E. Vilain, “Familial Mutation in the Testis-Determining Gene SRY shared by an XY Female and Her Normal Father,” Journal of Clinical Endocrinology & Metabolism, Vol. 87, No. 7, 2002, pp. 3428-3432. doi:10.1210/jc.87.7.3428
- J. C. Mazziotta, R. Woods, M. Iacoboni, N. Sicotte, K. Yaden, M. Tran, et al., “The Myth of the Normal, Average Human Brain—The ICBM Experience: (1) Subject Screening and Eligibility,” NeuroImage, Vol. 44, No. 3, pp. 914-922. doi:10.1016/j.neuroimage.2008.07.062
- D. W. Shattuck, S. R. Sandor-Leahy, K. A. Schaper, D. A. Rottenberg and R. M. Leahy, “Magnetic Resonance Image Tissue Classification Using a Partial Volume Model,” NeuroImage, Vol. 13, No. 5, 2001, pp. 856-876. doi:10.1006/nimg.2000.0730
- P. L. Bazin and D. L. Pham, “Statistical and Topological Atlas Based Brain Image Segmentation,” Proceedings of the 9th International Conference on Medical Image Computing and Computer Assisted Intervention, 2007, pp. 94-101.
- C. Xu, X. Han and J. L. Prince, “Improving Cortical Surface Reconstruction Accuracy Using an Anatomically Consistent Gray Matter Representation,” Proceedings of 6th International Conference on Functional Mapping of the Human Brain, Academic Press, San Diego, 2000, p. S581.
- X. Han, D. L. Pham, D. Tosun, M. E. Rettmann, C. Xu and J. L. Prince, “CRUISE: Cortical Reconstruction Using Implicit Surface Evolution,” NeuroImage, Vol. 23, No. 3, 2004, pp. 997-1012. doi: 10.1016/j.neuroimage.2004.06.043
- C. Xu and J. L. Prince, “Snakes, Shapes, and Gradient Vector Flow,” IEEE Transactions on Image Processing, Vol. 7, No. 3, pp. 359-369. doi:10.1109/83.661186
- D. Tosun, S. Duchesne, Y. Rolland, A. W. Toga, M. Verin and C. Barillot, “3-D Analysis of Cortical Morphometry in Differential Diagnosis of Parkinson’s Plus Syndromes: Mapping Frontal Lobe Cortical Atrophy in Progressive Supranuclear Palsy Patients,” Medical Image Computing & Computer-Assisted Intervention, Vol. 10, No. 2, 2007, pp. 891-899. doi: 10.1007/978-3-540-75759-7_108
- C. J. Holmes, R. Hoge, L. Collins, R. Woods, A. W. Toga, and A. C. Evans, “Enhancement of MR Images Using Registration for Signal Averaging,” Journal of Computer Assisted Tomography, Vol. 22, No. 2, 1998, pp. 324-333.
- D. Tosun and J. L. Prince, “Cortical Surface Alignment Using Geometry Driven Multispectral Optical Flow,” Information Processing in Medical Imaging, Vol. 3565, 2005, pp. 519-531. doi:10.1007/11505730_40
- D. Tosun, M. E. Rettmann and J. L. Prince, “Mapping Techniques for Aligning Sulci across Multiple Brains,” Medical Image Analysis, Vol. 8, No. 3, 2004, pp. 295-309. doi:10.1016/j.media.2004.06.020
- Y. Benjamini and Y. Hochberg, “Controlling the False Discovery Rate: A Practical and Powerful Approach to Multiple Testing,” Journal of the Royal Statistical Society, Series B, Vol. 57, No. 1, 1995, pp. 289-300.
- K. Im, J. M. Lee, J. Lee, Y. W. Shin, I. Y. Kim, J. S. Kwon, et al., “Gender Difference Analysis of Cortical Thickness in Healthy Young Adults with Surface-Based Methods,” NeuroImage, Vol. 31, No. 1, 2006, pp. 31-38. doi:10.1016/j.neuroimage.2005.11.042
- E. Luders, K. L. Narr, P. M. Thompson, D. E. Rex, R. P. Woods, H. DeLuca, et al., “Gender Effects on Cortical Thickness and the Influence of Scaling,” Human Brain Mapping, Vol. 27, No. 4, 2006, pp. 314-324. doi:10.1002/hbm.20187
- B. Lv, J. Li, H. He, M. Li, M. Zhao, L. Ai, et al., “Gender Consistency and Difference in Healthy Adults Revealed by Cortical Thickness,” NeuroImage, Vol. 523, No. 2, 2010, pp. 373-382. doi:10.1016/j.neuroimage.2010.05.020
- E. R. Sowell, B. S. Peterson, E. Kan, R. P. Woods, J. Yoshii, R. Bansal, et al., “Sex Differences in Cortical Thickness Mapped in 176 Healthy Individuals between 7 and 87 Years of Age,” Cerebral Cortex, Vol. 17, No. 7, 2007, pp. 1550-1560. doi:10.1093/cercor/bhl066
- K. L. Narr, R. M. Bilder, A. W. Toga, R. P. Woods, D. E. Rex, P. R. Szeszko, et al., “Mapping Cortical Thickness and Gray Matter Concentration in First Episode Schizophrenia,” Cerebral Cortex, Vol. 15, No. 6, 2005, pp. 708- 719. doi:10.1093/cercor/bhh172
- A. B. Wisniewski, M. T. Prendeville and A. S. Dobs. “Handedness, Functional Cerebral Hemispheric Lateralization, and Cognition in Male-to-Female Transsexuals Receiving Cross-Sex Hormone Treatment,” Archives of Sexual Behavior, Vol. 34, No. 2, 2005, pp. 167-172. doi:10.1007/s10508-005-1794-x
- I. Savic and P. Lindstrom, “PET and MRI Show Differences in Cerebral Asymmetry and Functional Connectivity between Homoand Heterosexual Subjects,” Proceedings of the National Academy of Sciences, Vol. 105, No. 27, 2008, pp. 9403-9408. doi:10.1073/pnas.0801566105
- I. Savic and S. Arver, “Sex Dimorphism of the Brain of Male-to-Female Transsexuals,” Cerebral Cortex, Vol. 21, No. 11, 2011, pp. 2525-2533. doi:10.1093/cercor/bhr032
- F. J. Sánchez and E. Vilain, “Collective Self-Esteem as a Coping Resource for Male-to-Female Transsexuals,” Journal of Counseling Psychology, Vol. 56, No. 1, 2009, pp. 202-209. doi:10.1037/a0014573