Agricultural Sciences
Vol.08 No.07(2017), Article ID:77912,16 pages
10.4236/as.2017.87046
Reclamation of Smaller Volumes of Petroleum Hydrocarbon Contaminated Soil Using an Innovative Reactor System: A Case Study Evaluation of the Design
Mark E. Zappi1,2*, Rakesh Bajpai1,2, Rafael Hernandez1,2, Katherine Taconi3, Daniel Gang2,4
1Department of Chemical Engineering, University of Louisiana at Lafayette, Lafayette, LA, USA
2Center for Environmental Protection Energy Institute of Louisiana, University of Louisiana at Lafayette, Lafayette, LA, USA
3Consultant, Houston, TX, USA
4Department of Civil Engineering, University of Louisiana at Lafayette, Lafayette, LA, USA

Copyright © 2017 by authors and Scientific Research Publishing Inc.
This work is licensed under the Creative Commons Attribution International License (CC BY 4.0).
http://creativecommons.org/licenses/by/4.0/


Received: December 12, 2016; Accepted: July 23, 2017; Published: July 26, 2017
ABSTRACT
Petroleum products contamination is a world-wide problem that threatens polluting groundwater and surface water systems. However, the problem is not only large-scale in scope when viewed from a case-by-case basis. Many fueling, construction, agricultural, and industrial activities result in the problem of managing smaller quantities of these soils from an ecological safety perspective. Landfilling has been the disposal method of choice in the US; however, this option is becoming economically prohibitive and it does not really offer a true degradation fate for the pollutants. This study focused on the proving of an innovative biocell design that afforded a high level of petroleum degradation within a simple and cost effective design. Additionally, the design offered a remediation solution for sites not easily accessed. Soil contaminated with both diesel fuel and gasoline collected from a former filling station was used in this on-site remediation case study. Rapid biodegradation of the petroleum products were observed at the initiation of the study with rates leveling off as the study progressed with the final total petroleum hydrocarbon concentration being 10 mg/kg at Day 90. Oxygen uptake rates were monitored and found to nicely track both microbial activity and pollutant removal dynamics. The biocell design met all expectations by being effective, yet simple to build and operate.
Keywords:
Bioremediation, Total Petroleum Hydrocarbons, Biocells, Oil Contamination, Cost-Effective Management Practices, Small Quantity Contamination

1. Introduction
Petroleum hydrocarbons represent one of the most prevalent types of soil pollution found at contaminated sites world-wide [1] [2] [3] [4] . Sources of this contamination include leaking underground storage tanks, spills, intentional releases, and industrial runoff [5] [6] [7] [8] . Activities generating this contamination include fueling stations, agriculture, construction, military activities, vehicle maintenance areas, powered tool storage, and various industrial operations [9] [10] [11] . With gasoline and diesel fuel being the primary transportation fuels of both consumer and industrial fleets, they also then represent one of the most widespread pollutants found at contaminated sites around the world [2] [12] [13] . Given its relative widespread prevalence, petroleum contamination in soil zones poses a significant threat to the health of the groundwater resources, regardless of the volume of soil contaminated [14] [15] .
A commonly used disposal option for petroleum-contaminated soils is landfilling, which essentially involves placing the contaminated soil within an underground vault [2] [16] . Unfortunately, this option provides limited treatment. Some argument can be made that biodegradation does occur within a landfill; however, generally strict anaerobic conditions tend to persist within landfills which inhibits the production of oxygenases which are key to the practical biodegradation of most petroleum products, particularly aromatic compounds [17] . In many cases, appropriately designed landfills are not easily accessible for sites located in isolated areas (a common situation in many developing countries or rural areas of the US). Note that conversations with US Forest Service personnel indicate that some volumes of TPH contaminated soils they manage are not near landfills and are in remote locations making complex remediation methods difficult to implement.
Alternative disposal options to the landfilling for petroleum contaminated soil that are generally considered reasonable options include thermal stripping and biological treatment [2] [16] [18] [19] . Thermal stripping uses elevated temperatures to volatilize the pollutants from the soil matrix [7] [20] [21] [22] . After volatilization, secondary treatment is often utilized in the form of incineration for larger projects and adsorption for smaller ones to purify the resulting vapor stream prior to gas release into the ambient air. Thermal stripping processes are well proven and adequate for removing petroleum contamination. They can be applied with excavated soils or within vadose soil zones [7] . Thermal stripping does often result in the more rapid treatment of the soils over most biological treatment options; unfortunately, thermal treatment generally tends to be costly and involve complex equipment. Conversely, biological treatment or bioremediation systems are simple to implement processes that are reported to be cost-effective treatment options for petroleum contaminated soils [16] [23] .
Initiating the rapid biodegradation of petroleum products in contaminated soil environments is well-proven [11] [24] [25] . For lighter petroleum products, such as diesel fuels and/or gasoline, the simple provision of oxygen, nitrogen/phosphorous (aka. macronutrients), and moisture is usually all that is needed to stimulate effective remediation [23] . With heavier petroleum types, such as motor oil, crude oil, and Bunker C fuels, the addition of co-metabolites, bacterial innocula, and surfactants have been found to be effective [26] [27] [28] ; however, even with these heavier pollutants, generally the provision of oxygen, macronutrients, and moisture usually provides an effective ecosystem for the degradation of the products [29] . The most commonly used biological treatment processes for petroleum hydrocarbon contaminated soils are land farming, bioslurry, and bioventing [6] [8] [11] [17] [30] . These processes utilize living bacteria, typically aerobic organisms, to degrade the pollutants in the soil [17] [28] [31] . Land farming involves spreading the excavated, contaminated soil over a lined land area. This process is cheap, but control of runoff and slow degradation kinetics associated with poor mass transfer of additives tend to limit this process [32] . Bioslurry involves slurrying the excavated, contaminated soil within a stirred bioreactor resulting in rapid kinetics, yet the process is often considered a costly bioremediation option [16] [33] . Bioventing involves placement of horizontal and/or vertical aeration piping into a contaminated soil mass without excavation of the soil [8] [34] . This process is cheap to apply, but does have slower comparative removal kinetics due to limited mass transfer characteristics (however, it does have better mass transfer characteristics compared to most landfarming operations). Composting has also been used for petroleum products [35] ; however, in most cases involving light petroleum products, this more complex process is not needed. Regardless of bioremediation design used, an effective bioreactor system is composed of two key components: the biological mechanism utilized to clean up the soil and the bioreactor unit used to house the organisms responsible for providing the degradation mechanism [6] .
The goal of this project was to develop an innovative reactor design for supporting the biological treatment of the petroleum contaminated soils. Since the actual mechanism of biodegrading petroleum hydrocarbons are well documented and proven [6] [17] [36] , the intent of this project was to evaluate a bioreactor design that could be used with smaller soil volumes; inexpensive to construct; easy to operate; and could be easily constructed on-site for use at remote sites. Yet, the design should provide better mass transfer characteristics than those provided by either land farming or bioventing; thereby, accelerating the rate of degradation. Based on these requirements, a modified biocell design was settled upon.
The biocell design is a fairly established approach for biological treatment that is composed of containerized piles of soil that allow for air to be forced into the pile along with periodic irrigation with nutrient solutions [9] [23] [37] . The advantages to biocell design include: 1) weatherproofing by benefit of the covered design which eliminates both air releases via volatilization and generation of contaminated aqueous runoff, 2) can be implemented without the use of heavy equipment to operate, 3) has a relatively small foot-print, 4) has simple operations and maintenance protocol, and 5) is economical to implement. Trotsky and Pal [9] found that a similar system to the one used in this study can be implemented in the $50 per cubic yard of soil treated range. Agunwamba and Mbogu [23] found that biocells could be implemented at a fraction (1/20th) of cost compared to bioslurry treatment. A targeted criteria for this project required that all components be available at local merchants, such as industrial equipment suppliers and hardware stores, to make the design easy to implement. More detail on the overall design and operation of the biocell design is provided below in the Materials and Method Section of this paper.
The objective of this study was to prove the utility of the proposed design using an on-site pilot system in terms of both system operation and economics using soil collected from an actual petroleum hydrocarbon contaminated site. Secondary objectives were to track to removal of the petroleum within the cells, evaluated the data generated to assess system performance, and to document improvements that can be made in future applications.
2. Materials and Methods
Site History―The site at which this project took place was located in Pascagoula, MS, USA (30.3658˚N & 88.5561˚W which is the Southwestern Mississippi area) and was formerly home to a service station. Three underground fuel storage tanks had been leaking petroleum products (two diesel and one gasoline) into vadose zone surrounding the tanks for several years. The study was initiated in September and completed by November (temperature ranged from a low of 65˚F to a high of 88˚F with an average of 81˚F reported). Both diesel and gasoline were the petroleum products (referred to herein as total petroleum hydrocarbons or TPH) found in the tanks and were later found to make-up the pollution source in the soils surrounding the tanks (3 tanks were removed at the initiation of this study). The initial average TPH level in the soil was approximately 300 mg/kg of soil; however, the initial TPH concentrations from individual samples ranged from 2 to 929 mg/kg of soil, indicating that the TPH contamination was not homogenously distributed within the soil (which is typical of excavated soil from leaking fuel storage tanks). The soil was a grey, loamy sand with a low nutrient content (192 mg/kg ammonia and 32.5 mg/kg total phosphate) and contained an initial total aerobic, heterotrophic bacteria population of 2.5 × 10⁵ colony forming units per gram of soil (which is common for most soils found beneath the O-horizon). The average moisture content of the soil was 14%, and the average pH was 7.6; both of which are within an acceptable range for initiating and sustaining biological treatment.
Description of the Biocell Design―As mentioned earlier, the centerpiece of biocell technology is the reactor used to house the pile of soil, which, in this case, which was two 20 cy capacity commercial roll-off garbage dumpsters (provided a duplicated test). The complete biocell design used is diagramed in Figure 1. The dumpster provided structural stability by keeping the soil contained in a pile protected from the local climate, while also encasing the polluted soil in a safe container until the bacteria have degraded the pollution to an environmentally acceptable level. Each dumpster was lined with high-density polyethylene

Figure 1. Schematic of biocell.
(HDPE) sheeting, custom cut to fit the dumpster and provided by Pac Tec, Inc. of Clinton, LA. The liner was covered with a layer of pea gravel, with approximately two inches of pea gravel was placed on top of the liner and spread evenly throughout the dumpster. Two lengths of two-inch, Schedule 40 slotted PVC pipe were placed on top of the pea gravel, running lengthwise down the dumpster. The PVC piping from each of the two biocells was attached to a Fuji brand 0.25 hp regenerative blower using a common manifold constructed of 1 inch PVC Schedule 40 pipe. The purpose of the air blower was to provide air to the bacteria, as they required oxygen to degrade TPHs. Upon the piping, another layer of pea gravel was laid facilitate even distribution of the air underneath the soil mass. A second layer of pea gravel, approximately four inches in depth, was placed on top of the slotted PVC pipe. A layer of felt geotextile material was placed over the second layer of pea gravel to separate it from the soil. Each biocell was filled with approximately 12.6 cubic yards of contaminated soil using a front-end loader (this amount of soil provided approximately one foot of freeboard within the reactor). Each biocell was covered with a heavy duty, flexible HDPE tarp which served as a cover (also provided by Pac Tec, Inc.). The cover was placed upon soil mass to protect the biocell contents from rain and reduce volatilization of petroleum products. The tarp was secured to the exterior of the dumpsters using elastic bungee cords to ensure that it would not be blown off by the wind. At the site, a small, prefabricated shed (10’ by 10’) was used to house the air blower and other miscellaneous equipment and supplies. All of the biocell components listed above were purchased from a local hardware store and home garden center, except for the blower which was purchased at a local industrial supply dealer.
Bacteria require nutrients, which were provided by pumping tapwater amended with a common agricultural fertilizer solution (liquid diammonium phosphate) and these reagents mixed within a 55-gallon drum. The fertilizer solution was irrigated onto the soil pile using a small electrical centrifugal pump with its suction hose immersed into the contents of the drum.
Both vertical and horizontal gas sampling ports were installed during loading of the biocells (see Figure 2). The purpose of these ports was to monitor the volatile organic compounds (VOCs) in the soil gases. Three vertical gas sampling ports were installed, equally spaced down the length of the dumpster. Two-inch, Schedule 40 slotted PVC pipe was buried approximately six inches from the geotextile material, and the pipe extended up approximately 5/2 feet, through the surface of the soil. The vertical sample ports were slotted over the bottom half of the vertical length of the pipe to provide free soil gas entrance into the tubes for sampling over the bottom half of the soil mass (allowed for bottom soil as analyses). Two horizontal gas sampling ports spanning the width of the reactor were installed approximately six inches under the surface of the soil. The horizontal sampling ports were constructed of half-inch, Schedule 40 slotted PVC pipe. All of the sample ports remained covered with a solid PVC cap when not in use to keep collected gases within the tubes and reduce gas loss between samplings.
Analytical Methods―Since organisms degrading TPH consume oxygen and produce carbon dioxide, the O2 and CO2 levels in the soil gas phase were monitored as an indication of microbial activity. A GasTech portable multigas analyzer was used to analyze oxygen, carbon dioxide, and volatile organic compounds (calibrated as benzene) in the vapor phase. The volatile organic compound parameter, as measured by the meter, provides a gross measure of the total
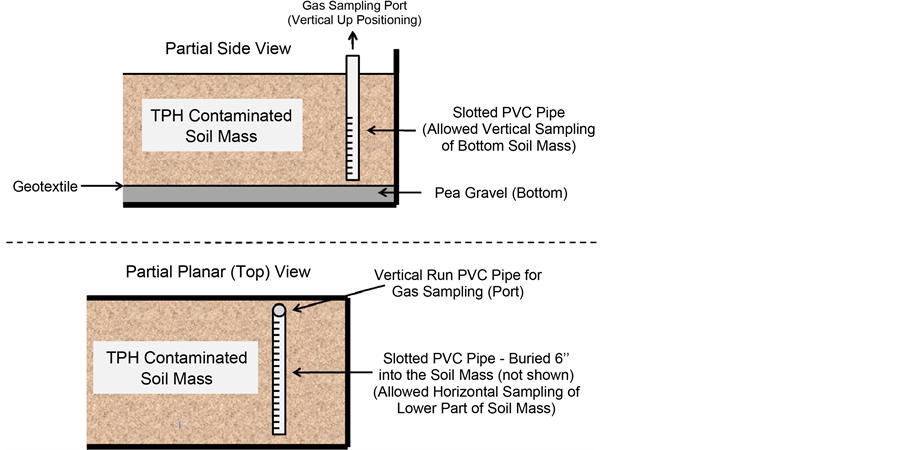
Figure 2. Configuration of sampling ports.
amount of gasoline vapors within the gas phase of the bioreactor system. The detection mechanism for both oxygen and organic vapors with this meter was UV absorption. Carbon dioxide used IR absorption. The detection limits for oxygen, carbon dioxide, and volatile organic compounds were 0.5%, 0.1%, and 1 ppm (v/v), respectively. The ambient air temperature was also recorded using a standard agricultural grade thermometer.
Chemical analysis of the soil samples was used to determine when the process had reduced the TPH contamination to acceptable levels and to monitor both the nutrients and bacterial levels present in the soil. TPH levels were monitored using a GC method analyzed using a Hewlett Packard Model 5890 GC using Supelco Gasoline Range Organics standards (GRO). All peaks detected within the elution times for the standard peaks from the GRO standard were reported as TPH. The soil was analyzed for TPHs by first extraction using 50% hexane/50% methanol using a Dionex auto extraction unit, followed by GC analysis.
The ammonia levels within the soil were analyzed using an aqueous extraction performed by mixing a 30% (w/w) slurry of soil and distilled water for several hours and analyzing the aqueous extract using an Orion 950 Ion Specific Analyzer after separated via centrifugation. The phosphate levels were measured as total phosphate using a similar soil extraction procedure except that the total phosphate levels in the aqueous phase were measured using a colorimeteric technique marketed by Hach Inc. Bacterial levels were monitored using heterotrophic plate counts. This enumeration technique provides an estimate of the aerobic microorganisms capable of degrading a variety of simple substrates.
Biocell Operation and Maintenance―Each of the two biocells was aerated three times weekly for one hour at a rate of one standard cubic foot per minute. Aeration occurred three times each week. The soil gases were analyzed before aeration and thirty minutes after aeration was complete. Readings were taken by inserting the Gas-Tech analyzer probe into the three vertical and two horizontal gas sampling ports. The VOC levels were reported in ppm, while the O2 and CO2 levels were reported as a percentage. Once each week an Oxygen Uptake Rate (OUR) test was conducted to estimate the amount of O2 consumed and CO2 produced by the biomass. The OUR was completed by taking a third set of VOC, O2, and CO2 readings approximately 3/2 hours after aeration was complete.
Soil samples were collected once every week. Six samples were collected from each biocell at varying locations and depths in the soil. The samples were collected in 250 ml plastic bottles and shipped to the laboratory for analysis. All samples collected were storied in ice-packed ice chests for transport to the laboratory.
The biocells were irrigated a total of six times over the course of the study, four times with nutrient solution, and twice with water only. The day the study was initialized, each biocell was fertilized with approximately 25 gallons of a 2% w/w diammonium phosphate (DAP) aqueous solution. The fertilizer solution was prepared in a 55-gallon drum and sprayed on the surface of the soil using a pump and garden hose. This same amount of fertilizer was again added on the Day Nos. 15 and 41 of the study. On Day 71, about 25 gallons of a 2% w/w 20-20-20 fertilizer aqueous solution (processed using the same methods as with the DAP fertilizer) was added to each biocell. On Days 55 and 69, about 50 gallons of water were added to each biocell to keep the soil damp. Over the course of the study, the surface of the soil became so compacted that it became difficult for any moisture to permeate the soil. To alleviate this, the surface soil was broken up by hand with shovels, allowing the moisture to seep in. This was done carefully to ensure that the soil was only loosened and not mixed.
3. Results and Discussion
Petroleum Degradation―Figure 3 shows the TPH levels in the soil over the entire length of the study, and Figure 4 shows the TPH levels in the soil from Day 5 until the completion of the study. Figure 4 presents an expanded y-axis to better view TPH removal trends over the portion of the study where TPH removal was much slower than the original rapid uptake exhibited in the early phase of the study. Note that all data processing with this study was done using Microsoft Excel. The data in both graphs is an average of 12 samples, 6 from each biocell collected at each sampling event (time dependent events). The average initial

Figure 3. Average soil phase TPH levels in the biocells.
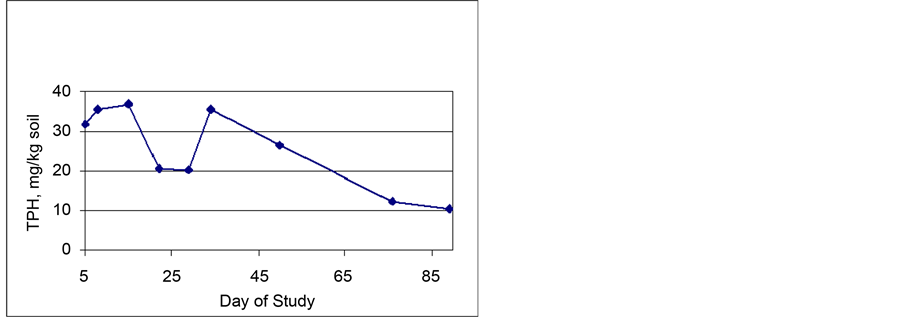
Figure 4. Average soil phase TPH levels in the biocells (exploded view as days 5 through 88).
TPH level in the soil was 261 mg/kg of soil. As shown in Figure 3, by the fifth day of the study, the average TPH level had decreased to 32 mg/kg of soil. It is important to note that the State of Mississippi (and many other states) used a TPH value of 100 mg/kg as a remediation goal for the project. From Day 5 until the end of the study, the average TPH level decreased from 32 mg/kg to 10 mg/kg. Longer treatment times may have resulted in more removal, but given the target treatment was fat exceeded, the study was stopped at 90 days.
Figure 5 shows the average VOC levels in the soil gas phase over the length of the study. These readings were recorded using the Gas-Tech multi gas analyzer, and the data shown is the average of the before aeration and after aeration readings from the vertical gas sampling ports buried within the two biocells. During first week of the study, the VOC levels in the soil gases were above 10,000 ppm, which is the upper detection limit of the meter, and as such, the meter read “over range”. After twenty days, however, the VOC decreased significantly to approximately 3000 ppm. By the end of the study, the average VOC level in the gas phase was less than 200 ppm. Although not shown in a figure, the VOC readings taken from the sample ports buried just under the surface of the soil followed the same trend as shown in Figure 5; however, the VOC levels in the surface sample ports averaged less 20% of those measured in the deep sample ports. The initial average VOC levels in the surface sample ports was 1125 ppm, and this value also decreased to less than 200 ppm by the end of the study (same final values observed with the deeper soil gas VOC concentrations).
The data presented in this section indicate rapid removal of the TPH. Granted, volatilization did make up a portion of this removal, the bulk of the removal appears to be biotic in nature given the low levels of air-phase volatile organic compounds measured in the upper soil levels over the first five days of the study. This conclusion is based on the small amount of air actually passed through the soil mass and the long-term presence of volatile organic compounds observed within the soil gases.
Oxygen and Carbon Dioxide Levels in Soil Gas Phase―Figure 6 presents the

Figure 5. Average gas phase VOC levels in biocells.
average O2 and CO2 levels in the soil before aeration as compared to TPH degradation in the soil, measured in the vertical gas sampling ports. The oxygen levels in the soil before aeration were less than 6% for most of the study, indicating that the organisms in the soil were consuming significant amounts of oxygen. As the TPH levels decreased, the O2 levels increased, indicating less microbial activity. The O2 levels before and after aeration are compared in Figure 7. These data shows that within thirty minutes of aeration, the O2 levels had increased by an average of 57%. Presumably the increase in the O2 levels was even greater as the air further permeated the soil. As evidenced by the data, conditions after aeration were more favorable for aerobic processes to occur. The O2 levels in the surface sampling ports remained between 17% and 20%, approximately ambient conditions, during the entire length of the study.
As shown in Figure 6, after the first five days of the study, the average CO2 levels measured in the vertical gas sampling ports ranged between 11% and 18%,
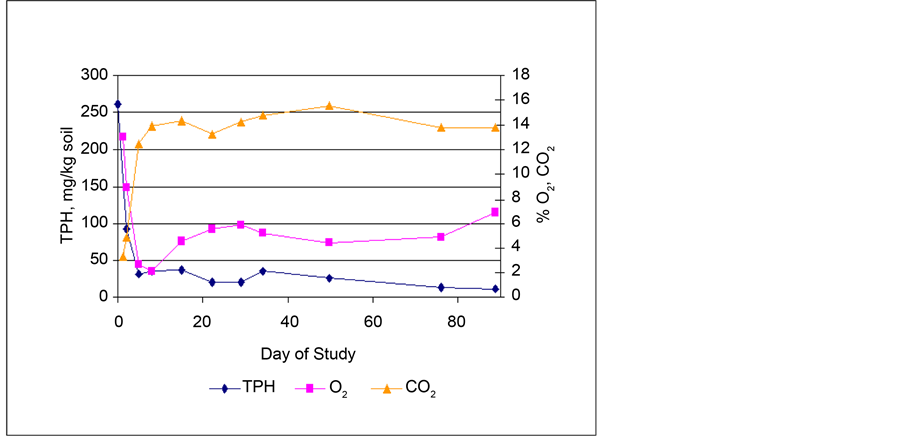
Figure 6. Average TPH, O2, and CO2 levels in soil gas phase (oxygen and carbon dioxide measured prior to aeration).

Figure 7. Average O2 levels in soil phase.
indicating that significant amounts of CO2 were produced. As TPH levels decreased, the CO2 levels decreased, further indication of reduced microbial activity. With few exceptions, the average carbon dioxide levels were higher before aeration, indicating that the CO2 was produced; however the decrease in the amount of CO2 present after aeration was less than 6%. The CO2 levels remained between 10% - 15% even after aeration. As with the O2, the average CO2 levels in the surface sampling ports remained fairly constant at less than 5% during the entire study. Comparison of the readings from the individual vertical gas sampling ports in each of the two biocells showed that the sampling ports furthest from the air blower contained the highest levels of O2 and the lowest levels of CO2 after aeration. This indicates that aeration was not well distributed across the total soil mass.
Oxygen Uptake and Carbon Dioxide Production Rates―The average oxygen uptake and carbon dioxide production rates were determined by calculating the change per day in the after aeration reading one day of operation and the before aeration reading of the next day of operation. Figure 8 shows the average O2 and CO2 production rates per day as compared to TPH degradation over the entire length of the study. As expected, when the TPH levels were high, the oxygen uptake rate (OUR) and carbon dioxide production rate (CDPR) were high. As the TPH levels decreased, the OUR and CDPR also decreased, indicating a reduction in microbial activity.
Nutrient Levels―Environmental conditions in the soil, such as pH, nutrient levels, and moisture content were also measured during the study. Table 1 summarizes the initial nutrient and physical conditions of the test soil (loamy
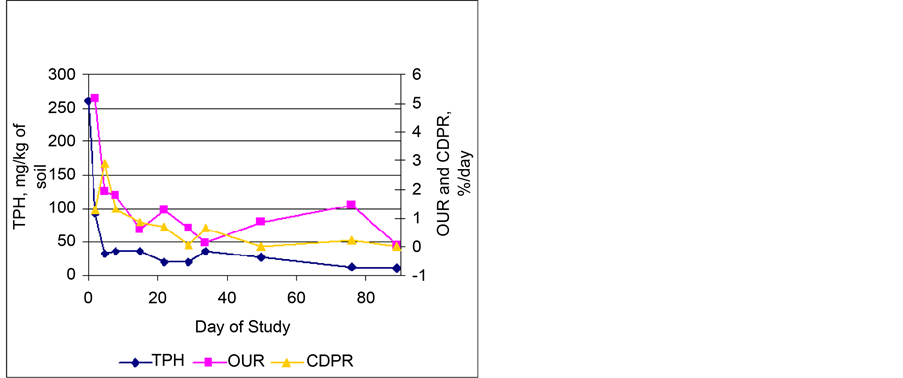
Figure 8. TPH, OUR, and CO2 production (CDPR) in biocells.

Table 1. Initial soil conditions prior to chemical dosing.
sand). Figure 9 shows the total phosphate and ammonia concentrations in the biocells analyzed in the soil over the course of the study. Increases in the total phosphate concentration can also be seen after Days 15 and 41, when additional fertilizer was added to the biocells. The ammonia content of the soil remained fairly constant, ranging from 122 - 240 mg/kg of soil, with the average over the entire study being 169 mg/kg. The pH of the soil remained neutral over the course of the study, ranging between 7 - 7.75, with the average being 7.4. The moisture content of the soil also changed little, ranging from 14% to 17%, with an average of 15.4%.
Microbial Cell Enumeration―Figure 10 shows the average number of colony forming heterotrophs per gram of soil. The soil initially contained a healthy population of about 5.4 × 10² microorganisms. After five days, the population had increased to 7 × 10⁸ CFUs per gram of soil and was maintained between 4.1 × 10⁷ and 9.6 × 10⁸ for the remainder of the study. It is interesting to note that the bacterial population tracked nicely with both the TPH levels and OUR of the soil. This observation provides good evidence as to the benefits of a simple, yet, real-time field test, as OUR, for operating aerobic bioreactors units in the field.
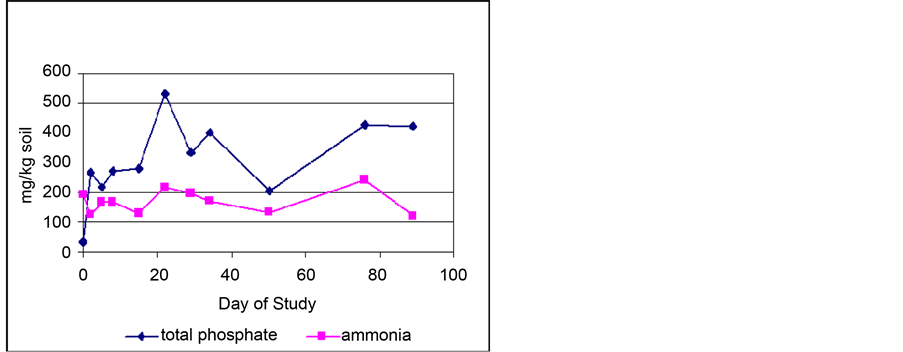
Figure 9. Phosphate and ammonia levels in soil.
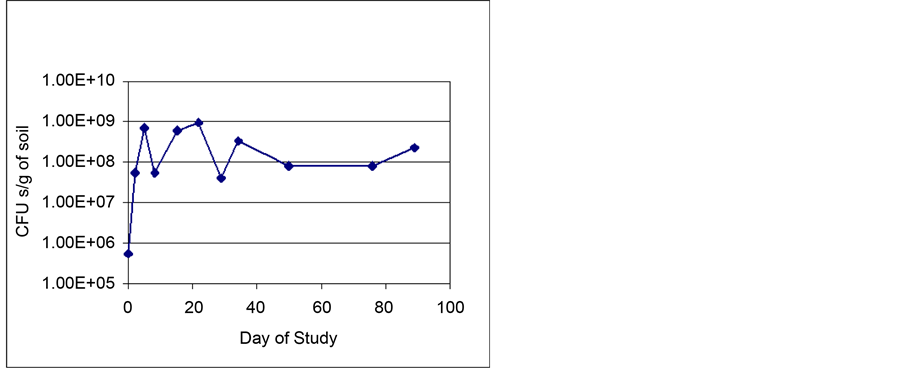
Figure 10. Average total heterotroph (bacteria) counts.
4. Conclusion
As shown by the data, biocell treatment was an effective method of removing TPH contamination in soils. In particular, the simple biocell design proved to be a good system for treating small volumes of contaminated soils. Within five days, the TPH levels in the soil were reduced from approximately 260 mg/kg to less than 50 mg/kg of soil, and the final TPH levels were approximately 10 mg/kg. The total TPH removal was about 96%. The VOC levels in the soil headspace also decreased significantly during the study, from over 10,000 ppm to less than 2000 ppm. Significant increases in oxygen uptake and carbon dioxide production as well as biomass population indicates that microbial activity was believed to be the mechanism responsible for the observed decrease in TPH. The oxygen uptake and carbon dioxide rates corresponded well with TPH removal in both the soil and air phase. At the beginning of the study the oxygen uptake rate and carbon dioxide production rate were higher, and as the carbon source declined, the oxygen uptake and carbon dioxide production decreased. The addition of phosphate and ammonia increased the amount of nutrients available, while the moisture content and pH of the soil remained relatively constant over time.
5. Additional Notes on System Operation
The construction and operation of the biocells was found to be relatively simple; however some challenges were encountered over the course of the study. Aeration appeared to not be well distributed across the soil mass. The areas of the biocell furthest from the air blower had the highest levels of oxygen, while the areas in the center of the biocell had the lowest. Overall, however, aeration significantly increased the amount of oxygen in the soil, allowing for aerobic conditions to predominate. It is suggested that system in the future be designed to allow air injection on both sides (multiple locations) to facilitate improved aeration distribution. Also, there was a problem with the surface soil becoming compacted over time, making it difficult for the aqueous nutrient solution to permeate the soil. This was alleviated by breaking up the surface of the soil with a shovel. Despite these challenges, biocell treatment was successful for removing the TPH contamination at this site. This process may be more challenging for soil volumes in excess of 20 cubic yards due to difficulties transporting the soil within a loaded biocell/dumpster. In fact, the truck used to move the remediated soil used in this study had difficulties loading each dumpster onto its transport racking; however, both were eventually loaded and dumped as a recovered soil source that was later used as construction fill. Note that the final calculated per cubic yard treated estimates indicate that the technology as applied could be implemented for less $80/cy.
Acknowledgements
The authors thank the State of Mississippi for partially funding this project. Also, great appreciation is felt toward Michael Barrett for his help with system operation in the field.
Cite this paper
Zappi, M.E., Bajpai, R., Hernandez, R., Taconi, K. and Gang, D. (2017) Reclamation of Smaller Volumes of Petroleum Hydrocarbon Contaminated Soil Using an Innovative Reactor System: A Case Study Evaluation of the Design. Agricultural Sciences, 8, 600-615. https://doi.org/10.4236/as.2017.87046
References
- 1. Pyagbara, L. (2007) The Adverse Impact of Oil Pollution on the Environment and Wellbeing of a Local Indigenous Community: The Experience of the Ogoni People of Nigeria. Proceedings of the International Expert Meeting on Indigenous Peoples and Protection of the Environment, Department of Economic and Social Affairs, UN, Khabarovsk, Russia, 27-29 August 2007, 1-16.
- 2. EPA (2011) Green Remediation Best Management Practices: Sites with Leaking Underground Storage Tank Systems, EPA Report No. 542-F-1-008, Office of Solid Wastes and Emergency Response, Washington DC.
- 3. Bonderud, K. (2012) Contaminated Land and Brownfields Cleanup Programs. Report by the Wisconsin Legislative Fiscal Bureau, Madison, WI.
- 4. Adams, G., Fufeyin, P., Okoro, S. and Ehinomen, I. (2015) Bioremediation, Biostimulation, and Bioaugmentation: A Review. International Journal of Environmental Bioremediation and Biodegradation, 3, 28-39.
- 5. Marchal, R., Penet, S., Solano-Serena, F. and Vandecasteele, J. (2003) Gasoline and Diesel Oil Biodegradation. Oil and Gas Science and Technology, 58, 441-448.
https://doi.org/10.2516/ogst:2003027 - 6. Adedokun, O. and Ataga, A. (2007) Effects of Amendments and Bioaugmentation of Soil Polluted with Crude Oil, Automotive Gasoline Oil, and Spent Engine Oil on the Growth of Cowpea (Vigna ungiculata L. Walp). Scientific Research and Essay, 2, 147-149.
- 7. Ezeji, U., Anyadoh, S. and Ibekwe, V. (2007) Clean-Up of Crude Oil-Contaminated Soil. Terrestrial and Aquatic Environmental Toxicology, 1, 54-59.
- 8. Rayner, J., Snape, I., Walworth, J., Harvey, P. and Ferguson, S. (2007) Petroleum-Hydrocarbon Contamination and Remediation by Microbioventing at Sub-Antarctic Macquarie Island. Cold Region Science and Technology, 48, 139-153.
https://doi.org/10.1016/j.coldregions.2006.11.001 - 9. Trotsky, J. and Pal, D. (1998) Biocell Application Guidance. Report No. TR-2092-ENV, US Navy Facilities Engineering Service Center, Port Hueneme, CA.
- 10. Hou, F. (2000) Phytoremediation and Bioremediation of Petroleum Contaminated Soils and Wastes. PhD Thesis, Civil Engineering Department, University of Canterbury, New Zealand.
- 11. Cunningham, C. (2011) Sustainable Treatment of Hydrocarbon-Contaminated Industrial Land. Dissertation for PhD, Institute for Infrastructure and Environment, School of Engineering, University of Pittsburgh, Pittsburgh.
- 12. Barnes, D., Laderrach, S. and Showers, C. (2002) Treatment of Petroleum Contaminated Soils in Cold, Wet, Remote Regions, Report No. 9E92G49, US Forest Service, Technology and Development Program, Missoula, MT.
- 13. Hremiue, M., Coman, M. and Chiorupta, B. (2015) Considerations Regarding the Soil Pollution With Oil Products in Sacel-Maramures. International Conference of Scientific Paper, Brasov, 28-30 May 2015.
- 14. Summers Consulting Llc (2012) Environmental Sustainability Report. Prepared for California Rice Commission, Summers Consulting Llc, Auburn.
- 15. USU (Utah State University) (2012) How to Protect Your Water from Spilled Fuel, USU Cooperative Extension Service, Fact Sheet No. 4.
- 16. LANL (1996) A Compendium of Cost Data for Environmental Remediation Technologies. Report No. LA-UR-96-2205, Los Alamos National Laboratory, Los Alamos.
- 17. Cookson, J. (1995) Bioremediation Engineering: Design and Application. McGaw Hill Publishers, New York.
- 18. Bardos, R. (2001) Report of the NICOLE workshop: Cost-Effective Clean-Up Technology. Quality Assurance and Acceptance, 17-18 May 2001, Hosted by Total Elf Fina, Paris, France. Journal of Land Contamination and Reclamation, 9, 377-395.
- 19. Summersgill, M. (2005) Remediation Technology Costs in the UK & Europe: Drivers and Changes from 2001 to 2005. Proceedings of the Cardiff 5th International GeoEnviro Conference, Cardiff, June 2005, 1-8.
- 20. Khan, F., Husain, T. and Hejazi, R. (2004) An Overview and Analysis of Site Remediation Technologies. Journal of Environmental Management, 71, 95-122.
https://doi.org/10.1016/j.jenvman.2004.02.003 - 21. Baker, R., LaChance, J. and Heron, G. (2006) Application of Thermal Remediation Techniques for In-Situ Treatment of Contaminated Soil and Water. Proceedings of the NATO Advanced Research Workshop, Athens, 12-17 June 2006.
- 22. IDEM (Indiana Department of Environmental Management) (2012) In-Situ Thermal Remediation. IDEM Technical Guidance Document, IDEM, Indianapolis.
- 23. Agunwamba, J. and Mbogu, E. (2013) Cost Comparisons of Different Methods of Bioremediation. International Journal of Current Science, 7, 9-15.
- 24. Nwaogu, L., Onyeze, G. and Nwabueze, R. (2008) Degradation of Diesel Oil in a Polluted Soil Using Bacillus subtilis. African Journal of Biotechnology, 7, 1939-1943.
https://doi.org/10.5897/AJB07.889 - 25. Majone, M., Verdini, R., Aulenta, F., Rossetti, S., Tandoi, V., Kalogerakis, S., Agathos, S., Puig, S., Zanaroli, G. and Fava, F. (2015) In Situ Groundwater and Sediment Bioremediation: Barriers and Perspectives at European Contaminated Sites. New Biotechnology, 32, 133-146.
https://doi.org/10.1016/j.nbt.2014.02.011 - 26. Kanaly, R. and Harayama, S. (2000) Biodegradation of High-Molecular Weight Polycyclic Aromatic Hydrocarbons by Bacteria. Journal of Bacteriology, 182, 2059-2067.
https://doi.org/10.1128/JB.182.8.2059-2067.2000 - 27. Tahhan, R., Ammari, T., Goussous, S. and Al-Shdaifat, H. (2011) Enhancing the Biodegradation of Total Petroleum Hydrocarbons in Oily Sludge by a Modified Bioaugmentation Strategy. International Journal of Biodeterioration and Biodegradation, 65, 130-134.
https://doi.org/10.1016/j.ibiod.2010.09.007 - 28. Sharma, S. (2012) Bioremediation Features, Strategies, and Applications. Asian Journal of Pharmacy and Life Science, 2, 202-213.
- 29. Padayachee, D. and Lin, J. (2011) The Effect of Fertilizer Amendment on Diesel Biodegradation in Contaminated Soils. African Journal of Microbiology, 5, 1729-1739.
https://doi.org/10.5897/ajmr10.466 - 30. SWMS (Solid Waste Management Section) (2010) Guidelines for Licensing One-Time Landfarms for the Remediation of Hydrocarbon Contaminated Soils, Permitting and Compliance Section, Solid Waste Management Section, MN State Department of Environmental Quality, Helena.
- 31. Kumar, A., Bisht, B., Joshi, V. and Dhewa, T. (2010) Review on Bioremediation of Polluted Environment: A Management Tool. International Journal of Environmental Sciences, 1, 1079-1093.
- 32. NSW-EPA (New South Wales) (2014) Best Practice Note: Landfarming. BPN Report, NSW-EPA, Wales.
- 33. Banerji, S., Zappi, M., Teeter, C., Gunnison, D. and Cullinane, J. (1995) Bioremediation of Soils Contaminated with Petroleum Hydrocarbons Using Bioslurry Reactors. USACE Report No. IRRP-95-2, Waterways Experiment Station, Vicksburg.
- 34. USACE (US Army Corps of Engineers) (2002) Soil Vapor Extraction and Bioventing. Engineer Manual No. EM1110-1-4001, Washington DC.
- 35. Atagana, H. (2008) Compost Bioremediation of Hydrocarbon-Contaminated Soil Inoculated with Organic Manure. African Journal of Biotechnology, 7, 1516-1525.
- 36. Malik, Z. and Ahmed, S. (2012) Degradation of Petroleum Hydrocarbons by Oil Field Isolated Bacterial Consortium. African Journal of Biotechnology, 11, 650-658.
- 37. NYDEC (State of New York Department of Environmental Conservation) (1996) Biocell and Biopile Designs for Small-Scale Petroleum-Contaminated Soil Projects. Stars Report No. 2, NYDEC, Albany.