International Journal of Geosciences
Vol.5 No.8(2014), Article ID:48365,13 pages
DOI:10.4236/ijg.2014.58076
Integration of Electrical Resistivity and Electromagnetic Radiation Methods for Fracture Flow System Detection
Jawad Hasan Shoqeir1, Heinz Hoetzl2, Akiva Flexer3
1Department of Earth and Environmental Sciences, Al-Quds University, Jerusalem, Palestine
2Department of Applied Geology, KIT, Karlsruhe, Germany
3Department of Geophysics and Planetary Sciences, Tel Aviv University, Ramat-Aviv, Israel
Email: jhassan@science.alquds.edu, heinz.hoetzl@agk.uni-karlsruhe.de, flexer@post.tau.ac.il
Copyright © 2014 by authors and Scientific Research Publishing Inc.
This work is licensed under the Creative Commons Attribution International License (CC BY).
http://creativecommons.org/licenses/by/4.0/


Received 31 March 2014; revised 28 April 2014; accepted 21 May 2014
ABSTRACT
An electrical resistivity and electromagnetic emission survey was carried out involving the use of vertical electrical soundings (VES) and natural pulse electromagnetic field of the earth (NPEMFE). The use of this new methodology managed to detect the fracture flow system rupture zones in the underground, also answered the questions about the deferent subsurface water bodies. The present study focuses on Marsaba-Feshcha sub-basin in the northeast of the Dead Sea. Due to the scarcity of boreholes in the study area, several geophysical methods were implanted. The combination of these two methods (VES and NPEMFE) with the field observations and East-West transversal faults with the coordination (624437/242888) was determined, cutting through the anticlines with their mainly impervious cores with fracture length of >400 m. These transversal faults saddle inside Nabi Musa syncline (Boqea syncline), leading to a hydraulic connection between the Lower and the Upper Aquifer. Due to the identified transversal fault, the water of the Upper and Lower Aquifer mixed and emerged as springs at Ein Feshcha group.
Keywords: Vertical Electric Sounding, Transversal Faults, Boqea Syncline, Rupture Zones, Fracture Flow

1. Introduction
Groundwater resources in the Middle East surrounding areas were deteriorated noticeably in the last 50 years. Salt concentration in the aquifer systems along Jordan valley which is covered by Lake Lisan (ancestor of the Dead Sea) indicates a general trend of increasing salinity which reach its maximum in the lower part of Jordan Rift Valley and threaten the groundwater resources and consequently the stability of the whole system in the area [1] . The present study focuses on a small area of the West Bank (Marsaba-Feshcha). The study area covers a surface of approximately 800 km2 (Figure 1), extending from the eastern slopes of Judea anticlinorium through the Marsaba anticline in the West to the Jordan Valley and the Dead Sea in the East, including the spring complex of Ein Feshcha (Figure 1).
This catchment area is considered as part of the eastern drainage basin of the Jerusalem hills and the outlet of this basin is Ein Feshcha spring group which is located on the upper North-Western shore of the Dead Sea at an elevation of approximately 413 m below sea level, that is, a head of 860 m over a lateral distance of about 20 - 25 [2] . The main aquifer is bordered along the Dead Sea by an active fault zone (Gulf of Aqaba-Jordan Valley transform fault zone), as well as accompanied by significant vertical components of stepped faults along its flanks [3] . Different rough estimations were provided for the spring annual discharge of saline/brackish water, ranging between 30 and 50 MCM/Y [4] -[7] ; 80 MCM/Y [8] , 53 MCM/Y [9] , 80 MCM/Y [10] [11] , 65 MCM/Y [12] . During the years of 2003 and 2004 “The Israeli Hydrological Services” established a specific survey for the measurement of the spring’s recharge which resulted with the total capacity of 62 - 67 MCM/Y. Therefore this catchment is considered as one of the few places of the region where additional limited amounts of the ground water can be exploited. This research study was undertaken with the objective to obtain new insights about the fresh-saline water interface in the study area through the determination of the freshwater and saltwater bodies. As part of the study, the detection of active structural features (flexures and faults) in the upper earth crust and determination of its role in mixing and salinization processes may lead to the identification of flow patterns in the study area.
1.1. Geology and Tectonics
Geologically the West Bank is located on the Northern edge of the Nubian-Arabian Shield. The Shield belongs
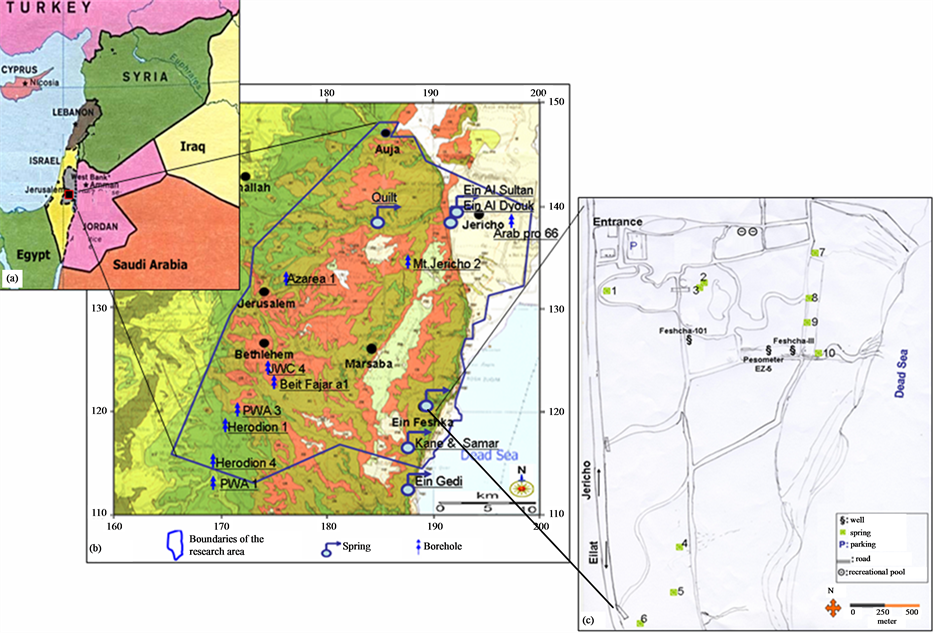
Figure 1. Location map (a) Location of the background of the Near East Countries; (b) Wells and spring location in Marsaba chatchment; (c) Wells and springs downstream.
to the Precambrian age and consists of complex crystalline plutonic and metamorphic rocks. The Shield metamorphic rocks are mainly of sedimentary origin (metasediments) and usually referred to as the basement comple. These Sedimentary rocks overlaying the Shield are known as the shelf deposits. Two environments of sedimentation can be recognized within the shelf rocks: the stable and the unstable environments. The stable environment is characterized by continental deposits inter-fingering with neritic and littoral deposits. The unstable environment is characterized, in general, by carbonate sediments deposited in marine environment. Locally, the unstable shelf is divided into basins of Euxinic conditions and swells of continental conditions [13] -[15] . Most of the West Bank is covered by carbonates of the Mesozoic and Cenozoic eras. The representation of the stable shelf environment in the West Bank is restricted to exposures of a sequence of clastic sediments of the Lower Cretaceous overlying Jurassic carbonate rocks [13] -[16] . The stratigraphy of the study area consists of carbonates, chert, chalk, gravel, sandstone and evaporates which ranges in age from the Triassic to Holocene age. The older Jurassic and Lower Cretaceous formations are composed mainly of limestone, sandstone and marl layers. The stratigraphic profile of Marsaba-Feshcha drainage basin and its immediate surrounding exposed in the study area varies from the Lower Cenomanian age to much younger formations of the Holocene age (Figure 2).
The thickness of Ajlun Group (Judea) is about 800 - 850 m [17] [18] . The exposed layers are older formations of Cretaceous age, composed mainly of limestone layers, outcropping along and at the vicinity of the Hebron anticline. In the flanks of this anticline formations of the Belqa Group (Mt. Scopus) are exposed. They are also outcropping near the Jordan Valley and throughout the Jerusalem Desert (Judea Desert). Young formations of Pleistocene-Holocene age are located in the Jordan Valley and along the shores of the Dead Sea as well as in the tributary of the main valley. The geological formations exposed in the study area and a brief description of the stratigraphic column in the study area is presented in Figure 2 and Figure 3.
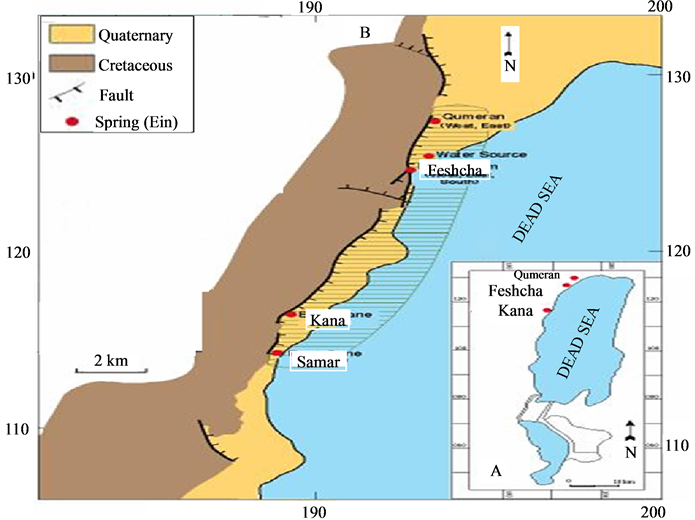
1.2. Hydrogeological Conditions
This study deals with the aquifer beneath the Jerusalem Desert (Judean Desert), a thick carbonate aquifer comprised of an upper phreatic unit overlying a confined unit, separated by a thin aquitard. The spring complex of Ein Feshcha stretches about 4 km along the North Western Dead Sea shoreline. At this location the distance from the fault escarpments to the Dead Sea ranges from 100 to 500 m. The territory comprises strata of down faulted Cretaceous, Lisan Formation as well as recent conglomerates, gravel, sand, silt and clay. Recent regression of the Dead Sea in past decades resulted in the formation of a mudflat enveloping the sea. It predominately
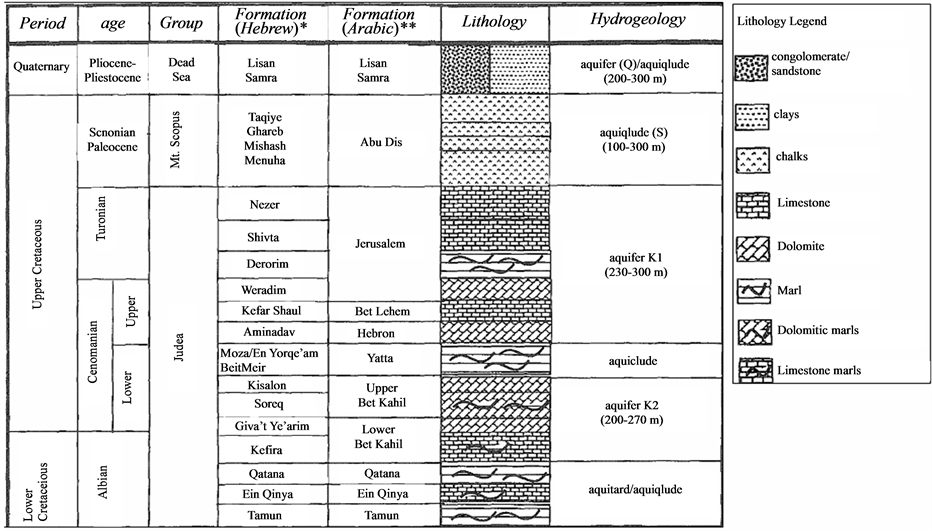
Figure 2. Generalized geological columnr section indicating the aquiferial chractaristics of the various formations [17] .
consists of grey, brown, dark-green and black clays composed of detritic illite, smectite and kaolonite in similar amounts and some minor palygorskite [20] . The clay sequence, thin laminations of white aragonite, some gypsum and well developed salt cubes are evident, representing modern deposits of Lisan Formation with similar physical and chemical characteristics.
The stratigraphic succession exposed in the study area varies from Lower Cenomanian age (Cretaceous) to young Holocene formations, attaining a thickness of approximately 1200 m. The important sequence with respect to hydrogeology is the Ajlun (Judea) Group Aquifer of Cenomanian-Turonian age with a total thickness of about 800 - 850 m in the Jerusalem Mountains (Judea Mountains) and decreases towards the south; east and west to a minimum of 600 m near Ein Gedi. It is built of karstic limestones and dolomites, separated by layers of marl and cherts.
The presented stratigraphic column includes formations of the Ajlun (Judea), Belqa (Mt. Scopus) and Lisan (Dead Sea) Groups of Lower Cretaceous to Holocene ages (Figure 2). The Ajlun (Judea) Group is exposed mostly in the western part of the area. In most of the study area Ajlun (Judea) Group Aquifer comprises of two sub-aquifers, the Upper and the Lower Aquifer, with the hydraulic separation by aquitard of 150 - 200 m is manifested in the difference of water levels of the two sub-aquifers. Belqa (Mt. Scopus) Group, essentially chalks, is exposed throughout most of the desert plateau and includes formations of Santonian to Paleocene ages. Its thickness varies from 100 m in anticlinal regions to 400 m in the synclines. The Pliocene-Holocene Lisan (Dead Sea) Group is exposed along the Dead Sea shore. It is composed of conglomerate, silt, clay and marl as well as halite, chalk and some gypsum, [21] [22] .
The predominant elements governing the geological structure and flow regime are the anticlinal and synclinal structures crossing the entire study area (Figure 4). The Hebron anticline is the principal structural element in the study area. Its axis runs from the Hebron-Halhul area to Jerusalem in a general Southwest-Northeast direction and dips in the direction of Jerusalem. This anticlinal axis represents the maximum elevation in the area. To the east and west, there are minor folds representing the descent of the structures towards the plain in the west and the Dead Sea in the east. The anticlines descend in the direction of the Jordan Valley and the Dead Sea in a series of undulations, forming secondary structures. The anticlines and synclines are asymmetric, with steepest inclinations to the eastern part of the anticlines [23] . The principal fault structure in the area is the western fault of the Dead Sea-Jordan Rift Valley. This fault runs along the western shore of the Dead Sea up to the Jericho City and its direction is North-South. Around Jericho the fault direction becomes North-West, continuing as the Ein Samiya fault strip [24] [25] .
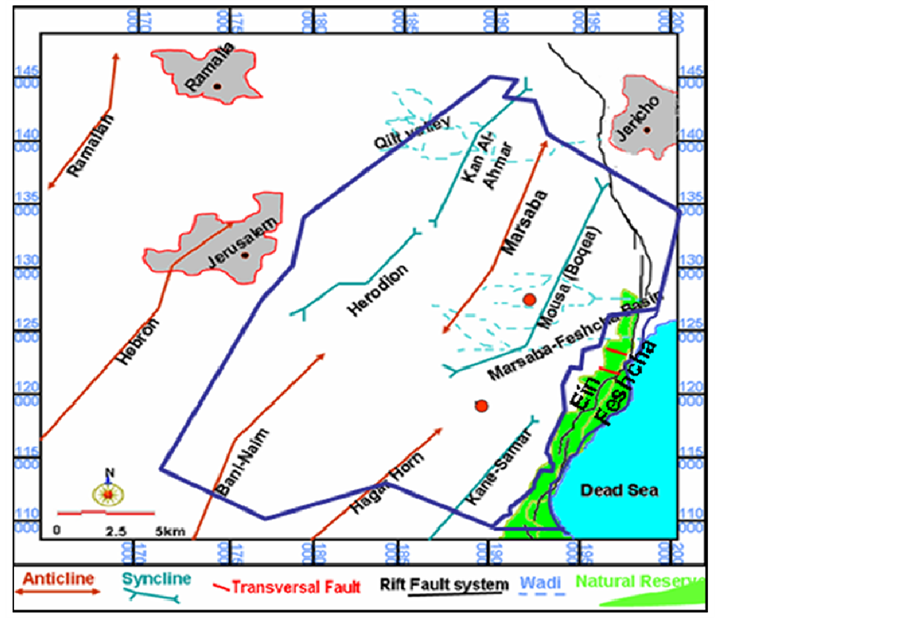
Figure 4. Structural map showing the main folds and faults in the study area.
2. Geophysical Measurement Methods
Geophysical resistivity techniques are based on the response of the earth to the flow of electrical current. In the shallow subsurface, the presence of water controls much of the conductivity variation. Measurement of the resistivity is a measure of the amount of water saturation and connectivity of pore space. Increasing water content and increasing salinity of the underground water will decrease the measured resistivity. So, increasing porosity of rock and increasing number of fractures will tend to decrease measured resistivity if the voids are water filled. The geophysical methods (VES and NOEMFE) were applied in this study, to bring information about fresh, brain or saline water bodies in the underground, but also information about the geological structure until 100 m depth. While the special electromagnetic measurements were applied to bring direct information about fractures and rupture zones in the underground. By this VES method (Schlumberger sounding), the variation of the resistivity with depth is measured, depending on the electric properties of the geologic sequences in the subsurface. The electric properties are influenced by the lithology, the saturation degree and the salinity of the fluids involved, salt water can be easily distinguished from almost any lithological combination, having a resistivity below 1 Ohm/m. In the year 1997 in unpublished report Goldman proposed guidelines for comparing water quality by resistivities in this specific area:

The NPEMFE method (CERESKOP) is depending on the measurement of natural pulsed low frequency electromagnetic radiation (EMR) signals. Generally in geosciences the detection and analysis of these signals can assist to conceive and understand deformation processes. This method detects peak values in the geogenic electromagnetic field clearly exceeding the background noise and registers the orientation of the corresponding electromagnetic waves which produced by nanofractures, and by piezoelectric, turboelectric or pyroelectric effects [26] . The main application of this method is for the detection of active fractures or faults in the upper earth crust.
3. Results
3.1. Geophysical Field Surveys
The present study was carried out due to the scarcity of boreholes, which could provide information about the main groundwater flow paths, the fresh-saline water interface, the freshwater bodies, the saline water bodies and the depth of these bodies. At Ein Feshcha study area three profiles were modeled and studied (Figure 5).
A total of 19 sounding points were carried out along the three profiles. By using the Zhody software the final resistivity values for different depths were obtained in order to look for anomalous regions. These 19 sounding points were plotted on Google satellite map (Figure 6). Along these three profiles, vertical sections are elaborated, showing the distribution of the apparent resistivity in the depth. It was found those resistivities below 1 Ohm/m and mostly below 0.6 Ohm/m are typical of the concentrated brines in the Dead Sea region which might be partly diluted. Yechieli [27] [28] noted that the resistivity of the Dead Sea brine in the subsurface along the Dead Sea shore was found to be 0.25 Ohm/m. Resistivity below 2 Ohm/m are entirely indicative of water salinity in the range of normal seawater, and cannot be a result of any lithological combination. Generally resistivity above 3 Ohm/m is considered for fresh water while the values between 1 - 3 Ohm/m are attributed to brackish water [29] .
3.1.1. Profile I
The vertical section along profile-I (Figure 7), extends from the west with the coordination of (624435/242900) to the East with the coordination of (624312/243385), starting from the main spring (1 + 2) and extending toward the Dead Sea to the east. This profile composed of 8 sounding points, in the western part of this section a
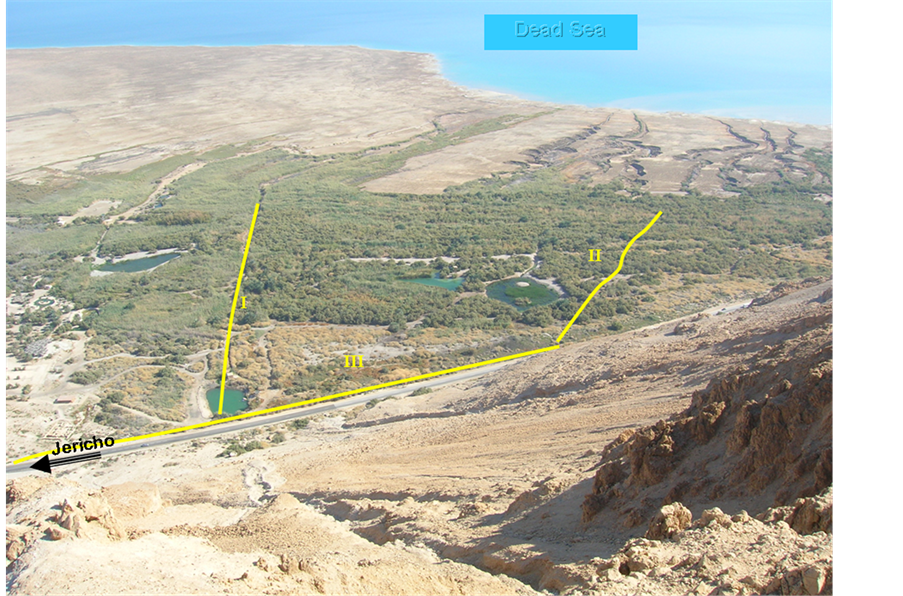
Figure 5. Location of the three profiles and the main topography of the area.
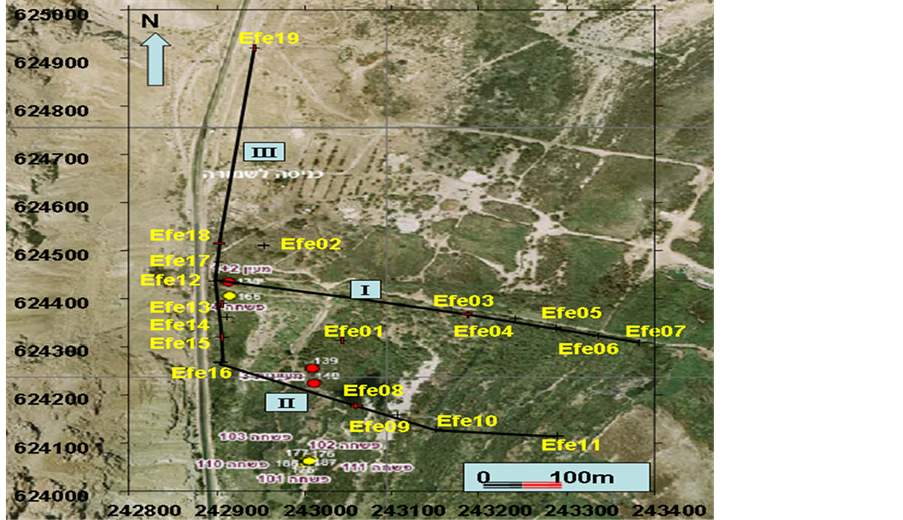
Figure 6. Satellite map with the localization of the VES-soundings on three profiles.
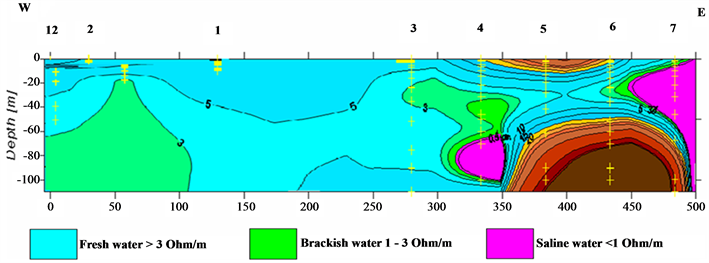
Figure 7. Vertical section along profile I.
large development of resistivity values ranges between 3 - 15 Ohm/m can be seen, suggesting the existence of fresh water over the whole investigated depth interval of 100 m. This domain corresponds to the area around Ein Feshcha main spring (1 + 2). This fresh water is being mixed with trapped saline waters leading to dilution of these saline pockets. Mixing tacks place at the vicinity of the spring at least at two points, this can be seen from the chemistry of the borehole log Feshcha-4. The chemical analysis and the lithology of borehole Feshcha-4 (Figure 8), shows that the salinity increases with increasing depth up to the depth of 37.5 m in which the maximum salinity values were EC: 26.5 mS/cm, Br: 166 mg/l and TDS: 16147 mg/l, afterwards the salinity decreases with increasing depth in which the values were lowered to EC: 11.4 mS/cm, Br: 57 mg/l and TDS: 6378 mg/l at the maximum depth of the borehole 49.5 m. This separation in mixing points could be attributed to the oily greenish clay layer found at the depth (32 m) with thickness around 4 m. This layer separates the upper layers from the lower layers. Several meters to the east two springs are exposed having the same chemical characteristics of the main spring (1 + 2) which could explain the source of water drainage from the lower layers. In the eastern part of the section, between the sounding points 5 - 7 at distance of 350 to 490 m along profile-I, starting from the depth of 60 m downward, high resistivity values up to 500 Ohm/m were measured, suggesting sedimentary rocks overlaid with sedimentary block from the late Pleistocene epoch. The borehole Feshcha-10 at Figure 8, presents the eastern lithology of profile-I, it shows that late Pleistocene-Holocene sediments are dominating the area up to the depth of 38 m and more. The sedimentary rocks are probably a block of limestone.
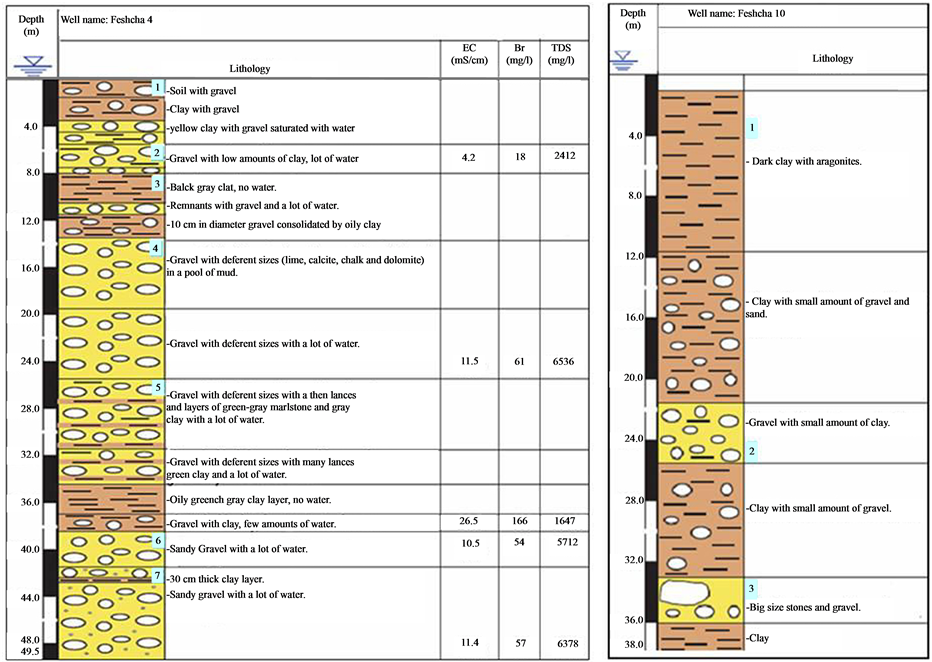
Figure 8. Lithological section presenting the lithological setting of Borehole Feshcha-4 and 10.
This block acts as a barrier in the advancing of saline water intrusion from the Dead Sea to the west not only but also it prevent the trapped water to retreat to the east, evidenced by low resistivity values, <1 Ohm/m. At sounding point 4, at distance of 300 to 350 m on profile-I, local low resistivity values suggest possible trapped saline/ brackish water, behind the assumed clay-limestone block.
3.1.2. Profile II
Profile-II extends also from the west (624263/242910) to the east (624114/243290), from the road toward the Dead Sea (Figure 6). This profile composed of 5 sounding points. The vertical section elaborated along this profile (Figure 9), shows that through the distribution of resistivity of the measured sounding points, at the depth interval 30 - 100 m at sounding point 11 resistivity values ranges between 0.35 - 0.8 Ohm/m at distance of 350 to 400 m on profile-II. According to Goldman guidelines, these low resistivity values << 1 Ohm/m are considered as brine waters and there source could be attributed to precursors of trapped Dead Sea saltwater or a retreat of Dead Sea saline waters. These low resistivity values extend toward the east through sounding point 10 until sounding point 9 in the west at distance of 200 m; this saline water is surrounded by a zone of brackish water. Near the surface, until the depth of 20 m the measured resistivity values suggest the existence of fresh water. In the western part of the section the values suggest the existence of fresh water, but over a smaller depth interval than of profile-I. At the western side of profile-II at the depth of 60 m and more a mass of late Pleistocene-Holocene sediments (clay and shales) is identified working like an aquiclude.
3.1.3. Profile III
Profile-III is located along the road, in the North-South direction (Figure 6). The coordination points of the beginning of this profile are, (624920/242944) while the end of the profile was at the coordinate of (624263/ 242910). This profile composed of 8 sounding points. On the vertical section along this profile (Figure 10), values of resistivity greater than 3 Ohm/m can be seen around the main spring suggesting the existence of fresh
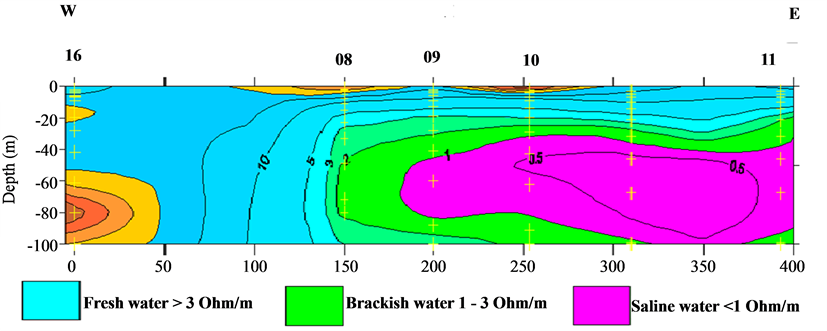
Figure 9. Vertical section along profile II.
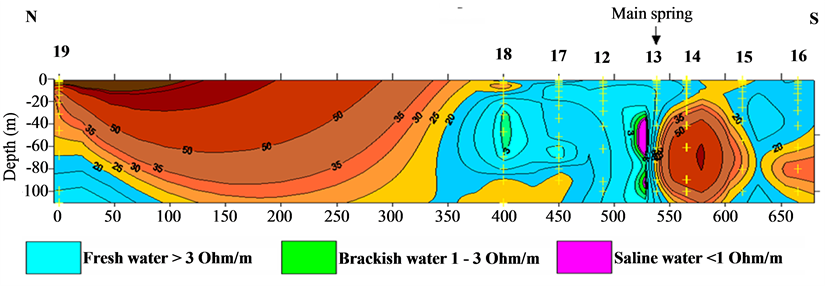
Figure 10. Vertical section along profile III.
water until a depth of 100 m. To the south of the main spring, on sounding points 14, 15 and 16, higher resistivity values were measured, suggesting the existence of sedimentary rocks overlaid with late Pleistocene-Holocene sediments (tills and clays) block, forming a barrier in the fresh groundwater flow along the North-South oriented main fault system. In the northern part of this section, at sounding point 19, the measured resistivity values suggest fresh water at greater depth, below 80 m and rising up in the southern direction toward the main spring. Between the sounding points 18 and 19, at distance of 25 to 325 m on profile-III. The soil was very dry may be due to the existence of tills filling the main fault system, the 34 resistivity measurements were not possible, therefore with the help of the available data and Zhody software the expected missing part were simulated. The results at this section suggests the existence of tills and limestone blocks, forming a barrier in the fresh groundwater flow along the North-South oriented main fault system, were exposed sedimentary rocks at the field site can be seen. At sounding point 18 low resistivity values were identified ranging between 1 - 3 Ohm/m indicating existence of localized brackish water zone at the depth of 30 up to 60 m. Very close to the main spring between sounding points 12 and 13 a mass of brackish water was identified with resistivity value ranging between 1 - 3 Ohm/m indicating existence of localized brackish water zone at the depth of 30 up to 100 m finding its way out in the main spring. Since these two localized zones are surrounded with fresh water then it can only be explained by a salt dissolution from the surrounding rocks (salt layer) and/or conduction of saline waters through associated fractures.
3.2. Electromagnetic Radiation (EMR)
Along Ein Feshcha natural reserve borders in a North-South direction along the main fault system a profile was constructed in order to localize the fractures and rupture zones in the underground. This profile was explored using the Electromagnetic Radiation (EMR) reflecting the orientations of active crustal stresses in the uppermost lithosphere. The beginning of the explored profile was at the coordinate (625000/242800) and the end of it was at the coordinate (624000/242800). Along this profile several scans East-West direction was carried out using the high-sensitive geophysical electromagnetic instrument (CERESKOP) depending on the NPEMFE-method. Through the NPEMFE-method a lot of fractures were identified, mainly along the main fault system of the Dead Sea Rift, but also two transversal faults perpendicular with the main fault, one of them crossing the main fault at the main spring (1 + 2). The first transversally fault can be seen in the field, extending in an East-West direction heading to the Dead Sea cliffs (Figure 11(a)) instrumentally this fault has been detected using the CERESKOP and it is plotted on Figure 12. The other one is located at Ras Feshcha farther to the South Figure 11(b). This fault needs to be studied in more details.
4. Discussion
The results obtained by the applied methods (VES and NPEMFE) and the field evidence gave more information about, the interfaces between fresh, brackish and saline waters. The lithological setting in the study area and localization of the faults and fractures exist in the study area. The combination of these two methods (VES and NPEMFE) with field observations gave more specific information which lead to more understanding of the mixing mechanisms. The VES measurements detect low resistivity (<1 Ohm/m) representing brines and the interface between them (brackish water) as well as the overlying fresher water bodies. In addition, high resistivity values >3 Ohm/m representing freshwater are also detected, underlying the brines. The presence of fresh water until a depth of 100 m in the area around the main spring (1 + 2) was shown also by the obtained distribution of the measured resistivities on profile-I. The only explanation for the fresh water source in Ein Feshcha is from Judea Mountains finding its way through the West-East transversal fault number 10. The occurrence of localized low resistivity water bodies (1 - 3 Ohm/m) in sounding points 2 and 12 on profile-I can be interpreted as a result of the existence of fracture number 1 and 2. These fractures may conduct waters with lower resistivities leading to mixing of the two water types. The source of the brackish water could be related to ascending brines across the fractures/salt dissolution. In the southern direction, immediately south of the main spring on profile-III, the resistivity values indicate the presence of a limestone block, displaced along a transversal fault, forming probably a barrier in the flow direction of the fresh water, obliging it to flow out and forming the main spring. Such a block was also signalized on profile-I, forming barrier in the advancing of the saline water from the Dead Sea toward the west. The occurrence of low resistivity water bodies until the investigated depth of 100 m, on profile-II, can be interpreted as trapped residual brines or salts, related to earlier Dead Sea base levels. These brines are mostly found in the East, closed to the Dead Sea base level and it has a horizontal development.
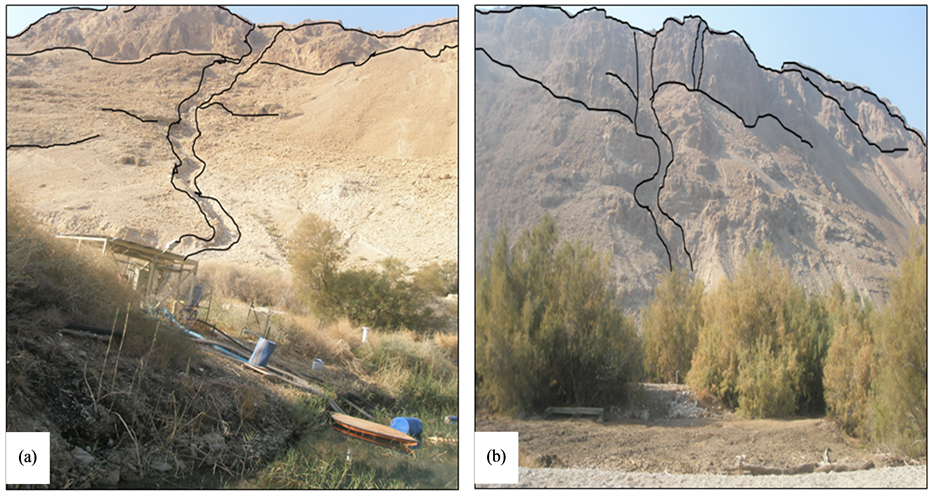
Figure 11. (a) East-West transversal fault crossing the main spring; (b) East-West transversal fault at Ras Feshcha.
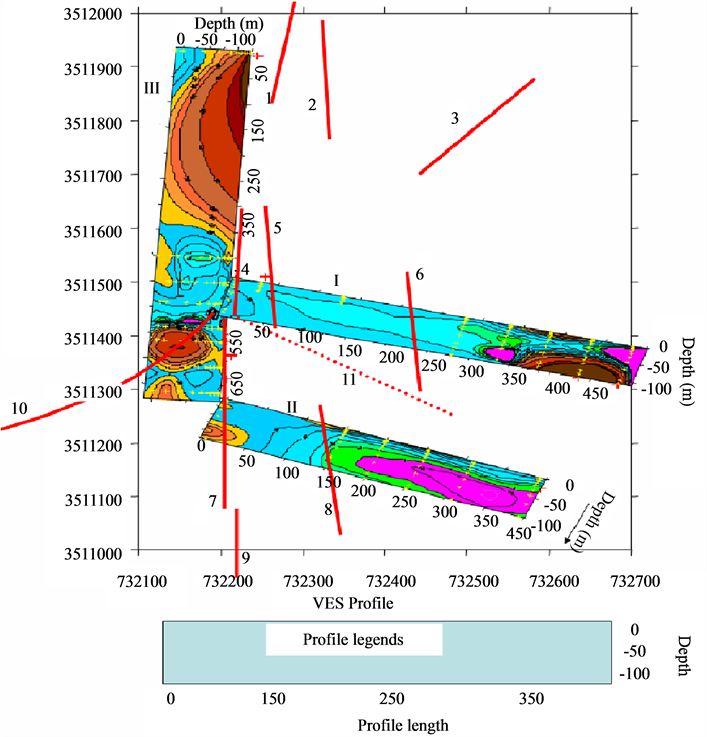
Figure 12. Fractures localized by combination of the stress variations using NPEMEF and VES method.
5. Conclusion
The outcome of the geophysical analyses method presented the existence of late Pleistocene sediments (tills and clays) block, forming a barrier in the fresh groundwater flow along the North-South oriented main fault system. The localized fractures and faults found working as barriers and/or conductors as well as the lithology barrier explain some of the water mixing mechanisms. The combination between all of what have been analyzed and noticed in the field, a schematic cross section can lead to fresh groundwater inflow from the aquifer to the spring area, the ascending brines along the fault forming a soft salt body in the shallower combined aquifer with an interface causing the overflow of the fresh water, a possible diaper shown here reasonably in larger depth as well as the discharge of the mixed brackish water in the Dead Sea sediment sequence. It can be concluded that the existence of brackish water above and below the saline domain and the variation of water quality even over short distances implies multiple hydrological aquifer systems and a fracture flow system controlling the Ein Feshcha springs. Understanding this concept will help to evaluate the impact of the groundwater extraction on the heads and flow patterns in the aquifer and to locate extraction wells.
Acknowledgements
We gratefully acknowledge the financial and logistic support provided by SMART project at KIT University which is funded by the German Federal Ministry of Education and Research (BMBF). Special regards to the staff of natural reserve Ein Feshcha for their support and understanding. Special thanks also go to the reviewers for their efforts for improving and finalizing the outcome manuscript.
References
- Khayat, S. (2005) Hydrochemistry and Isotope Hydrogeology in the Jericho Area/Palestine. PhD thesis, University of Karlsruhe, Karlsruhe.
- Hasan, J., Hoetzl, H., Flexer, A., Marai, A. and Ali, W. (2009) Nature and the Origin of Ein Feshcha Springs (NW Dead Sea). PhD Thesis, Karlsruher Institut für Technologie, Karlsruhe.
- Wishahi, S. and Khalid, M. (1999) Hydrochemistry of the Jordan Valley Aquifers, Water and Environment. Palestinian Hydrology Group, 12-21.
- Fink, M. (1973) Possibilities for Groundwater Utilization in the Northwestern Basin of the Dead Sea. TAHAL Consulting Engineers Ltd Report No. 01/73/02: 39.
- Shachnai, E., Miro, F. and Meiri, D. (1983) Hydrogeological Survey in Tsukim Springs. TAHAL Consulting Engineers Ltd Report No. 01/83/98 (in Hebrew).
- Greenboim, J. (1992) Discharge Measurements in the Tsukim Springs in 5-6.8.92. Isr Hydrological Service Water Commission (in Hebrew).
- Greenboim, J. (1993) Measuring Flow Parameters in the Tsukim Springs (En Fescha). Isr Hydrological Service Water Commission (in Hebrew).
- Guttman, Y. and Simon, A. (1984) Hydrogeological Survey of the Western Shore of the Dead Sea Mediterranean-Dead Sea Project. Summary of Research Reports in Hebrew, 5, 304-318.
- Guttman, Y. (1998) Hydrogeology of the Eastern Aquifer in the Judean Hill and Jordan Valley. TAHAL Consulting Engineers Ltd Annual Report 1997, Subproject B: 01/95/66, 6440-R98.006 (in Hebrew).
- Hotzl, H., Ali, W. and Rother, M. (2001) Hydrogeological Investigations for the Development of Sustainable Fresh Water Extraction of the Mar Saba-Ein Feshkha Region. Annual Report BMBF Project Nr. WT0063 Karlsruhe, Germany.
- Hotzl, H., Ali, W. and Rother, M. (2001) Ein Feshkha Springs as a Potential Reservoir for Fresh Water Extraction, Dead Sea Area. Le premier colloque national d′hydrogeologie et environment, Fes, 62.
- Rophe, B. (2003) Discharge to Zsukim (Fescha) Springs-Summer 2003. Isr Hydrol Serv Israel Water Commission.
- Rofe & Raffety CE (1963) Geological and hydrological report, Jerusalem and district water supply. Central Water Authority of Jordan Westminister, London, 79.
- Rofe & Raffety CE (1965) Nablus District Water Resources Survey: Geological and Hydrogeological Report. Central Water Authority of Jordan Westminister, London.
- Rofe & Raffety CE (1965) West Bank Hydrology: Analysis Report. Central Water Authority of Jordan Westminister, London.
- Blake, G.S and Goldschmidt, M.J. (1947) Geology and Water Resources of Palestine. Government of Palestine, Department of Land Settlement and Water Commissioner, Jerusalem.
- Marie, A. and Vengosh, A. (2001) Sources of Sallinity in Ground Water from Jericho Area, Jordan Valley. Groundwater, 39, 240-288. http://dx.doi.org/10.1111/j.1745-6584.2001.tb02305.x
- Arkin, Y., Braun, M., Starinski, A., Hamaoui, M. and Raab, M. (1965) Type Sections of Cretaceous Formations in the Jerusalem-Bet Shemesh Area. Geo Surv Isr, 42.
- Arkin, Y. and Hamaoui, M. (1967) The Judea Group (Upper Cretaceous) in Central and Southern Israel. Geo Surv Isr Bulletin, 63.
- Kafri, U., Goldman, M. and Lang, B. (1997) Detection of Subsurface Brines Freshwater Bodies and the Interface Configuration in-between by the Time Domain Electromagnetic Method in the Dead Sea Rift, Israel. Environmental Geology, 31, 42-49. http://dx.doi.org/10.1007/s002540050162
- Nathan, Y., Shuval, S. and Sandler, A. (1992) Clay Sediments from the Dead Sea. Isr Geo Sur Reports No. GSI/21/92.
- Ben-Itzhak, L. and Gvirtzman, H. (2005) Groundwater Flow along and across Structural Folding: An Example from the Judean Desert, Israel. Journal of Hydrology, 312, 51-69. http://dx.doi.org/10.1016/j.jhydrol.2005.02.009
- Flexer, A., Bensabat, J., Guttman, J. and Yellin-Dror, A. (2001) A 3-D Hydrogeological Model of the Marsaba Feshchah Region. Project No. WT0004.
- Begin, Z. (1974) Geological Map of Israel, Jericho1:50,000, with Explanatory Notes. Geo Surv Isr Sheet 9-III.
- Begin, Z., Ehrlich, A. and Nathan, Y. (1974) Lake Lisan, the Pleistocene Precursor of the Dead Sea. Geo Surv Isr Bulletin, 63, 30.
- Bahat, D., Rabinovitch, A. and Frid, V. (2005) Tensile Fracturing in Rocks: Tectonofractographic and Electromagnetic Radiation Methods. Springer, Berlin, 569.
- Yechieli, Y., Magaritz, M., Levy, Y., Weber, U., Kafri, U., et al. (1993) Late Quaternary Geological History of the Dead Sea Area, Israel. Quaternary Research, 39, 59-67. http://dx.doi.org/10.1006/qres.1993.1007
- Yechieli, Y., Ronen, D. and Kaufman, A. (1996) The Source and Age of Groundwater Brines in the Dead Sea Area as Deduced from 36Cl and 14C. Geochimica et Cosmochimica Acta, 60, 1909-1916. http://dx.doi.org/10.1016/0016-7037(96)00065-8
- Palacky, G. (1987) Resistivity Characteristics of Geological Targets. In: Nabighian, M., Ed., Electromagnetic Methods in Applied Geophysics-Theory, Society of Exploration Geophysicists Tulsa, OK, 53-129.