International Journal of Geosciences
Vol.4 No.7(2013), Article ID:36960,10 pages DOI:10.4236/ijg.2013.47101
2-D Seismic Reflection Method Using Iso Velocity Method of Mianwali Area
1Department of Geophysics, China University of Geosciences at Wuhan, Wuhan, China
2Institute of Geophysics and Geomatics, China University of Geosciences (Wuhan), Wuhan, China
3Department of Earth Science, Qauid-i-Azam University, Islamabad, Pakistan
Email: nasirkhan.geophysicst@hotmail.com
Copyright © 2013 Nasir Khan et al. This is an open access article distributed under the Creative Commons Attribution License, which permits unrestricted use, distribution, and reproduction in any medium, provided the original work is properly cited.
Received May 28, 2013; revised July 1, 2013; accepted August 4, 2013
Keywords: Seismic Reflection Method Using Iso Velocity Methods; Formation Evaluations; Seismic Processing & Interpretation
ABSTRACT
A seismic reflection of Line 12-B belonging to Mianwali Re-entrant was acquired and processed for 2-D interpretation. The line orients itself NNE-SSW direction. The sections have the shot points from VP-199 to VP-1044. Eleven Reflectors R1, R2, R3, Base Miocene, Pinchout P1, P2, P3, P4, P5P6 (Pinchout) are marked and a basement has been marked and interpreted. All the reflectors above the basement show a downward bending at the center. The depth of each reflector was calculated by iso velocity contour map method. The depth section obtained by this method shows stratigraphic features like Pinchouts. The reflectors are then correlated with the subsurface structures and stratigraphy of the area.
1. Introduction
A 2-D seismic reflection line for shallow targets in Upper Indus basin was acquired. The data was acquired and processed along the line in Mianwali East area. The basic purpose of study is to analyze the structural and stratigraphic traps using the time section and depth section and to get the idea about the lithology of reflector and thus to determine their probable ages. We thus calculated the depth of the marked interfaces using the iso velocity method and thus have constructed a model of the subsurface to establish an effort to planned 3-D survey. The FK-Migrated Filtered Stacked section is along line 904-MWI-12B. The line extends 81 km approximately in the NNF-SSW direction. Vibroseis being used as a source shows points VP-199 to VP-1044. It is a 30-fold data representing 17 CDP‑windows. Each window shows the two-way travel time of the waves, their RMS and INT velocities. The datum lies 150 m above sea level and the time data is of 4 seconds.
2. Geology and Strategraphic Setting of the Area
The location of the area is shown in Figure 1. It is obliquely traversed by the river Indus; this area covers the northern part of Mianwali district. The coordinates that bound the area are Latitude = 32˚ to 33˚ and Longitude 71˚ to 72˚. It covers an area of 4000 Km2. The base map (Figure 2) is showing the orientation of seismic profiles including the 904-MNW-12B with Well locations is shown in the figure while Figure 3 shows the section showing stratigraphic sequence of salt range and transindus ranges as depicted by [1].
The area of Mianwali reentrant/depression lies within the North West Himalayan fold and Thrust belt [2]. We can say it lies within salt range and kohat-potwar fold belt. This east-west trending fold belt comprises the low rolling hills and valleys of the uplifted Kahat-Potwar Plateaue, the Salt Range and its westward extensions . It is about 85 km wide and extends for about 200 km. It is a discrete structural zone bounded in the north by the north-dipping Main Boundary Thrust [3-5]. and the Salt Range Thrust, Kalabagh Fault and the Surghar Thrust form its southern boundary. West and eastward it is terminated by the N-S oriented Kurram Thrust.
The geologic and stratigraphic setting of Mianwali re-entrant can be discussed within the context of regional stratigraphy and geology as Mianwali reentrants forms the part of northward title Punjab platform rising gradually to south east towards Sargodha high. Sinous arrangement of
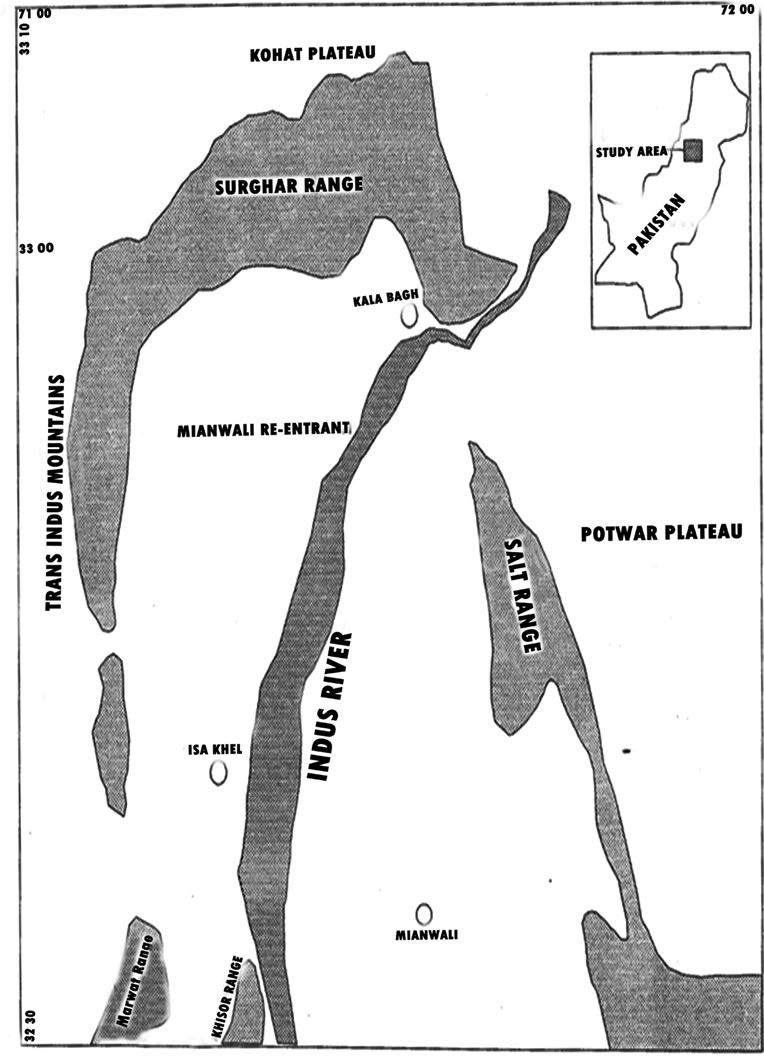
Figure 1. Mianwali Area.
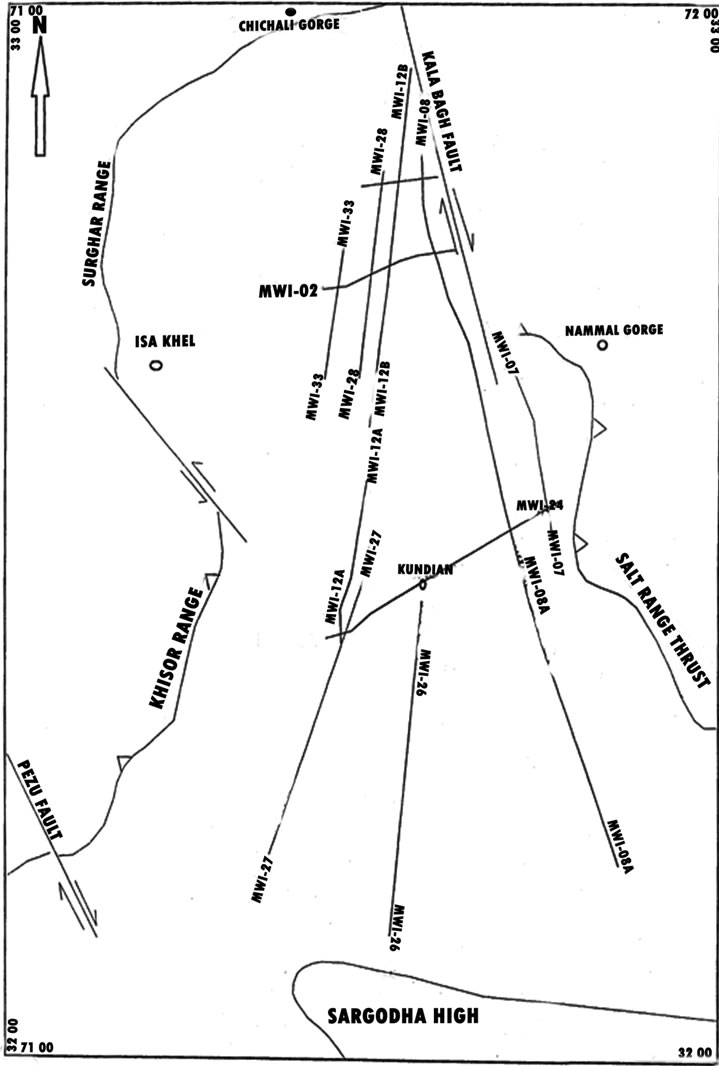
Figure 2. Base map of Mianwali Area.
up thrusted western salt range, Sarghar and Khisor Ranges surrounded the area on three sides exposing rock as old as infra Cambrian [6] as shown in geologic map (Figure 4).
A stratigraphic correlation has been done in line of cross section from Nammal and Chichali gorges and on the basis of formation tops from well kundian, Isakhel. Location and line of section shown in Figure 5 and Fence diagram is shown in Figure 6. The Lower tertiary strata is present in Nammal and Chichali gorge while it is absent in Isakhel and kundian well i.e. lower tertiary strata is absent in reentrant. In Isakhel well Jurassic is overlain by Siwalikhs in which cretaceous and lower tertiary strata is absent. In Nammal gorge section cretaceous strata is absent. In Chichali gorge section, Strata older than Mesozoic is not exposed. In Kundian well Permian strata is overlain by Siwalikhs. This shows that as we go towards southward. We find the strata towards lower tertary to permain become gradually absent. Source rocks rich in genetic potential and thermally mature exists in Triassic, Cretaceous and Paleocene sequences. Significant oil seeps occurs in surrounding ranges.
A sedimentary sequence ranging from Eocambrian to Recent is exposed in the Miawali Area. All the rocks exposed in the area are of sedimentary in origin. These comprise of Eocambrian evaporates (Salt Range Formation) and shallow marine to non-marine Lower to Middle Cambrian sequence of dolomites, shales and sandstones (Jhelum Group) which are unconformably overlain by a thick Permian clastic and carbonate succession (Nilawahan and Zaluch Groups). The stratigraphic sequence in Mianwali area is highly fossiliferous The Muree formation of Miocene age contains marls, conglomeratic sandstone and sandstone olive green colour. The Sakesar limestone of Eocene contains marl and fossiliferous limestone of light cream color also the Nammal formation of Eocene contains marl and limestone light grey colour. The Patala formation of Paleocence contains marl and fossiliferous lime stone of light cream colour, also the Nammal formation of Eocence consists of marl and limestone of Light grey colour. The Patala formation and Lockhart limestone of Paleocene consists of dark grey color shale and Marl and limestone, highly fossiliferous respectively. The data formation of Jurassic age have sandstone, clays of variegated color, The Triassic age has three formations which are Kingriali formation, Tredian formation, Mianwali formation consists of dolomite and sandstone of pinkish color and marl, siltstone ,sandstone sandy limestone of maroon color respectively. The Permian age have two formation in the area the names are Chiddru formation and Wargal limestone which are consists of marl, calcareous sandstone and marl, limestone which are highly fossiliferous of dark to light grey respectively The area is characterized by strong folding and thrust faulting; the major
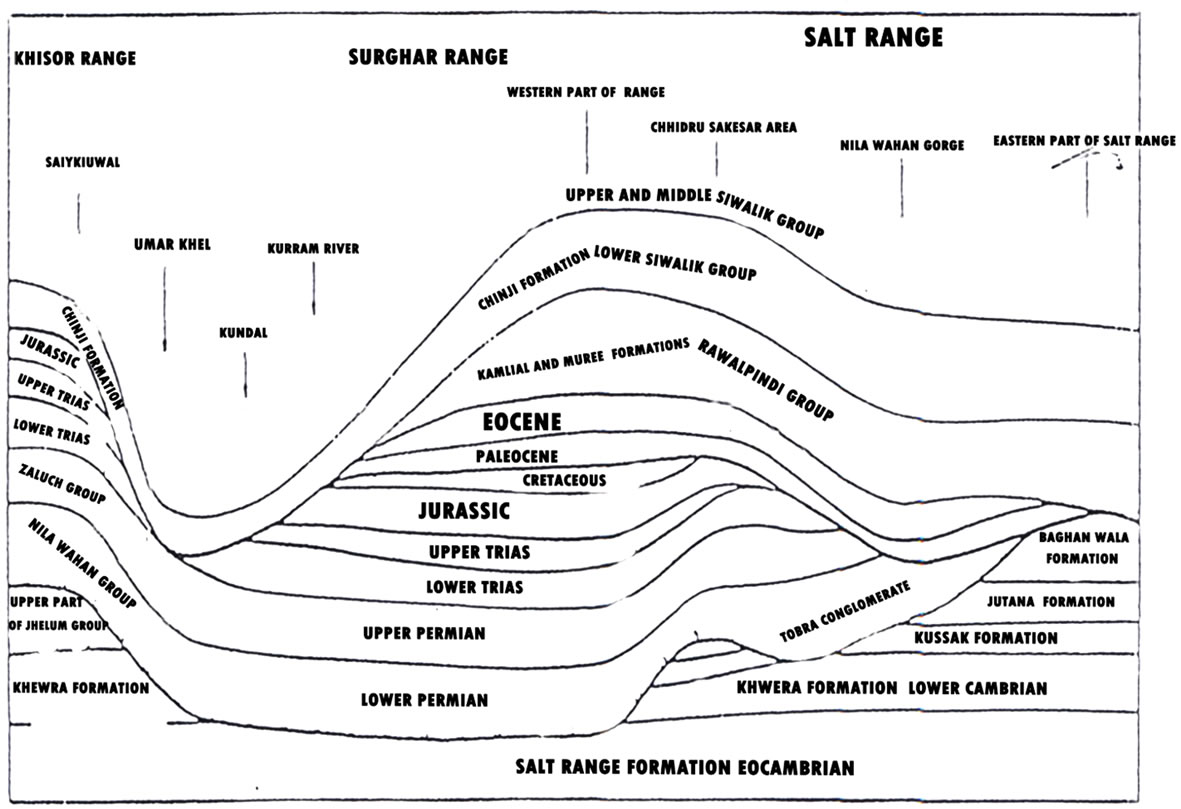
Figure 3. Stratigraphic sequence of salt range and trans-indus ranges.
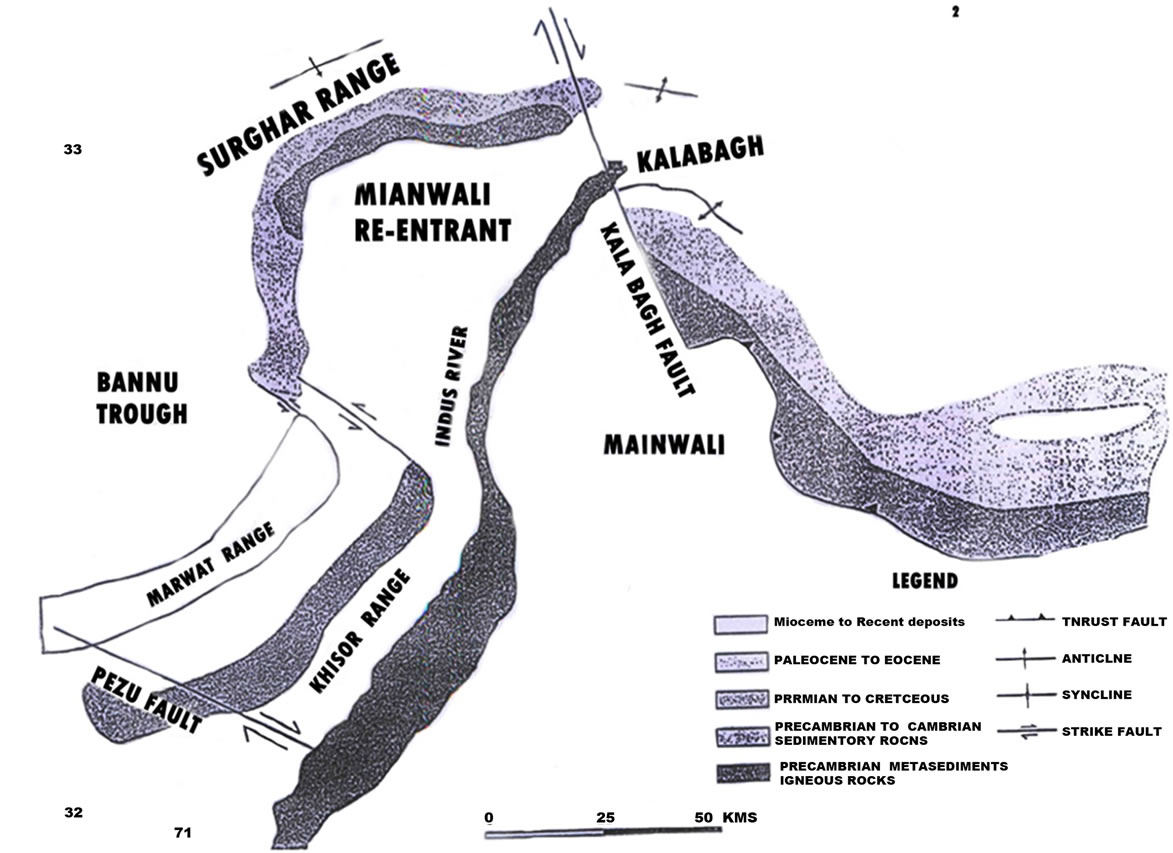
Figure 4. Map showing geology and tectonics of Mianwali Area.
structural trends change from east trending in the western part of the area to northeast trending in the eastern part of the area. The Paleozoic, Mesozoic, and Cenozoic sequence exposed in the Area underlies the alluvial cover of the Jhelum and Indus Plains south of the study area [5]. Exploratory drilling immediately south of the area has shown that pre-Miocene erosion has removed Cambrian to Eocene rocks in that area [7]. The details study shows that area is the thrust-related tectonics .The porosity pinchouts and lithofacie variation traps likely to exist in this area.
For detailed engineering geological investigations [8]. have distinguished sandstones in to nine beds from highest to lowest in the sequence. These rocks have geotechnical importance due to the presence of Mangla and proposed Kalabagh dams. The claystone/siltstone beds present in the area need special attention because of their problematic nature [9]. Shear zones are encountered in claystone/siltstone beds. The shear zones seriously affect the geotechnical behaviour of these rocks. The presence of shear zones in claystones/siltstone renders a great difference in the intact and residual strength parameters [10].
3. Field Data Acquisition and Seismic Data Processing
The base map of the Location area is shown in Figure 2 and the field data acquisition and recorded parametrs are given in the table below.
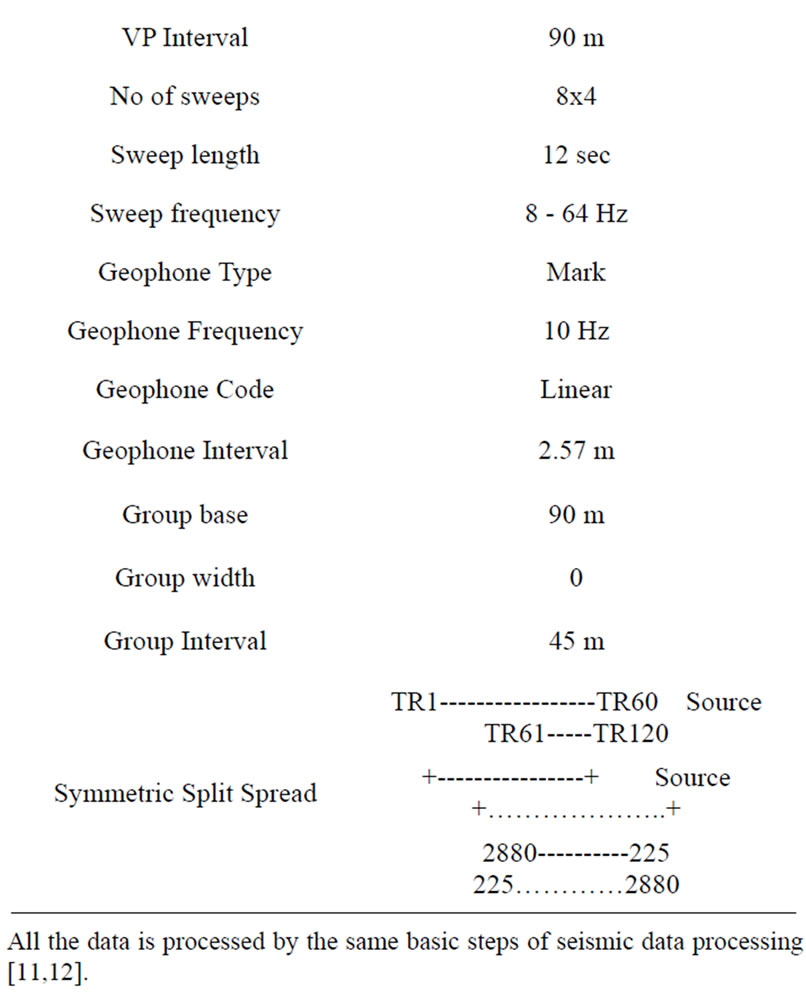
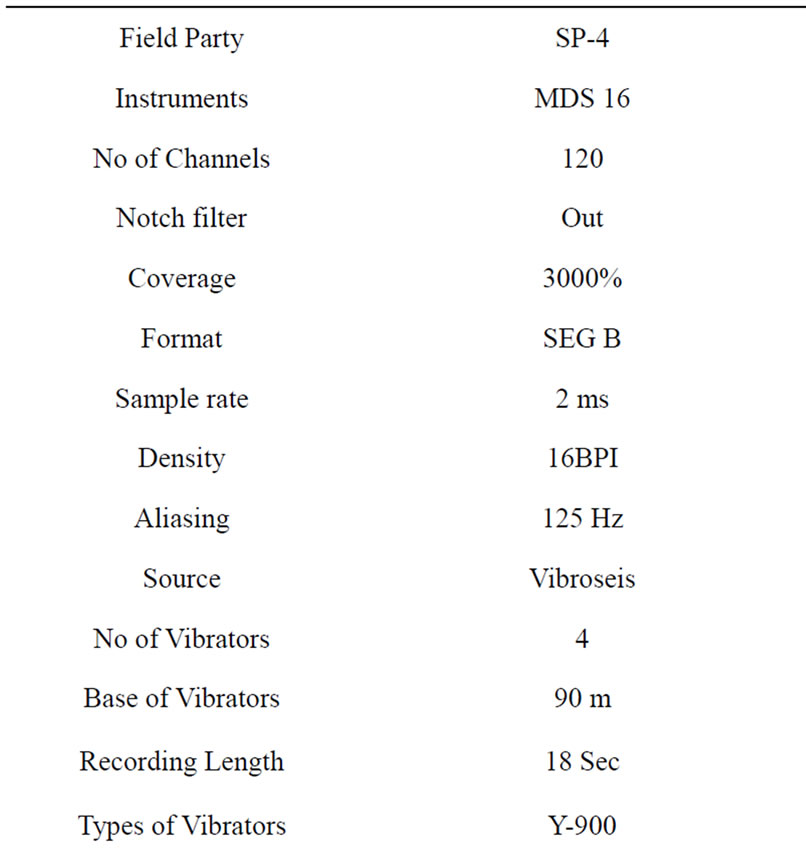
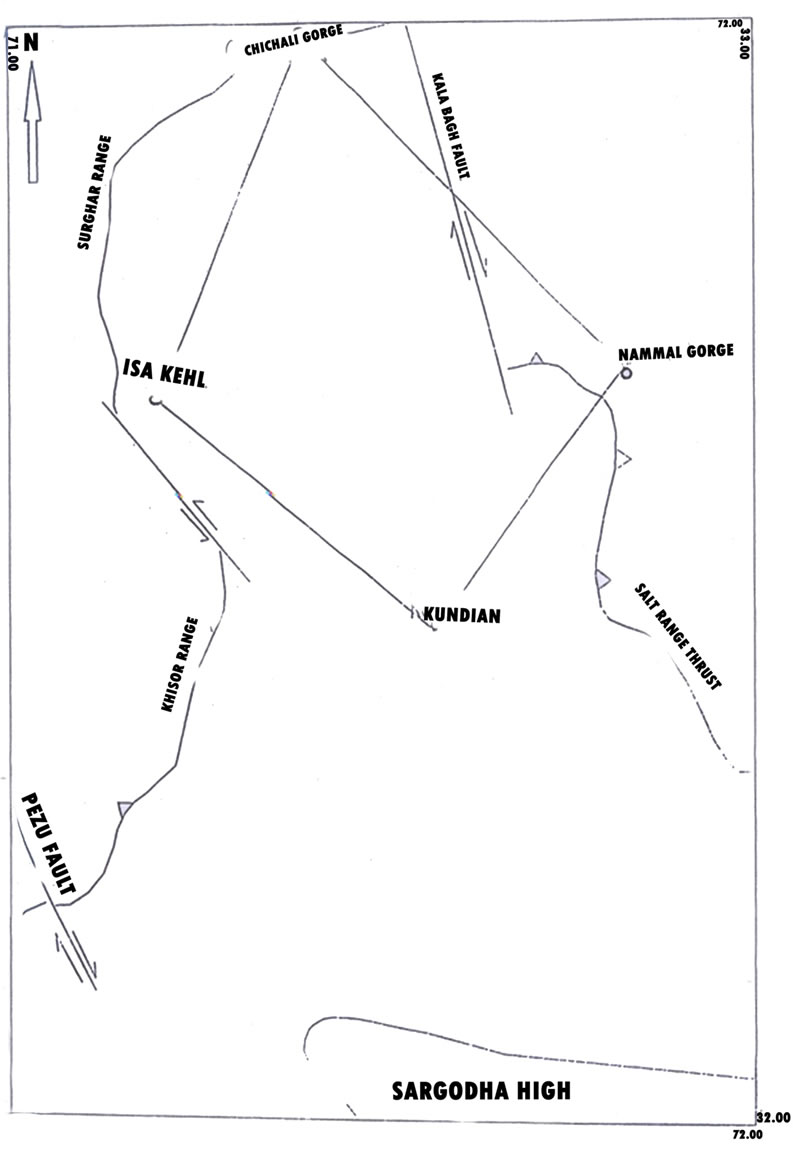
Figure 5. Map showing the line of section for corelation purpose.
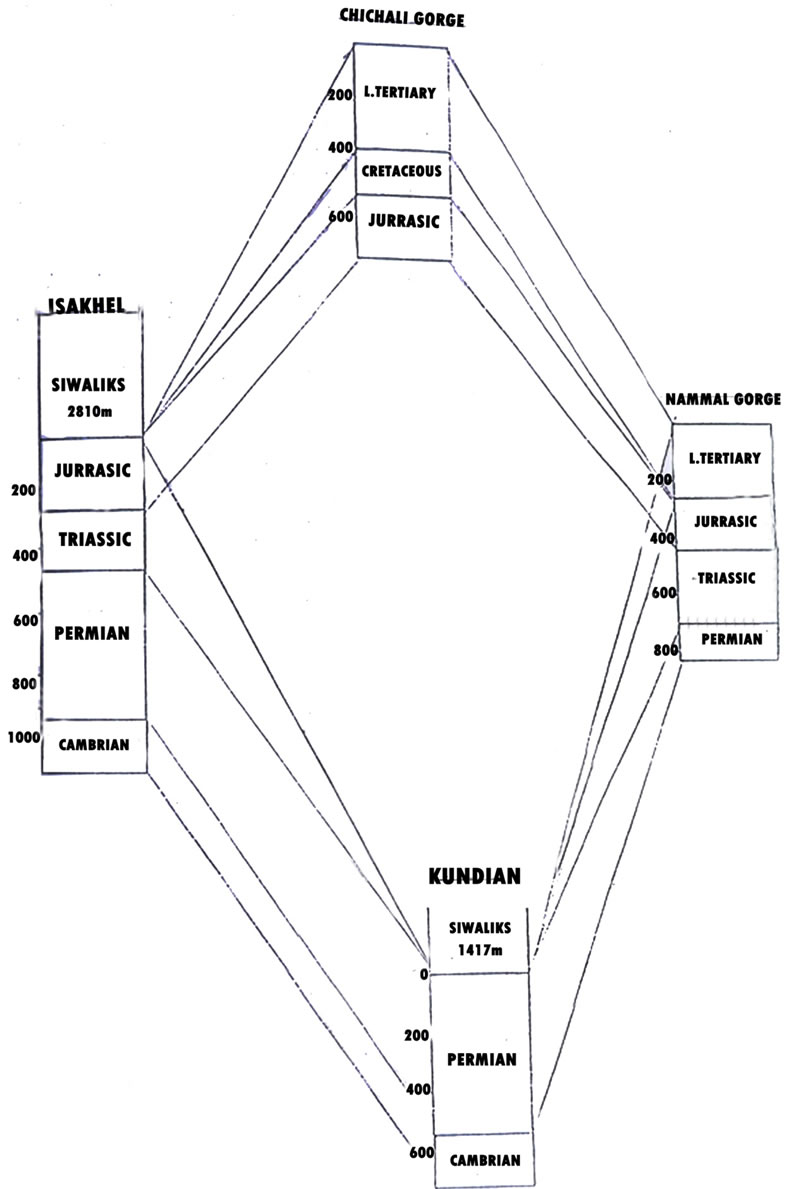
Figure 6. The fence diagram.
4. Seismic Interpretation
Seismic interpretation revels the subsurface geological nature of earth, a fruitful interpretation of geophysical data and proving their geological significance by checking as well as integrating them with all types of geological information the influence of varying geological conditions is eliminated along the profile to transform the irregular recorded travel times into acceptable subsurface model, this is important for the confident for depth geometry of bed rock or target horizons [13].
The seismic data could be interpretated into modes. In the area of subs tensional well control in which well information is tight to the seismic information and then this seismic interpretation are applied to the zone of intrest. In the second mode when the area has no well control the seismic velocity data provide both definition of structures and estimates of depositional environment. There are two approaches for interpretation of seismic section i.e. Stratigraphic and Structure analysis. [14,15]. The application of structural analysis of seismic is in the search of structural traps containing hydrocarbons. The stratigraphic analysis involves the subdivision of Seismic section into sequence of reflection that are interpretated as seismic expression of genetically related sedimentary sequence
4.1. Geological Model of Mianwali Area
The regional and localized geologic setting in and around the Mianwali re-entrant is already discussed in above geology section [16] keeping that in view the geological data including surface geologic sections and well data has been incorporated to understand the geological Frame work of the area and to develop an imaginary model based on geological information. In this prospective two cross section have been made on the basis of surface geology and well data.
4.2. Cross Section X
We have been made Cross-Section X from Chichali gorge section located in Surgahar range to well kundian, Isakhel, well. The orientation of cross section is N-S. In the Chichali gorge strata, of Eocene to Jurassic Level are exposed while in the kundian well Siwaliks directly overlies the Permian strata. Strata younger than Permian is absent in kundian well which may be due to erosion and cross section shows that strata from Eocene to Permian is being truncated against unconformity based Miocene.
4.3. Cross Section Y
This Cross Section Y is E-W orientated and it has been made on the basis of Nammal gorge section and kundian and Isakhel Well. The well data has formation tops and thichness. In the Nammal section Eocene to Cambrian strata is exposed while is the kundian well Siwaliks directly overlie the Permian strata. In Ehsa Khel Well Siwalik overlies the Jurassic strata. In Ehsa Khel Well strata from Jurassic to Cambrian has been encountered while in the strata lower tertiary is absent on the basis on this cross section. It can be said that older strata is being truncated against base Miocene and younger strata has been eroded while in the southern part near kundian there has been more Erosion, which has eroded all starta younger than Permian.
A conceptual geological model can be made on basis of X and Y Cross Section and incorporating regional and localized stratigraphic and Structural frame work of the area. Surghar range is thrusted upon the Punjab plate form below the thrusted there is depression of Mianwali area, in which very thick accumulation of Siwaliks are present and older strata in gradually being truncated against base Miocene unconformity. The erosion and truncation may be due to uplifting of Sargodha high, the strata from lower tertiary to Cambrian are present is surrounding areas around Mianwali in western salt range and trans Indus ranges which indicates the starta from Eocene to Cambrian has been deposited in the area but eroded later on.
4.4. Seismic Interpretation
The foremost and major step in seismic interpretation to is mark or identifies the reflections. On the seismic sections, this can be drawn with the help of
• depth of formation from tops from the well;
• Using average velocities and interval velocities derived during Processing of Seismic data;
• Geologic and Seismic Character of Different Lithology.
So for the Identification and correlation purpose of each reflection on seismic section, average thickness of starta should be used, these average thickness has been calculated by using thickness of sedimentary strata from the well (kundian, Isakhel, well) and surface geologic section(Nammal and Chichali)
In the given seismic section, numbers of prominent reflectors are present. Out of these eleven reflectors has been marked and interpretated in time domain by calculating their velocities and converting these velocities into depth, for this purpose lithological well data of Isakhel located east of seismic lines has also been used since the well is located at some distance from the lines we cannot solely rely upon it has been used to roughly estimate the thickness of different formations.
4.6. Dix Isovelocity Contour Map
The given seismic section is provided with root mean square interval and average velocities at selected CDP,s. An average velocity contour map, which is shown in Figure 7, is obtained by time verses CDP,s the axis showing the CDP,s are then converted to vibroseis point interval for same velocity interval. The countour are passed at 100 m per second interval, the average velocity on time t = 0, t = 5 sec vary from 1500 m/s to 4600 m/s
4.7. Time Section
A seismic section with displays reflection arrival time variation along the profile is called a time section. The position of reflection on time section of course depends on velocity difference as well as on layer thickness. The undulation of dips of deeper reflectors is not clearly displayed on the time sections. The time section has been prepared by observing the time of reflection under each VP then by plotting VP,s value along horizontal axis and time along vertical. We get the time section as it is shown in Figure 8.
4.8. Depth Section
A seismic section that displays the reflectors depth is
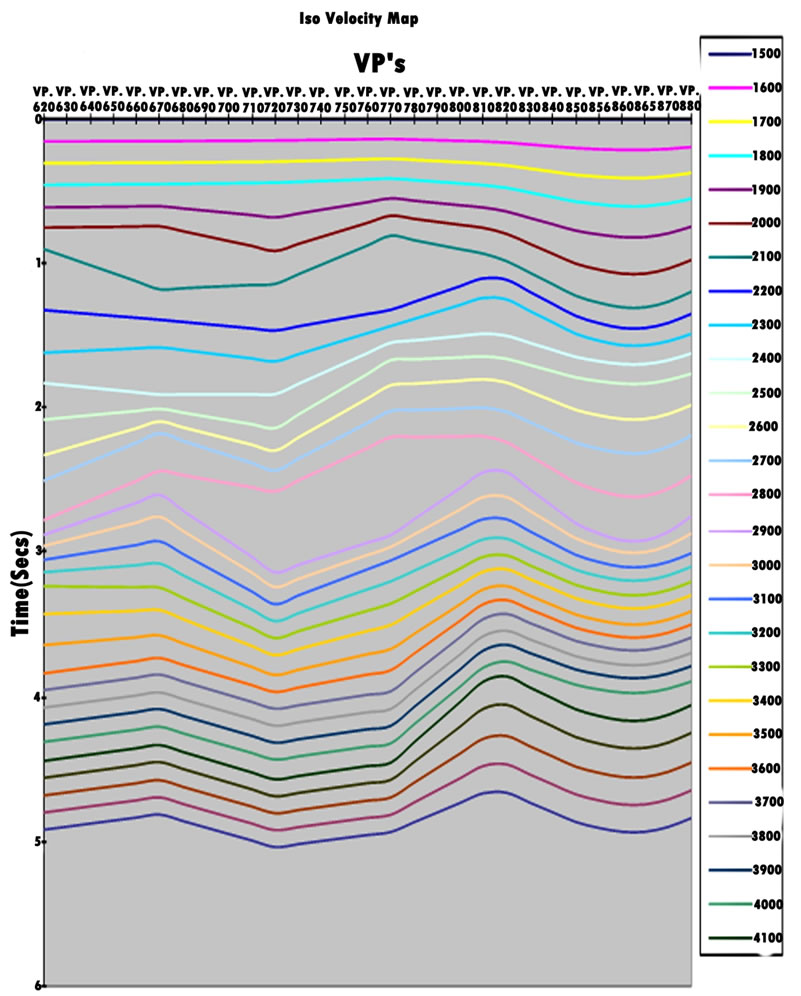
Figure 7. Iso velocity map.
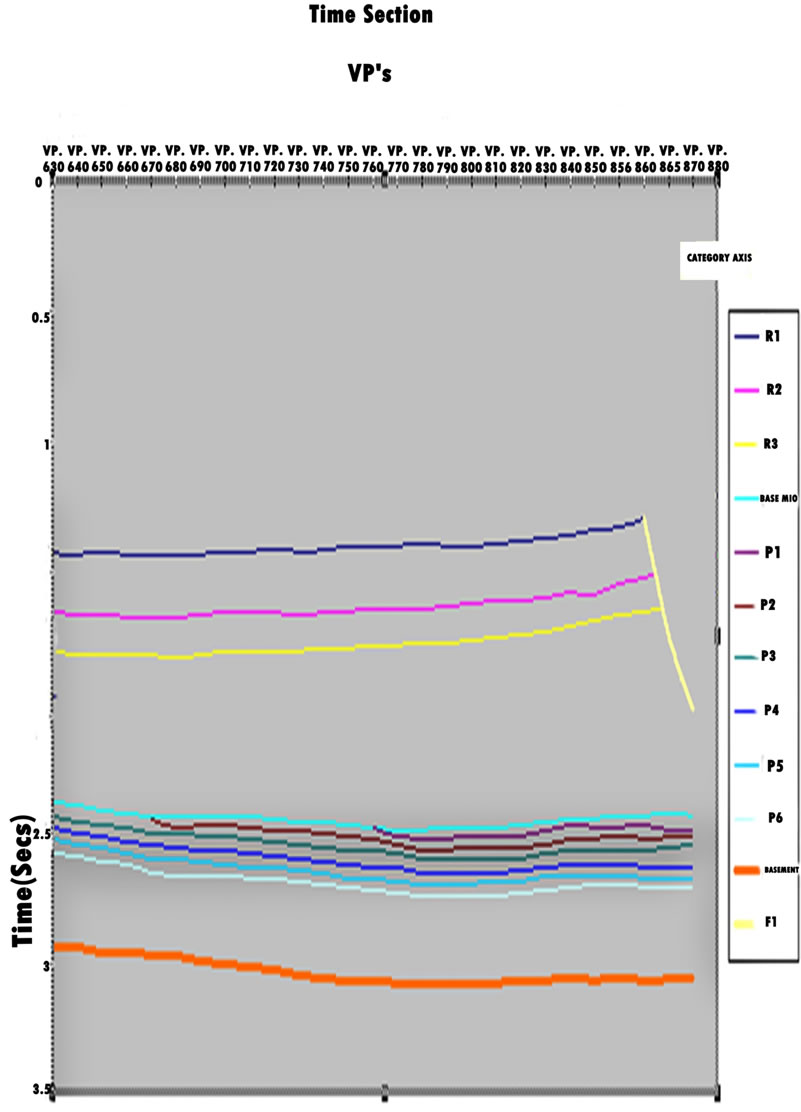
Figure 8. Time section.
called the depth sections the depth sections clearly displays the undulations and dips of deeper reflectors. The wavelet positions depend only on layer thickness. and depth section by isovelocity methods is prepared by superimposing the time sections over isovelocity maps and then measuring the velocity of the reflectors by methods of interpolations under the Vibroseis Point, then the time of reflectors is multipled with the velocity of reflectors and then dividing it by two we get the depth value. This Procedure is applied for all reflectors.
MathematicallyDepth = (V) * (T/2)
If datum lies above MSL, it is to be subtracted from all depth value which then gives the true depth. The depth value reflector varying between the different time intervals as below:
R1 lies between time interval t = 1.25 sec to 1.435 sec it depth calculated by isovelocity method is vary as 1146.8 m to 1464.3 m.
R2 lies between time interval t = 1.471 sec to 1.467 sec it depth calculated by isovelocity method is vary as 1877.025 m to 1518.8 m.
R3 lies between time interval t = 1.62 sec to 1.825 sec it depth calculated by isovelocity method is 2126 m.
R4 lies between time interval t = 2.385 sec to 2.485sec it depth calculated by isovelocity method is vary as 3442 m.
R5 lies between time interval t = 2.47 sec to 2.52sec it depth calculated by isovelocity method is vary as 3543.3 m.
R6 lies between time interval t = 2.45 sec to 2.56 sec it depth calculated by isovelocity method is vary as 3526.65 m.
R7 lies between time interval t = 2.44 sec to 2.6 sec it depth calculated by isovelocity method is vary as 3710 m.
R8 lies between time interval t = 2.48 sec to 2.65 sec it depth calculated by isovelocity method is vary as 3690.13 m.
R9 lies between time interval t = 2.525 sec to 2.7sec it depth calculated by isovelocity method is vary as 3919.6 m.
R10 lies between time interval t = 2.575 sec to 2.725 sec it depth calculated by isovelocity method is vary as 4039.7 m.
R11 lies between time interval t = 2.93 sec to 3.08 sec it depth calculated by isovelocity method is vary as 4996.9 m.
4.9. Correlation of the Data with Stratigraphy of the Area
Precise correlation of the reflectors in terms of their depths with stratigraphy of the concerned area required a lot of experience, knowledge and details information of the area. For the interpretation of the given seismic section, two well data and two exposed sections have been incorporated a no of prominent reflectors are visible in the given seismic section The amount of reflectors coming in the range of vibroseis point (VP) 199 to 620, are nine including basements, the reflector 4 could be the base Miocene unconformity as the result of depth correlated with Isha Kel1 well match significantly. The depth from the Isakhel well is correlated with average depth of reflector 4 from isovelocity method also the unconformity usually gives very strong reflection on seismic data. These can be identified by observing truncations against the reflectors. The horizon has also been correlated with horizons base, siwaliks from Khundiyan well. Here the base siwaliks has been identified as Base of Miocence.
4.9.1. Siwaliks
The Rawalpindi Group has been encountered in kundian and Isakhel, well, so the sediments above base Miocene are considered siwaliks
4.9.2. Mesozoic Strata
Whole of the Mesozoic starta is absent is kundian well While in Isakhel well Triassic and Jurassic strata is present. Hence as we go and move toward northern part of the area the Triassic and Jurassic strata shows its presence. The interpretation of seismic lines near Khundiyan indicates the presence of Permiam starta below the Miocene.
However towards North reflections between base Miocene and top Permian strata appears truncating against base Miocene, these reflections has been interpretated as Mesozoic data.
4.9.3. Salt Range Formations
The reflections below the Cambrian starta and above basement have been interpreted as salt range formations because it shows white zone due to Presence of salt.
4.9.4. Basements
Basement shows very strong reflections on the seismic sections also the absence of any reflectors below the Identified basement confirms its Presence.
4.9.5. Note
In the Northern part of seismic section there lies a fault the reasons for it could be plunge of Khisor range as a result the data seems to be uplifted in the northern portion of seismic section. The data could not be interpreted further due to poor quality.
4.10. Structural Interpretation
On the basis of this interpretation of this seismic lines one can be deduce the following conclusions:
Ø All the sedimentary strata and basement is dipping towards north;
Ø Basement is rising towards south east and exposed near Sargodha high. It is dipping towards north.
4.11. Stratigraphic Interpretation
By analyzing the seismic data countour map and depth section the following can be deduced:
Ø The mianwali reentrant represent a depression and so very thick accumulation of Molasses up 3000 m;
Ø Due to upward movement of basement towards southeast the sediments has eroded as erosion is more prominent toward Sargodha high;
Ø Due to erosional unconformity the sedimentary strata from the Jurassic to Precambrian is being truncated gradually towards South;
Ø The base Miocence is regional unconformity at the base of molasses and all truncations are against it;
Ø There is no evidence of presence of Rawalpindi Group in this area.
5. Well-Used Reflector
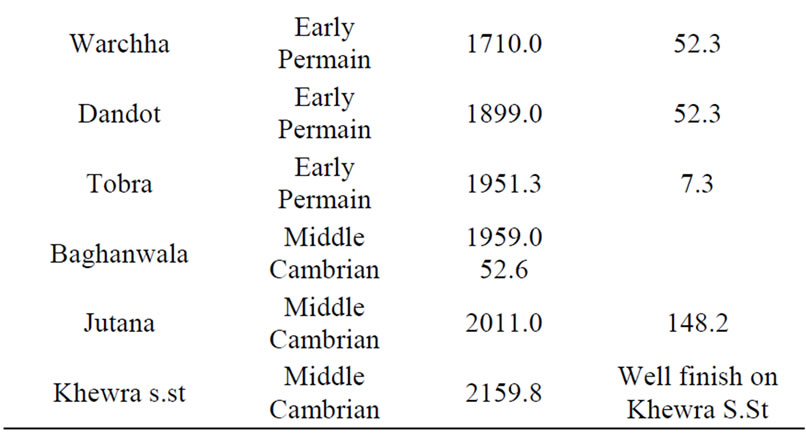
The well used as references are Isakhel and the kundian on the basis of Isakheil-1, following are the formations shown on the Depth Section. Reflector r1 may be Dhok Pathan formation of Pliocene age, reflector, r2 may be the Nagri formations of Pliocene age, Reflector r3 may be Chinji formation of Pliocene reflector r4 marked the base Miocene unconformity reflector r5 is the Datta formation of Jurassic age reflector r6 is Tredian formation of Triassic age, reflector r7 is Amb formation of Permian age, reflector r8 is Sardhai formation of Early-Permian age, reflector r9 denotes the Khisor formation, reflector r 10 is Khewra formation and reflector r11 is basement both of Cambrian age.
6. Discussion
Summary and Discussion
Seismic attributes are the measure of seismic data that enables us to exaggerate the geological feature for interpretation, Using seismic survey we can map geological structures and which tells us the most appropriate drilling location [14,15], we use seismic data to configure the geometry of reflectors and about their depth This is only due to Seismic waves reflect at interfaces between materials of different acoustic properties The amplitude of returned Wave Changes due to reflection, these changes at interfaces is due to impedance contrast (product of density and velocity).
The information of seismic amplitude can be used to blackout or invert for, relative impedance On the both side of Interface when these seismic property is correlated with the measurement in the bore hole we may be able to extend well info through whole seismic volume, This Process is called seismic inversion for reservoir characterization which fill the gap in the knowledge of formation properties between wells. In forward modeling we start with model of earth properties, then mathematical simulation of a physical experiment or processes like electromagnetic, acoustics on the earth model and finally output a model response. If our model and assumptions are accurate, the model will look like real data like as we did in above, and we can use the above depth section and iso velocity map data to backout. As in inversion, we start with actual measurement data, apply operations which are steps back to the physical experiment and deliver earth model. If we do inversion properly, the earth model will look like real earth. Most measurements in Exploration and Production industry depend on inversion for the interpretation.
There is no equation for interpretations problems with which all multiple measurements directly related including noise, losses and other Inaccuracies answered in unique answer. Inversion is the mathematical way for estimating answer, checking it against observations and until acceptable solutions comes.
7. Conclusion
We can conclude by studying and analyzing seismic data, contour maps and depth section. The following can be deduced: Mianwali re-entrant represents a depression and very thick accumulation of molasses up to 3000 m. Due to upward movement of basement towards southeast, the sediments have eroded and the erosion is more prominent towards Sargodha High. Due to erosion unconformity the sedimentary, strata from Jurassic to Precambrian is being truncated gradually southwards. Base Miocene is the regional unconformity at the base of molasses and all.
REFERENCES
- A. H. Kazmi and M. Q. Jan, “Geology and Tectonics of Pakistan,” Graphic Publishers, Karachi, 1997, 133p.
- A. N. Fatmi, M. Akthar, G. S. Alam and I. Hussain, “Geological Society of Salt Range,” Pakistan Geological Congress (GSP), Islamabad, 1984.
- M. P. Coward and R. W. H. Butler, “Thrust Tectonics and the Deep Structure of the Pakistan Himalaya,” Geology, Vol. 13, No. 6, 1985, pp. 247-265. doi:10.1130/0091-7613(1985)13<417:TTATDS>2.0.CO;2
- G. Sarwar and K. A. DeJong, “Arcs, Oroclines, Syntaxis: the Curvatures of Mountain Belts in Pakistan,” In: Geodynamics of Pakistan, Geological Survey of Pakistan, Quetta, 1979, pp. 342-349.
- R. S. Yeats and R. D. Lawrence, “Tectonics of the Himalayan Thrust Belt in northern Pakistan,” Marine Geology and Oceanography of Arabian Sea and Coastal Pakistan, Van Nostrand Reinhold Co., New York, 1984, pp. 177- 200.
- A. Kemal, “Geology and New Trends for Hydrocarbon exploration in Pakistan,” Proceedings of International Petroleum Seminar, 22-24 November 1991, Islamabad, 1992, pp. 16-57.
- D. M. Baker, “Balanced Structural Cross Section of the Central Salt Range and Potwar Plateau of Pakistan— Shortening and over Thrust Deformation,” M.S. Thesis, Oregon State University, Corvallis, 1988, 120p.
- Kalabagh Consultants, III, “Geology and Geotechnical Assessment,” Project Planning Report, 1984, 12p.
- E. William, “Understanding the Effects of Structure and Bonding in the Bringelly Shale,” In: K. Alshibli, H. Malkawi and M. Alsaleh, Eds., Geo Jordan 2004: Advances in Geotechnical Engineering with Emphasis on Dams, Highway Materials, and Soil Improvement, American Society of Civil Engineers, Irbid, 2004, pp. 194-201.
- M. H. Malik and S. Farooq, “Geotechnical Aspects of the Dhoke Pathan Formation at the Kalabagh Dam Site,” The Geological Bulletin of the Punjab University, Vol. 23, 1998, pp. 117-127.
- O. Yilmaz, “Seismic Data Processing,” Society of Exploration Geophysicsts, Tulsa, 1987, 523p.
- H.-N. Al-Sadi, “Seismic Exploration Technique and Processing,” Birkhauser, Boston, 1980, 259p.
- L. Y. Faust, “Seismic Velocity as Function of Depth and Geologic Time,” Geophysics, Vol. 16, No. 2, 1951, pp. 206.
- E. S. Robinson and C. Coruh, “Basic Exploration Geophysics,” John Wiley & Sons, New York, 1988, 562p.
- M. B. Dobrin and C. H. Savit, “Introduction to Geophysical Prospecting,” 4th Edition, McGraw-Hill, New York, 1988, 867p.
- E. R. Gee, “Overview of Geology and Structure of Salt Range, with Observations on related Areas of Pakistan,” Geological Society of America, New York, 1980, pp. 28-232.
Appendix
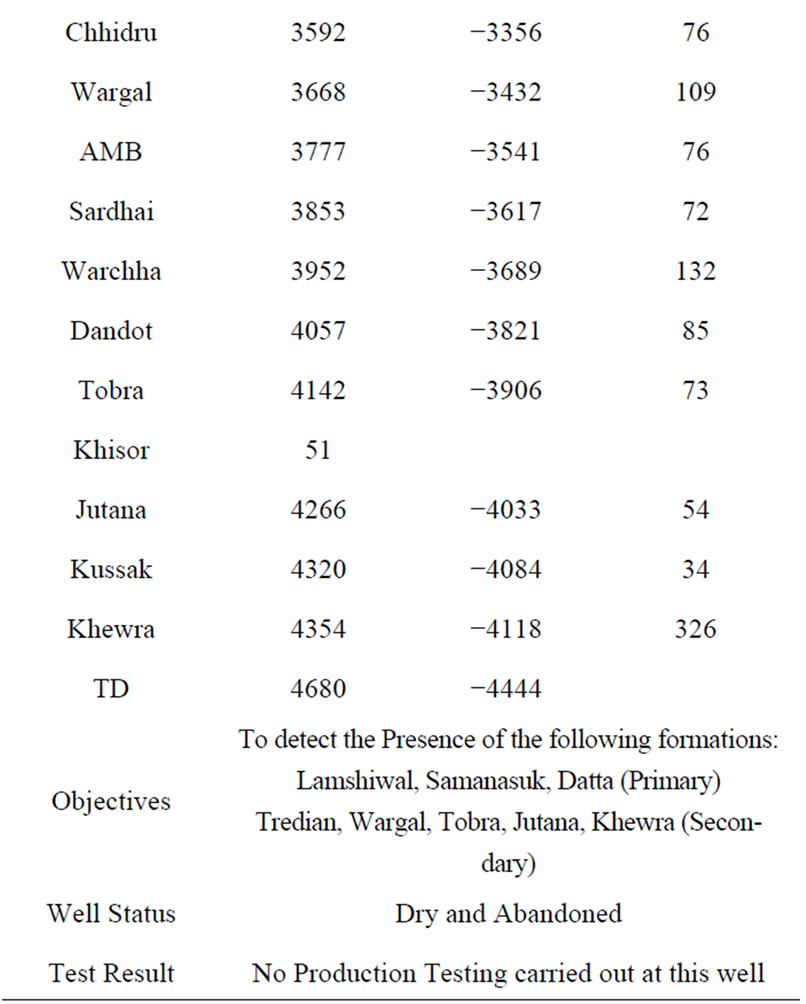
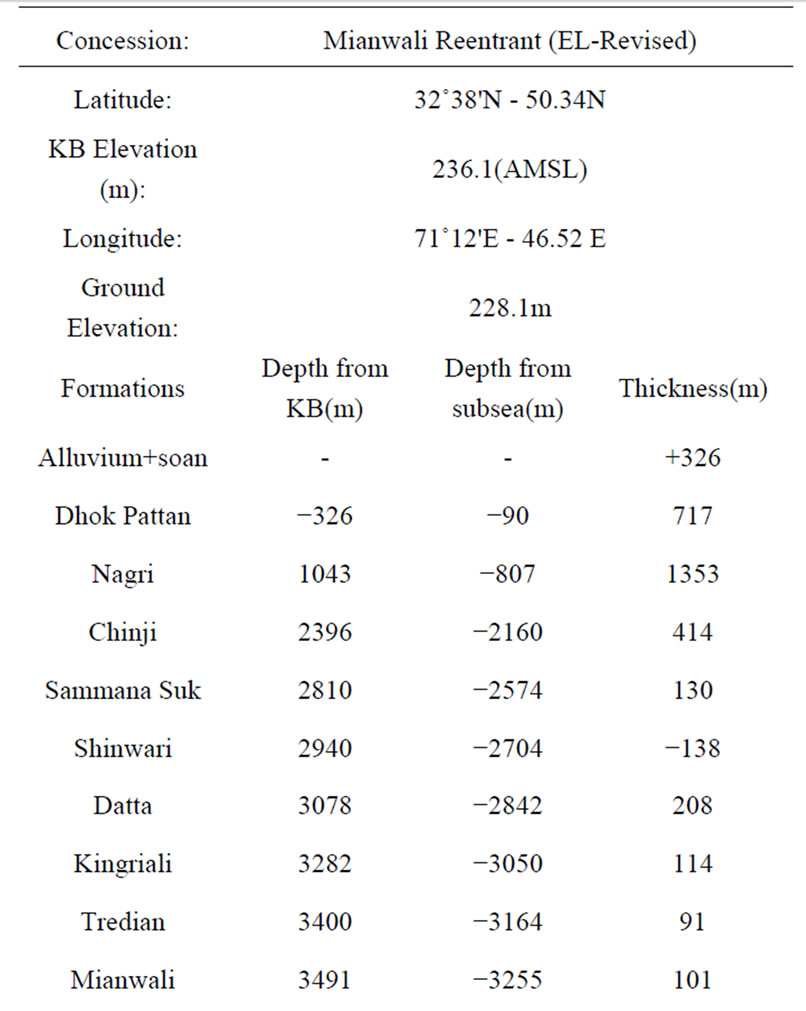
Well sheet summary well isakhel-01
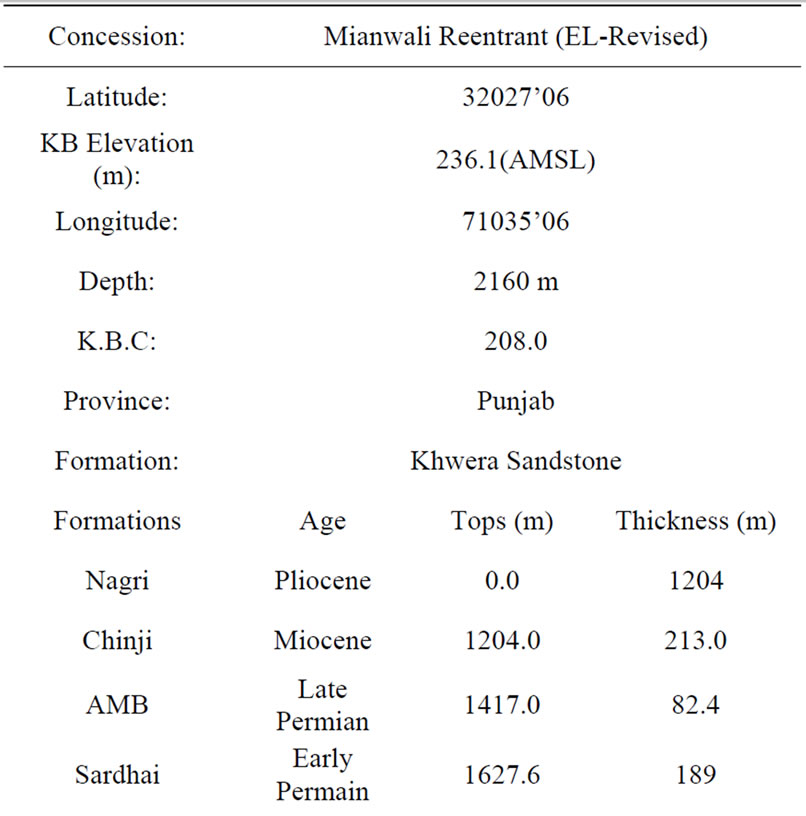
Well sheet summary kundian.