Journal of Minerals and Materials Characterization and Engineering
Vol.2 No.4(2014), Article
ID:48173,12
pages
DOI:10.4236/jmmce.2014.24038
Characterization of LDPE Reinforced with Calcium Carbonate—Fly Ash Hybrid Filler
Samson Oluropo Adeosun1, Mohammed Awwalu Usman2*, Emmanuel Isaac Akpan3, Winifred Ifeoma Dibie1
1Department of Metallurgical and Materials Engineering, University of Lagos, Lagos, Nigeria
2Department of Chemical Engineering, University of Lagos, Lagos, Nigeria
3Department of Metallurgical and Materials Engineering, Ambrose Alli University, Ekpoma, Nigeria
Email: samsonoluropo@yahoo.com, *mawwal04@yahoo.com, emma_eia@yahoo.com, Dibie.winifred@gmail.com
Copyright © 2014 by authors and Scientific Research Publishing Inc.
This work is licensed under the Creative Commons Attribution International License (CC BY).
http://creativecommons.org/licenses/by/4.0/
![]()
![]()

Received 5 April 2014; revised 12 May 2014; accepted 30 May 2014
ABSTRACT
The synergetic effect of calcium carbonate (CC)-fly ash (FA) hybrid filler particles on the mechanical and physical properties of low density polyethylene (LDPE) has been investigated. Low density polyethylene is filled with varying weight percentages of FA and CC using melt casting. Composites are characterized for mechanical, thermal, microstructural and physical properties. Results show that the flexural strength increases with increases in FA content of the hybrid filler. It is evident from the study that to achieve optimum density a certain combination of both fillers need to be used. The optimum combination of CC and FA for a higher density (1.78 g/cm3) is found to be at 20 wt% FA and 30 wt% CC. An increase of 7.27% in micro-hardness over virgin polyethylene is obtained in composites with 10 wt% FA and 40 wt% CC. The presence of higher amount of CC is seen to be detrimental to the crystallinity of composites. X-ray, FTIR and DSC results show that composite with 45 wt% CC and 5 wt% FA exhibits a typical triclinic polyethylene structure indicating that the composite is amorphous in nature. There was the synergy between FA and CC fillers on flexural strength and crystallinity of composite. However, the fillers show the antagonistic effect on energy at peak and micro-hardness.
Keywords:LDPE, Calcium Carbonate, Coal Fly Ash, Crystallinity, Melt Flow Index, Flexural Strength, Micro-Hardness, Energy at Peak

1. Introduction
Low density polyethylene resins are among the most versatile polymers, but their uses are limited due to several drawbacks, namely low strength, stiffness and poor heat resistance. To overcome these drawbacks and to prepare material with improved properties, fillers are incorporated into the matrix [1] . Fillers can affect the dimensional stability, crystallinity, mechanical and other properties of polymers [2] [3] .
Coal is a fossil fuel that has been largely utilized for electricity generation in some countries of the world including the United Kingdom and South Africa. In Nigeria, there is an estimated deposit of 4.0 billion tonnes of coal yet untapped [4] . A good chunk of this is likely to be utilized for the generation of power from coal fired power stations. This would create a huge amount of fly ash (FA), which is a residue (solid waste) resulting from the combustion of coal. FA is considered hazardous since it contains leachable and toxic metals such as Pb, Cd, Zn and Cu [2] [5] . Exposure to these metals has been associated with lung cancer, heart disease or asthma [2] [6] . There is therefore a need to find suitable means of utilizing FA in order to address its environmental challenge. Reported utilization of FA includes as the replacement of clay in bricks [7] , in road pavement [8] , in waste management [9] , in synthesis of zeolite [10] [11] , as catalyst for biodiesel production [12] [13] and as fillers in polymers [2] [14] .
Calcium carbonate (CC) is an inorganic, low cost and non-toxic substance that has been widely used as filler in polymer composite for improved properties. In our previous publications, the significant improvement in the mechanical properties of flexible polyurethane foam [15] and polypropylene [16] when CC is incorporated into their matrices was reported. However, CC filler is not without its shortcomings. CC has been reported to show the weak nucleating ability in polymers and as such may not significantly affect the crystallinity of the polymer matrix [17] . Zuiderduin et al. [18] also reported that untreated CC particles had no effect on the melting temperature and crystallinity of polypropylene-CC composites. Lazzeri et al. [19] observed that uncoated precipitated CC particles have a very small nucleating effect on high density polyethylene (HDPE). LDPE is reported to have more amorphous phase than HDPE [20] [21] . For such semi-crystalline polymer based composites, fillers which can act as strong nucleating agent have the potential to induce polymer crystallization and also improve the interfacial interaction, which is the key to the preparation of high performance polymer/filler composites [22] .
Atikler et al. [23] compared the effect of FA and CC fillers, with and without silane surface treatment, on the mechanical properties of HDPE such as tensile strength, Young’s modulus and elongation at break. The result indicates improvement in these properties for both fillers and thus they concluded that FA can replace CC as filler in HDPE composite. The foregoing scenario inspires an expectation of synergy between CC and FA that has not been previously explored. The aim of this work is therefore to investigate the possible synergetic effect of CC-FA hybrid filler on the mechanical and thermal properties of LDPE/CC-FA composite. Varying ratios of CC to FA in the hybrid are incorporated into the LDPE matrix while maintaining LDPE to hybrid ratio at 50:50 wt%.
2. Experimental Methodology
2.1. Materials
Calcium carbonate (CC) (20 µm) and fly-ash particles (FA) (60 µm) are obtained from the Federal Institute of Industrial Research, Oshodi (FIIRO), Lagos, Nigeria. Table 1 show the composition of the two fillers. CC and FA are added to give 50 wt% filler proportion while the quantity of polyethylene is maintained at 50 wt%.
2.2. Methods
LDPE (50 wt%) is blended with FA and CC at varying proportion of two fillers while keeping the amount of the

Table 1 . Composition of fillers.
hybrid filler constant at 50 wt%. The blend is heated to 145˚C in aluminium pot using an electric stove under atmospheric pressure. The melt is cast into a metallic mould and allowed to cool to room temperature before removal. Cast samples are further prepared for various characterizations.
2.2.1. Determination of Density
Densities of all samples are determined by first weighing the samples and dividing the known weights by their respective volumes using Equation (1).
 (1)
(1)
2.2.2. Determination of Water Absorption
To determine the rate of water absorption of the samples, samples are initially dried in an oven at 50˚C, weighed and suspended in a beaker of distilled water and reweighed at an interval of 24 hours for seven days. Water absorption rate is determined according to Equation (2).
 (2)
(2)
where W1 = initial weight of specimen (dry weight);
W2 = final weight of specimen.
2.2.3. Determination of Melt Flow Index
The rate of melt flow in (g/10min) is measured with the aid of a manually constructed melt flow indexer (see Figure 1) with 9.5 mm diameter piston. Four (4) grams of each cast is put into the apparatus as the basis for each test. As the resin melts, the piston is inserted into the device and a force of 23.52 N exerted to extrude the molten sample through its orifice. Melt flow index is calculated using Equation (3).
Also
 (3)
(3)
where w = the mass of material in grams flowing out;
t = constant time for all samples in seconds. The time used in this case was 45 seconds.
2.2.4. Determination of Flexural Strength
The flexural properties of all the samples are determined using a Testometric M500 universal tester according to ASTM D7264 at a cross-head speed of 40 mm/min, maintaining a span of 30 mm.
2.2.5. Determination of Micro-Hardness
ALeco LM700AT Vicker’s hardness tester with a pyramidic diamond indenter and 1 kgf load is used to investigate the micro-hardness of all samples.
2.2.6. X-Ray Diffraction
A Panalytical X’Pert Pro MPD model diffractometer equipped with an X’celerator detector and GAADS software are used to observe the diffraction pattern of the composite. The diffraction patterns are collected by using small mass of the polymer composite placed on a rectangular flat glass 45 cm by 3.6 cm to ~1 mm thic over a rectangular space of 1.5 cm by 2 cm at a scan range of 5˚ - 78˚ (2θ) in step size of 0.0334, using a Ni filter. The diffraction patterns are generated for 7 - 8 min with the X-ray beam set to 40 kV and 40 mA at 29˚C (inner tem-

Figure 1. Melt flow indexer.
perature), 25˚C (outside temperature). The glass spatula and the rectangular flat glass are cleaned with a tissue paper soaked in methanol before and after each sample test.
2.2.7. Scanning Electron Microscopy
A Hitachi S-4700 model variable pressure Scanning Electron Microscope (SEM) fitted with an EDAX head is used to observe the longitudinal features of the polymer composite. The samples to be observed under the SEM are mounted on conductive adhesive tape prepared by placing the samples on circular disclined with carbon and coated with Au for 5 minutes to enable it conduct electricity using an E-1010 HITACHI model machine.
2.2.8. Differential Scanning Calorimetry
The DSC curves of polymer composites are recorded on a DSC Q200 machine with a temperature minimum of 40˚C and heating rates of 5˚C/min, 10˚C/min, 15˚C/min and 20˚C/min. The samples are heated to 200˚C, cooled to the minimum temperature and heated to 200˚C.
2.2.9. Fourier Transform Infra-Red Spectroscopy
FTIR spectra are obtained by means of a Nicolet 6700 M spectrometer in transmission mode. Finely divided 10mg samples of the material surface are ground and dispersed in a matrix of KBr (500 mg), followed by compression at 22 - 30 MPa to form pellets. The transmittance measurements are carried out in the range of 400 - 4000 cm−1 at a resolution of 4 cm−1.
3. Results and Discussion
3.1. Flexural Strength
Figure 2 shows the flexural strength of the composite at break. The flexural strength increase steadily with the FA content to a maximum (1.7995 MPa) at 45/5 wt% FA/CC content. The composite is found to exhibits higher flexural strength with higher amount of FA and lower amount of CC. It is observed that flexural strength decrease initially when the combination of the filler is dominated by CC but increase sharply when the filler content is dominated by FA. It has been reported that increase in the content of fly-ash to polyethylene leads to increase in flexural strength [24] . The authors attributed this increase to the formation of fairly strong interfacial bond between the matrix and filler leading to an effective stress transfer from matrix to filler. Abdel-Salam et al. [25] found that the increase in CC content above 20 wt% lead to decrease in the flexural strength of HDPE/rice straw composite. Contrary to this observation, however, Kord [26] reported an increase in flexural strength of polyethylene/wood composite with increase in CC content.

Figure 2. Flexural strength responses of polyethylene-CC/FA composite.
3.2. Flexural Modulus
Figure 3 shows the variation of flexural modulus with filler content. It is observed that the presence of FA and CC filler lead to a sharp decrease in flexural modulus of the composite. The presence of 10 wt% FA and 40 wt% CC lead to over 100% decrease in flexural modulus. The composite experience very minimal increase in flexural modulus with further increase in the amount of FA and decrease in CC. This shows that increase in FA may lead to increase in flexural modulus while increase in CC may lead to a decrease in flexural modulus. This is in line with the work of Ahmad and Mahanwar [24] who reported that increase in FA content leads to increase in flexural modulus. Gummadi et al. [3] also reported that flexural modulus increase for smaller filler loading and decrease for larger filler loading for an FA filled polypropylene composites.
3.3. Energy at Peak
The variation of energy at break of composites with filler content is shown in Figure 4. It is obvious that increase in FA content leads to increase in energy at break. The highest peak energy (0.0651 J) is shown at 45 wt% FA and 5 wt% CC while the lowest energy (0.0288 J) is shown by neat Polyethylene. It is obvious from the figure that increase in FA content should be responsible for increase in energy at break while CC is detrimental. It is evident that the two fillers individually have positive effect on energy at peak as the value increase from 0.0288 J for the pure polyethylene to 0.06 J for 10 wt% FA/40 wt% CC and 0.0651 J for 45 wt% FA/5 wt% CC composites. However, there seems to be some measure of antagonistic effect between the fillers which becomes most prominent at 20 wt FA/30 wt CC composite as the energy at peak dipped to 0.034 J representing the least for the composite samples studied, though still higher than the value for pure polyethylene.

Figure 3. Flexural modulus responses of polyethylene-CC/FA composite.

Figure 4. Energy to peak responses of polyethylene-CC/FA composite.
3.4. Micro-Hardness
The variation of composite micro-hardness with filler content is shown in Figure 5. The Vicker’s hardness number increase (by 7.27% over neat polyethylene) initially in the presence of 10 wt% FA and 40 wt% CC but decrease with increase in FA content. The hardness attained a minimum (18.17 Hv) at 30 wt% FA and 20 wt% CC and thereafter increases with increase in FA content. It is observed that when CC has the highest percentage in the matrix filler a higher hardness is attained likewise when FA is the highest percentage in the filler blend hardness also appreciates. This show that each component of the filler individually improves surface hardness but the interaction of both fillers is detrimental to surface hardness. This is in line with the study of Sirin et al. [27] who reported that increase in amount of CC leads to increase in surface hardness of polypropylene and LDPE blends. Abdel-Salam et al. [25] also reported an increase in surface hardness of HDPE/rice straw composites with increase in CC.
3.5. Density
The variation of density of composite with filler content is shown in Figure 6. Density increase with decrease in CC to a maximum value (1.78 g/cm3) at 20 wt% FA and 30 wt% CC but decrease afterwards with increase in FA. This place the optimum composition of CC and FA filler at 20 wt% FA and 30 wt% CC. It is obvious that increase in FA content is detrimental to density while increase in CC favours density. This may be attributed to the fact that FA has a lower density (0.8 - 1.0 g/cm3) compared to CC with a density of 2.7 g/cm3.
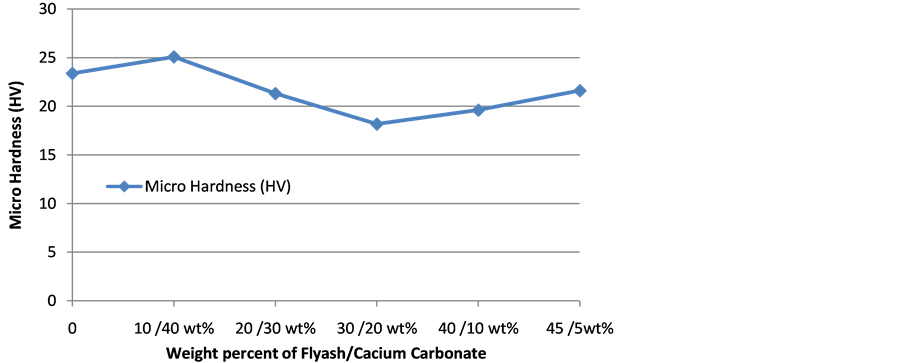
Figure 5. Hardness responses of polyethylene-CC/FA composite.

Figure 6. Density of polyethylene-CC/FA composite.
3.6. Water Adsorption
Figure 7 show the water absorption behaviour of the composite. It is observed that water absoprtion of all composites increase with soaking time. Although there is a pattern but it could be observed that composites with higher amount of CC tend to possess higher water adsorption rate while those with higher FA content possess lower adsorption rate. This is in line with the studies of Abdel-Salam et al. [25] who reported that the water absorption of composites increase with increase of CaCO3 loading. This may be attributed to the fact that calcium carbonate has hydrophilic sites and increase in water sorption can be expected [28] . Kord [26] also reported that increase in CC promotes increase in water absortion capacity of HDPE-CC composites. Though FA contains high proportion of silica which should confer on it some measure of hydrophilicity, the result clearly show the superiority of CC in terms of hydrophilicity.
3.7. Melt Flow Index
Melt flow index (MFI) reflects the ease of flow of a molten polymer and is usually employed in conjunction with melt flow rate (MFR) to define different grades of polyolefins [29] . The incorporation of fillers hinders plastic flow and increases the viscosity of a polymer melt, thus a reduction of MFI with filler loading is expected [17] . Since the filler loading is maintained at a constant value of 50 wt%, any variation in MFI can only be attributed to the constituent of the hybrid filler. Figure 8 show the effect of FA and CC content on the melt flow index of composites. Though MFI is reduced with filler addition as expected, it is obvious that increase in wt% of FA leads to a more decrease in melt flow index of composites. At higher amount of CC the composites are found to possess higher melt flow index while at higher amount of FA the composites possess lower melt flow index. This is an indication that FA is more detrimental to MFI of the composites than CC. This is in line with
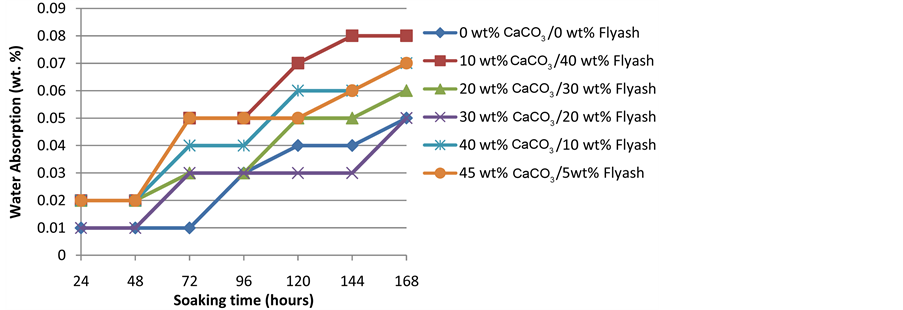
Figure 7. Water absorption of polyethylene-CC/FA composite.

Figure 8. Melt flow rate of polyethylene-CC/FA composite.
the study of Şirin et al. [27] who reported that increase in amount of CC show lower reducing effect on MFI of Polypropylene-LDPE blend composites. Leong et al. [17] also reported on the higher MFI of CC filled polypropylene composites in comparison with talc and kaolin fillers. The study indicates that CC has the ability to increase plasticity and processability of the polymer. Low MFI enhances mechanical properties and thermal stability [29] . The 45 wt% FA/5 wt% CC composite has the least MFI and as such should possess least mechanical properties. This is corroborated by the result of flexural strength in Section 3.1.
3.8. X-Ray Diffraction
The X-ray diffraction pattern (45 wt% CC and 5 wt% FA composite) in Figure 9 shows that the polymer patterns consist of multiple sharp peaks consistent with “diffraction” from a crystalline lattice. On the far left, the patterns have one broad feature consistent with “incoherent scatter” from an amorphous portion. The pattern indicates partly orthorhombic and partly triclinic polyethylene with calcium carbonate and silica. It is supposed that the FA contain a reasonable amount of silica. The broad peak at 19.62˚ is typical peak of the 010 plane of triclinic polyethylene indicating that the polymer is amorphous in nature, which is also confirmed from the DSC results present later in this work. Peaks representing 001, ![]() and 130 planes of polyethylene also appear at two theta values of 37.37˚, 38.51˚ and 57.42˚ respectively. Peaks representing the CC are the dominating peaks in the diffractogram including peaks at two theta values of 23.06˚, 29.42˚, 31.42˚, 35.97˚, 39.41˚, 43.19˚, 47.5˚ and 48.5˚ indicating the presence of calcite in various precipitate forms. This is basically because the composite analysed contained a greater amount of CC (45 wt%).
and 130 planes of polyethylene also appear at two theta values of 37.37˚, 38.51˚ and 57.42˚ respectively. Peaks representing the CC are the dominating peaks in the diffractogram including peaks at two theta values of 23.06˚, 29.42˚, 31.42˚, 35.97˚, 39.41˚, 43.19˚, 47.5˚ and 48.5˚ indicating the presence of calcite in various precipitate forms. This is basically because the composite analysed contained a greater amount of CC (45 wt%).
3.9. Fourier Transorm Infra-Red Spectroscopy
Figure 10 is the Fourier Transform Infra-Red spectrum of the 45 wt% CC and 5 wt% FA composite. The vibration modes of the calcium carbonate are seen in three active IR bands, 698 cm−1 (v4-in-plane bend), 876 cm−1 (v2-out-of-plane bend) and the broad band consisting of 1450 and 1490 cm−1 (v3-antisymetircstretching) peaks. This is consistent with the findings of other researchers [30] . The in-plane and out-of-plane bending shifted backward against that reported in literature (714 cm−1 and 879 cm−1 respectively in [30] ) to appear at 698 cm−1 and 876 cm−1 respectively. The in-plane bending shows the strongest absorbance (0.09) indicating a strong effect on the structure of the matrix. This is in agreement with the XRD results which show that the sample in question contain a higher amount of CC (45 wt%) and therefore seem to dominate the structure. The strong CH2 asymmetric stretching at 2920 cm−1, the CH2 symmetric stretching at 2850 cm−1 and the CH3 symmetric deformation are characteristic peaks of polyethylene [31] [32] . The presence of Si-O-Si stretch is noticed at 1070 cm−1 with weak absorbance (0.02; see Figure 11). This is in line with results from XRD where it is noted that FA contain high amount of silica making it prominent in the structure. A large OHstretching band appears between 3100 cm−1 and 3700 cm−1 showing the presence of absorbed water due to the presence of calcite additives.
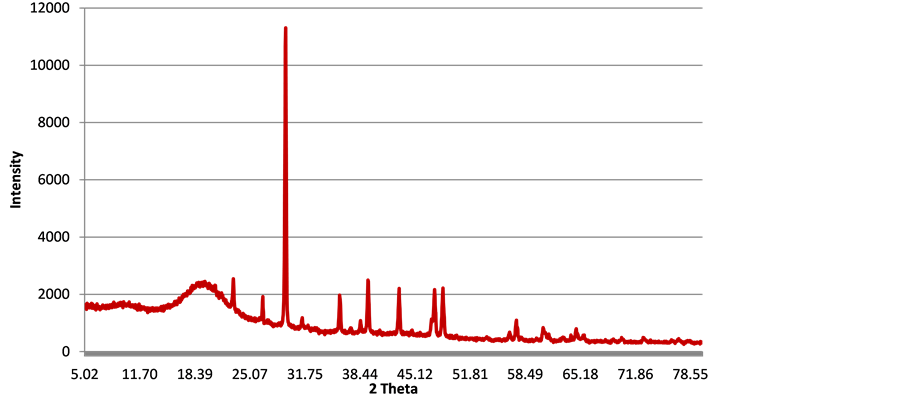
Figure 9. XRD of polyethylene-CC/FA composite.
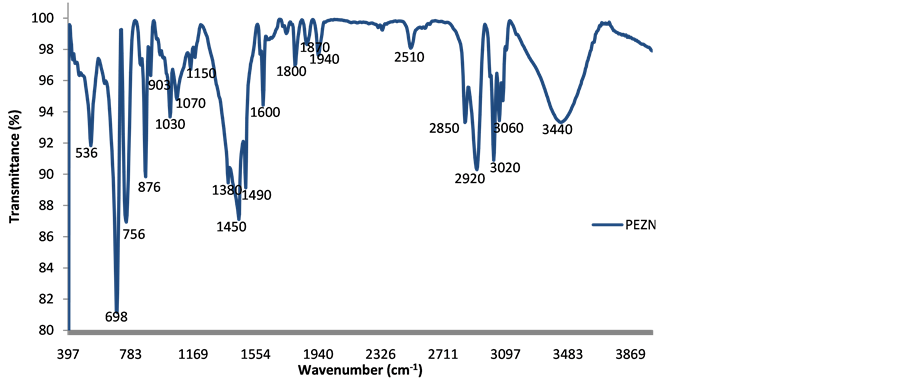
Figure 10. FTIR spectrum polyethylene-CaCO3/fly ash composite.

Figure 11. Absorbance polyethylene-CC/FA composite.
3.10. Differential Scanning Calorimetry
Figure 12 is the differential scanning calorimetry curves of polyethene-calcuim carbonate-fly ash sample scanned at 5, 10, 15 and 20 degrees/min scan rates. The curves show endothermic peaks but no crystallization and transition peaks. This is consistent with the findings in literature [33] -[36] . However, the curves do not show a marked heat of melting as the peaks are not well defined. This may be attributed to the strong effect of calcium carbonate additives to the structure of polyethylene. It is noted that this curve has a large difference from that reported in literature in terms of melting peak which is far below that reported and the area of the curve which is also far smaller than that reported in literature [33] -[36] . It can be concluded that the presence of these additives disrupted the crystalline structure of the polymer yielding a highly amorphous material consistent with the findings in FTIR reported earlier in this study. It is also noted that increase in scanning rate led to increase in peak temperature (see Table 2).
3.11. Scanning Electron Microscopy
Figure 13 shows the morphology of the polyethene-calcuim carbonate-fly ash samples. The image shows the small dumbbell particles of calcium carbonate littered over large plate-like spheres of polyethylene matrix. With a higher magnification (left) the dumbbell calcite particles are found to cluster at some places in the matrix.
Table 2. Thermal properties of modified polyethylene.

Figure 12. DSC scans polyethylene-CC/FA composite at different scanning rate.
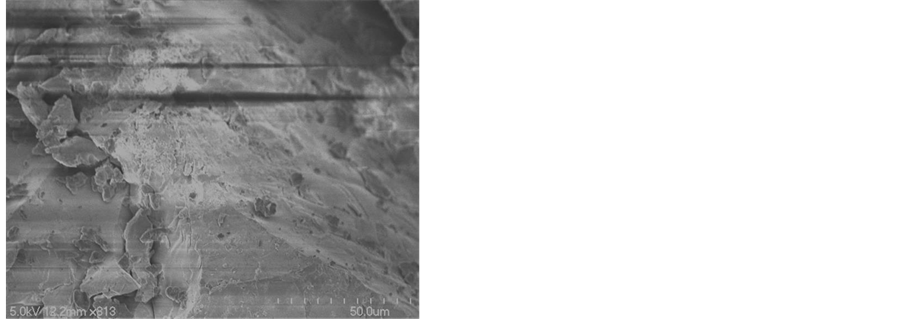
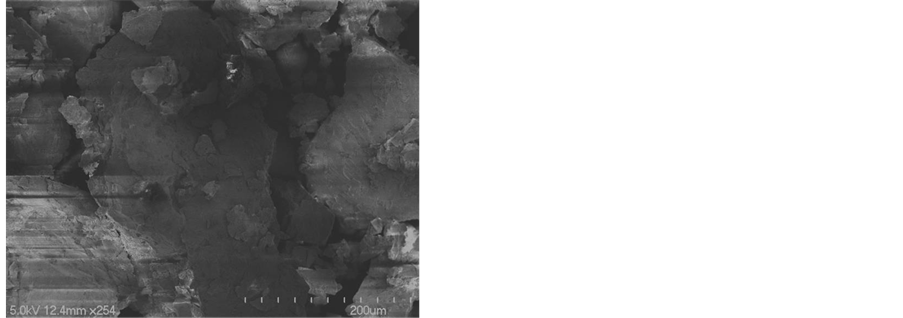
Figure 13. SEM polyethylene-CC/FA composite at different magnifications.
4. Summary of Findings
The following findings can be summarized from the study;
1) Composite with 45/5 wt% FA/CC had the maximum flexural strength of 1.7995 MPa. The presence of 10 wt% FA and 40 wt% CC lead to over 100% decrease in flexural modulus but a higher percentage of FA led to increase in flexural modulus.
2) The peak energy at break (0.0651 J) is shown by the composite with 45 wt% FA and 5 wt% CC whereas the lowest energy (0.0288 J) is shown by neat polyethylene.
3) An increase of 7.27% HV over neat polyethylene is obtained in composites with 10 wt% FA and 40 wt% CC.
4) Optimum composition of composites for higher density is at 20 wt% FA and 30 wt% CC content.
5. Conclusion
The study on the effect of addition of calcium carbonate-fly ash hybrid filler on the mechanical, physical and chemical properties of LDPE has been done. Composites are found to possess higher melt flow index at higher amount of CC but lower melt flow index at higher amount of FA. Composite with 45 wt% and 5 wt% exhibits a typical triclinic polyethylene structure indicating that the composite is amorphous in nature. The hybrid of FA and CC fillers exhibits the synergetic effect on flexural strength and crystallinity of the composite. However, they show the parallel effect on energy at peak and micro-hardness.
References
- Hemati, F. and Garmabi, H. (2011) Compatibilised LDPE/LLDPE/Nanoclay Nanocomposites: I. Structural, Mechanical, and Thermal Properties. Canadian Journal of Chemical Engineering, 89, 187-196. http://dx.doi.org/10.1002/cjce.20377
- Velado, D., Potgieter, H. and Liauw, C.M. (2013) Investigation into the Adsorption of a Commercial Coupling Agent for Polymers onto Pretreated Fly Ash Filler Particles. Journal of Applied Polymer Science, 130, 3985-3992.
- Gummadi, J.G., Kumar, V. and Rajesh, G. (2012) Evaluation of Flexural Properties of Fly Ash Filled Poly-Propylene Composites. International Journal of Modern Engineering Research, 2, 2584-2590.
- Ohimain, E.I. (2013) A Review of the Nigerian Biofuel Policy and Incentives (2007). Renewable and Sustainable Energy Reviews, 22, 246-256. http://dx.doi.org/10.1016/j.rser.2013.01.037
- Knox, E.G. (2008) Atmospheric Pollutants and Mortalities in English Local Authority Areas. Journal of Epidemiology and Community Health, 62, 442-447. http://dx.doi.org/10.1136/jech.2007.065862
- Brown, P., Jones, T. and BéruBé, K. (2011) The Internal Microstructure and Fibrous Mineralogy of Fly-Ash from Coal-Burning Power Stations. Environmental Pollution, 159, 3324-3333. http://dx.doi.org/10.1016/j.envpol.2011.08.041
- Xu, L.L., Guo, W., Wang, T. and Yang, N.R. (2005) Study on Fired Bricks with Replacing Clay by Fly Ash in High Volume Ratio. Construction and Building Materials, 19, 243-247. http://dx.doi.org/10.1016/j.conbuildmat.2004.05.017
- Lav, A.H., Lav, M.A. and Goktepe, A.B. (2006) Analysis and Design of a Stabilized Fly Ash as Pavement Base Material. Fuel, 85, 2359-2370. http://dx.doi.org/10.1016/j.fuel.2006.05.017
- Hong, J.K., Jo, H.Y. and Yun, S.T. (2009) Coal Fly Ash and Synthetic Coal Fly Ash Aggregates as Reactive Media to Remove Zinc from Aqueous Solutions. Journal of Hazardous Materials, 164, 235-246. http://dx.doi.org/10.1016/j.jhazmat.2008.08.001
- Ojha, K., Pradhan, N.C. and Samanta, A.N. (2004) Zeolite from Fly Ash: Synthesis and Characterization. Bulletin of Material Science, 27, 555-564. http://dx.doi.org/10.1007/BF02707285
- Matlob, A., Kamarudin, R.A., Jubri, Z. and Ramli, Z. (2011) Response Surface Methodology for a Green Synthesis of Zeolite Na-A. European Journal of Scientific Research, 60, 540-550.
- Babajide, O., Petrik, L., Musyoka, N., Amigun, B. and Ameer, F. (2010) Use of Coal Fly Ash as a Catalyst in the Production of Biodiesel. Petroleum & Coal, 52, 261-272.
- Babajide, O., Musyoka, N., Petrik, L. and Ameer, F. (2012) Novel Zeolite Na-X Synthesized from Coal Fly Ash as a Heterogeneous Catalyst in Biodiesel Production. Catalysis Today, 190, 54-60. http://dx.doi.org/10.1016/j.cattod.2012.04.044
- Garde, K., McGill, W.J. and Woolard, C.D. (1999) Surface Modification of Fly Ash—Characterization and Evaluation as Reinforcing Filler in Polyisoprene. Plastics, Rubber and Composites, 28, 1-10. http://dx.doi.org/10.1179/146580199322913269
- Usman, M.A., Adeosun, S.O. and Osifeso, G.O. (2012) Optimum Calcium Carbonate Filler Concentration for Flexible Polyurethane Foam Composite. Journal of Minerals & Materials Characterization & Engineering, 11, 311-320.
- Adeosun, S.O., Usman, M.A., Ayoola, W.A. and Bodude, M.A. (2013) Physico-Mechanical Responses of Polypropylene—Calcium Carbonate Composite. Journal of Minerals and Materials Characterization and Engineering, 1, 145-152. http://dx.doi.org/10.4236/jmmce.2013.14025
- Leong, Y.W., Abu Bakar, M.B., Mohd Ishak, Z.A., Ariffin, A. and Pukanszky, B. (2004) Comparison of the Mechanical Properties and Interfacial Interactions between Talc, Kaolin, and Calcium Carbonate Filled Polypropylene Composites. Journal of Applied Polymer Science, 91, 3315-3326. http://dx.doi.org/10.1002/app.13542
- Zuiderduin, W.C.J., Westzaan, C., Huetink, J. and Gaymans, R.J. (2003) Toughening of Polypropylene with Calcium Carbonate Particles. Polymer, 44, 261-275. http://dx.doi.org/10.1016/S0032-3861(02)00769-3
- Lazzeri, A., Zebarjad, S.M., Pracella, M., Cavalier, K. and Rosa, R. (2005) Filler Toughening of Plastics. Part I—The Effect of Surface Interactions on Physico-Mechanical Properties and Rheological Behavior of Ultrafine CaCO3/HDPE Nanocomposites. Polymer, 46, 827-844. http://dx.doi.org/10.1016/j.polymer.2004.11.111
- Youssef, H.A., Ismail, M.R., Ali, M.A.M. and Zahran, A.H. (2009) Studies on Sugarcane Bagasse Fiber—Thermoplastics Composites. Journal of Elastomers and Plastics, 41, 245-262. http://dx.doi.org/10.1177/0095244308095014
- Esnaashari, C., Khorasani, S.N., Entezam, M. and Khalili, S. (2013) Mechanical and Water Absorption Properties of Sawdust—Low Density Polyethylene Nanocomposite. Journal of Applied Polymer Science, 127, 1295-1300. http://dx.doi.org/10.1002/app.37624
- Ning, N., Zhang, W., Yan, J., Xu, F., Wang, T., Su, H., Tang, C. and Fu, Q. (2013) Largely Enhanced Crystallization of Semi-Crystalline Polymer on the Surface of Glass Fiber by Using Graphene Oxide as a Modifier. Polymer, 54, 303-309. http://dx.doi.org/10.1016/j.polymer.2012.11.045
- Atikler, U., Basalp, D. and Tihminlioglu, F. (2006) Mechanical and Morphological Properties of Recycled High-Density Polyethylene, Filled with Calcium Carbonate and Fly Ash. Journal of Applied Polymer Science, 102, 4460-4467. http://dx.doi.org/10.1002/app.24772
- Ahmad, I. and Mahanwar, P.A. (2010) Mechanical Properties of Fly Ash Filled High Density Polyethylene. Journal of Minerals & Materials Characterization & Engineering, 9, 183-198.
- Abdel-Salam, S.I., Metwally, M.S., Abdel-Hakim, A.A., El Begawy, S. and Elshafie, E.S. (2011) Effect of Mineral Fillers on Rice Straw Fiber/High Density Polyethylene Composites. Nature and Science, 9, 116-124.
- Kord, B. (2011) Effect of Calcium Carbonate as a Mineral Filler on the Physical and Mechanical Properties of Wood Based Composites. World Applied Sciences Journal, 13, 129-132.
- Sirin, K., Balcan, M. and Dogan, F. (2012) The Influence of Filler Component on Mechanical Properties and Thermal Analysis of PP-LDPE and PP-LDPE/DAP Ternary Composites. In: Dogan, F., Ed., Polypropylene, InTech. http://www.intechopen.com/books/polypropylene/the-influence-of-filler-component-on-mechanical-propertiesand-thermal-analysis-of-pp-ldpe-and-p
- Oksman, K. and Clemon, C. (1998) Mechanical Properties and Morphology of Impact Modified Polypropylene-Wood Flour Composites. Journal of Applied Polymer Science, 67, 1503-1513. http://dx.doi.org/10.1002/(SICI)1097-4628(19980228)67:9<1503::AID-APP1>3.0.CO;2-H
- Abbas-Abadi, M.S., Haghighi, M.N. and Yeganeh, H. (2012) Effect of the Melt Flow Index and Melt Flow Rate on the Thermal Degradation Kinetics of Commercial Polyolefins. Journal of Applied Polymer Science, 126, 1739-1745. http://dx.doi.org/10.1002/app.36775
- Cifrulak, S.D. (1970) High-Pressure Mid-Infrared Studies of Calcium Carbonate. American Mineralogist, 55, 815-824.
- Gulmine, J.V., Janissek, P.R., Heise, H.M. and Akcelrud, L. (2002) Polyethylene Characterization by FTIR. Polymer Testing, 21, 557-563. http://dx.doi.org/10.1016/S0142-9418(01)00124-6
- Rajandas, H., Parimannan, S., Sathasivam, K., Ravichandran, M. and Yin, L.S. (2012) A Novel FTIR-ATR Spectroscopy Based Technique for the Estimation of Low-Density Polyethylene Biodegradation. Polymer Testing, 31, 1094- 1099. http://dx.doi.org/10.1016/j.polymertesting.2012.07.015
- Valles-Lluch, A., Contat-Rodrigo, L. and Ribes-Greus, A. (2003) Differential Scanning Calorimetry Studies on Highand Low-Density Annealed and Irradiated Polyethylenes: Influence of Aging. Journal of Applied Polymer Science, 89, 3260-3271. http://dx.doi.org/10.1002/app.12479
- Hitachi High-Tech (1986) DSC Measurement of Polyethylene—The Correlation of Polyethylene Density and Melting. TA No. 26.
- Poltimäe, T., Tarasova, E., Krumme, A., Roots, J. and Viikna, A. (2011) Thermal Analyses of Blends of Hyper Branched Linear Low-Density Polyethylene (LLDPE) with High-Density Polyethylene and LLDPE Prepared by Dissolving Method. Materials Science, 17, 254-259. http://dx.doi.org/10.5755/j01.ms.17.3.589
- Richardson, M.J. (1972) Precision Differential Calorimetry and the Heat of Fusion of Polyethylene. Journal of Polymer Science Part C, 38, 251-259.
NOTES

*Corresponding author.