Food and Nutrition Sciences
Vol.5 No.9(2014), Article ID:44527,12 pages DOI:10.4236/fns.2014.59092
Metabolomic Studies Using High Performance Liquid Chromatography and Tandem Mass Spectrometry to Discover Quality Markers for Oriental Beauty (Dongfang Meiren) Tea
Yi-Hong Chen*, Yu-Hui Liu, Yi-Jhen Wu, Chu-Chin Chen
Food Industry Research and Development Institute, Hsinchu, Taiwan
Email: *cyh@firdi.org.tw
Copyright © 2014 by authors and Scientific Research Publishing Inc.
This work is licensed under the Creative Commons Attribution International License (CC BY).
http://creativecommons.org/licenses/by/4.0/


Received 11 February 2014; revised 11 March 2014; accepted 18 March 2014
ABSTRACT
In this study, a high-performance liquid chromatograph and an electrospray ionization (ESI) triple quadrupole mass spectrometry (TQ MS) detector were used to scan Oriental Beauty tea of different grades and prices. Principle component analysis (PCA) of the profiling data was performed for pattern recognition, clearly showing that the proposed MS profiling method was able to classify Oriental Beauty tea into different grades. The component mass ions primarily responsible for the separation were selected with high loading strength in the PCA for subsequent identification with tandem mass (MS/MS). Caffeine, citrate and salicylate were verified, whereas certain other compounds remained ambiguous. Regression analysis considering caffeine, citrate and salicylate showed a linear relationship between the prices of the Oriental Beauty tea with an adjusted R2 of 0.84. If all the selected marker ions (in addition to caffeine, citrate and salicylate) could have been identified and incorporated into regression analysis, a stronger relationship could have been confirmed. These results suggest that metabolomics can facilitate the determination of real markers in the quality control of Oriental Beauty tea, and may lead to the further application of metabolomics in other food quality controls.
Keywords
Dongfang Meiren; High Performance Liquid Chromatography; Mass Spectrometry; Metabolic Profiling; Metabolomics; Oriental Beauty; Quality; Tea

1. Introduction
Metabolomics has become a promising research discipline that is synergistic with genomics and proteomics in system biology. This technique can be used to study a living organism following the perturbation of diseases, chemicals, or gene defects [1] . This discipline involves the metabolic profiling of biological fluids or tissues followed by mathematical calculations for pattern recognition, highlighting the subtle and gross differences among samples [2] . Consequently, metabolomics not only serves as a platform to measure holistic changes in a living organism, but can also be used to identify the compounds responsible for metabolic changes. Therefore, metabolomics has been extensively applied in pharmaceutical studies for toxicity evaluation and drug development [3] -[5] , biological studies for deciphering diverse phenotypes resulting from the various genetic or environmental origins of plants [6] -[8] and microorganisms [9] -[12] . In addition, foods can be viewed as complex chemical mixtures consisting of various metabolites and chemical additives [13] . The metabolomic techniques used in biological studies are also pertinent to the study of foods to characterize vegetable oils based on their polar components [14] or amino acid profiles [15] , identify the biochemical effects of dietary components [16] [17] , and ensure the quality and safety of foods during processing and storage [18] [19] .
Metabolomics includes the use of high-field proton nuclear magnetic resonance (NMR) or mass spectrometry (MS) techniques for the detection and identification of metabolites. Both of the techniques are effective and achieve a high throughput in profiling for pattern recognition. Time-of-flight (TOF) MS has been widely used because of its high sensitivity and resolution [18] [20] -[24] . The exact mass data of the metabolites obtained from TOF MS can be annotated by consulting several open databases (e.g., the Chemistry WebBook of the National Institute of Standards and Technology (NIST) and Kyoto Encyclopedia of Genes and Genomes (KEGG)) [25] . Further structural analysis with triple quadrupole (TQ) MS may be performed to determine the chemical identities of the metabolites. Therefore, a metabolomic study may need TOF MS for pattern recognition and component annotation followed by TQ MS for component identification. However, relatively few laboratories own both instruments, and most laboratories possess only the less expensive TQ MS for the targeted identification of food components. The authors hope that the TQ MS approach can be applied to non-targeted studies involving all facets of the food metabolomics generally performed with more advanced TOF MS.
Chen et al. [26] showed that TQ MS alone is good enough to some extend in both pattern recognition and component identification in a metabolomic study of the high-fat dietary effects of altering rat urine metabolites. In this study, we performed metabolomics using only TQ MS to find the chemical markers of Oriental Beauty tea in the hope that these markers can be used to determine the quality of the tea. Oriental Beauty tea is a local specialty of Hsinchu, Taiwan. The tea leaves have white edges, a strong fruity aroma, and a sweet taste that results from the oxidation of leaves after being bitten by a common pest, the tea green leafhopper (Jacobiasca formosana) [27] . Commercial Oriental Beauty tea is sold in different grades and prices based on subjective producer perceptions of its physical and sensory properties. Therefore, chemical markers from metabolomics can serve as unbiased and complementary factors for judging quality.
2. Materials and Methods
2.1. Materials
Three commercial grades of Oriental Beauty tea (T100, T300, and T750), sold at the prices around 100, 300 and 750 US$/kg, respectively, were purchased from a local farm in Hsinchu County, Taiwan. The teas were all manufactured from tea leaves harvested in the summer of 2012. Formic acid was purchased from Riedel-de Haen (Seelze, Germany) and acetonitrile (HPLC grade) was purchased from Tedia (Fairfield, OH, USA). Caffeine was purchased from US Pharmacopeia (Rockville, MD, USA) and citrate monohydrate was purchased from Merck (Darmstadt, Germany).
2.2. Tea Preparation
Tea was prepared by brewing 4 g of tea leaf in 250 mL of water at 90˚C for 5 min. The tea samples were collected and stored at −20˚C until LC/MS analysis was performed. The frozen tea samples were allowed to thaw at room temperature and filtered through a 0.22 mm PVDF membrane before analysis.
2.3. MS Analysis
The experiments in this study were conducted with an LC-MS/MS system including a Waters 600E multi-solvent delivery pump, a Waters 2487 UV/VIS detector (Milford, MA, USA), and a Quattro LC MS/MS detector (Wythenshawe, UK) with an electrospray ionization (ESI) probe. The capillary voltage was 3 kV. The desolvation temperature was 300˚C, and the extraction cone voltage was 20 V. Samples were resolved in gradient by a Luna 150 ´ 2, 3 m, C18(2), 100 Å column (Phenomenex, Torrance, CA, USA) before MS/MS detection for total ion scanning or product ion scanning. The total ions were scanned from 100 to 1000 m/z with a scan time of 1800 ms and an interscan delay of 100 ms. This resolving power provided an appropriate unit-mass resolution across the entire scanning range [2] . The product ions at each m/z value of interest were scanned at various collision energy settings to obtain better results for chemical structure elucidation. The sample size was 10 μL, and the flow rate was 0.2 mL/min. Both Solvent A (H2O) and Solvent B (acetonitrile) contained 0.1% (v/v) formic acid. The gradient was programmed as follows: 5% B for 1 min, linear increase from 5% to 95% B in 9 min, 95% B for 5 min, linear decrease to 5% B in 5 min, and elution for 30 min before analysis.
2.4. Data Analysis
The method of Plumb et al. [2] for data arrangement was adopted. The mass spectra were combined for each base peak intensity (BPI) chromatogram of total ion scanning. The peak list and ion abundances were then exported to an Excel (Microsoft, Seattle, WA, USA) file and aligned in order, with zeros inserted as intensity values where no ion signal was observed. Each line of data had one intensity value for each m/z integer between 100 and 1000. The data sets were then transferred to STATISTICA software (StatSoft, Inc., Tulsa, OK, USA) for principle component analysis (PCA) using a factor analysis module.
3. Results and Discussion
3.1. LC-MS
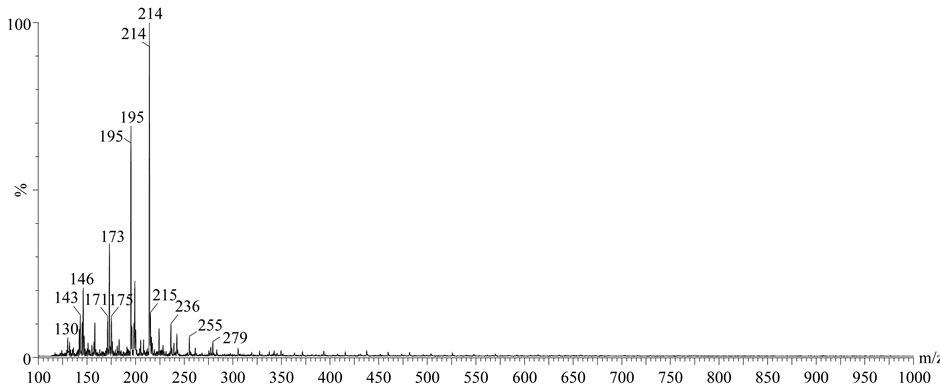
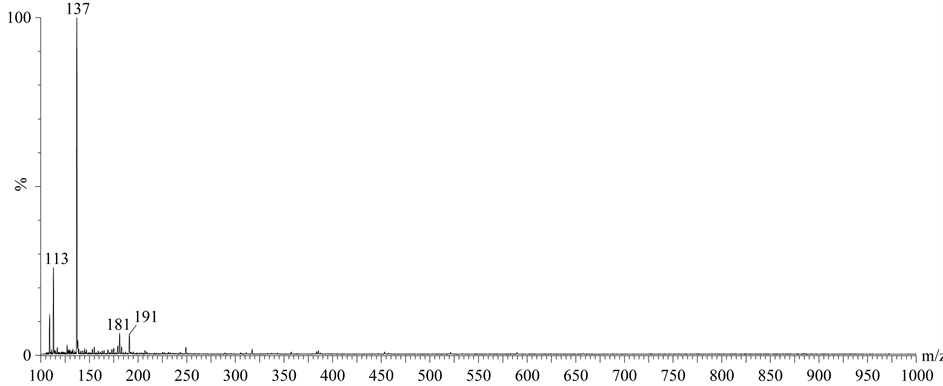
Positive and negative ion scanning was performed. Regardless of the grade of tea, all samples showed positive and negative total ion chromatograms similar to those shown in Figure 1(a) and Figure 1(b), respectively. Positive ions produced a substantially higher scanning response than negative ions, and therefore, provided more information for interpretation. However, the results of negative ion scanning provided complementary information in addition to the results of positive ion scanning. The total ion chromatograms were transformed to base peak chromatograms and the spectra of both positive and negative scans were summated to obtain the intensity for each m/z value from 100 to 1000 (Figure 2 and Figure 3). The positive ion spectra showed the highest response ions at m/z 214, 195, and 173 among others, and the negative ion spectra showed 137 and 113 among others. However, no explicit differences appeared among the samples of different tea grades. Statistics analysis of all the detected ions was then performed to determine the differences among the tea samples.
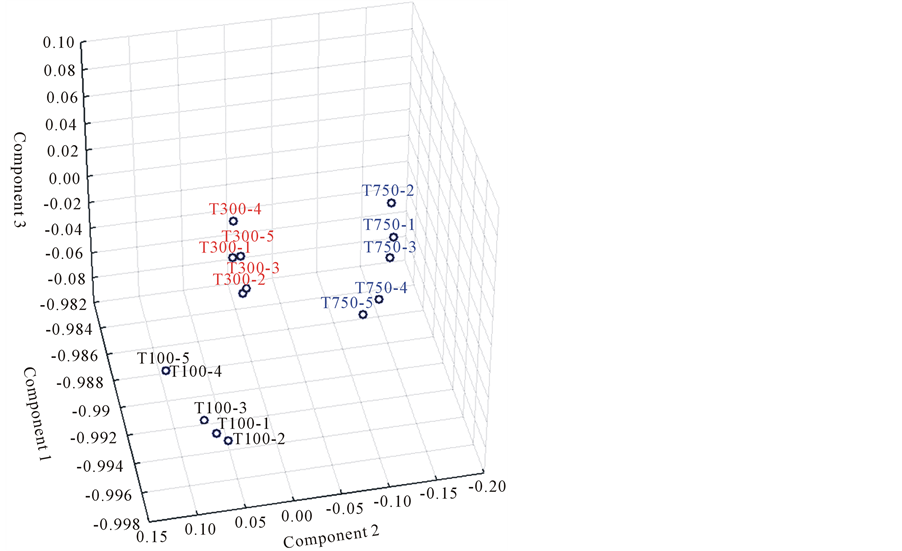
3.2. Principle Component Analysis
The principle component analysis (PCA) in this study was performed using the entire data set of response intensities. The m/z values clearly show a variation among tea samples. The samples of each tea grade produced consistent results, as evidenced by the confined space on the score plot (Figure 4(a), Figure 4(b)). The score plot of positive ions (Figure 4(a)) shows 3 well-separated data clusters. These results indicate that the chemical qualities of the 3 tea samples can be easily differentiated by monitoring the m/z 100-1000 chemical constituents. Conversely, the results of negative ions (Figure 4(b)) did not show data groups separated as far as the positive ion data groups. Although the data of each tea grade was also clustered within a confined space on the score plot, only the T100 cluster was far from the T300 and T750 clusters. The T300 and T750 data clusters tangled together, indicating that the characteristics of these 2 grades of tea may not be easy to differentiate. Therefore, positive ion scanning is a better choice for analyzing the quality of Oriental Beauty tea if PCA score differences are the only data available. However, the chemical constituents resulted in the PCA score differences are the most noteworthy results. Both positive and negative ion scanning contributed equally, and the loading strength of each ion toward score differences were esteemed. Loading plots (Figure 5) showed the mass ions responsible for the mapping of tea samples to different regions on the score plots. Five positive ions of m/z 173, 195, 196,
 (a)
(a)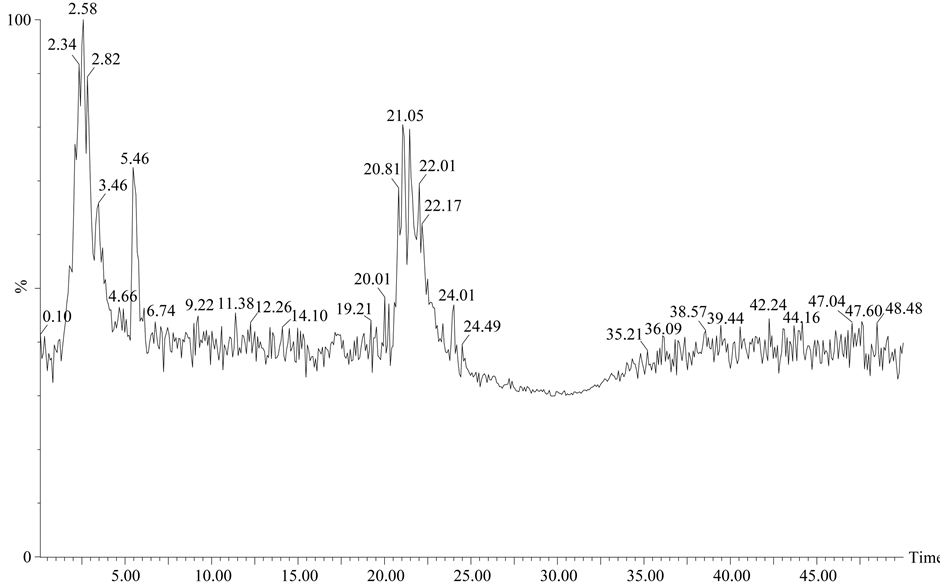 (b)
(b)
Figure 1. Total (a) positive and (b) negative ion chromatograms of the T300-5 Oriental Beauty tea. Mass scanning from m/z 100 to 1000. MS chromatograms of T100 and T750 samples showed very similar profile patterns to those above. (a) Positive ion chromatogram; (b) Negative ion chromatogram.
 (a)
(a)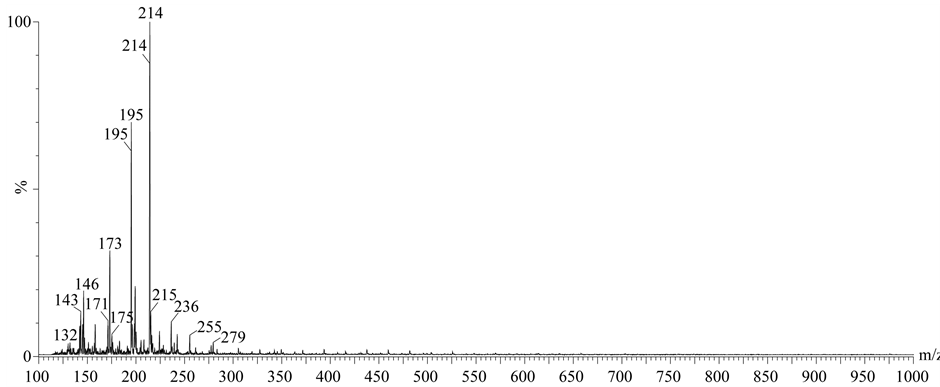 (b)
(b)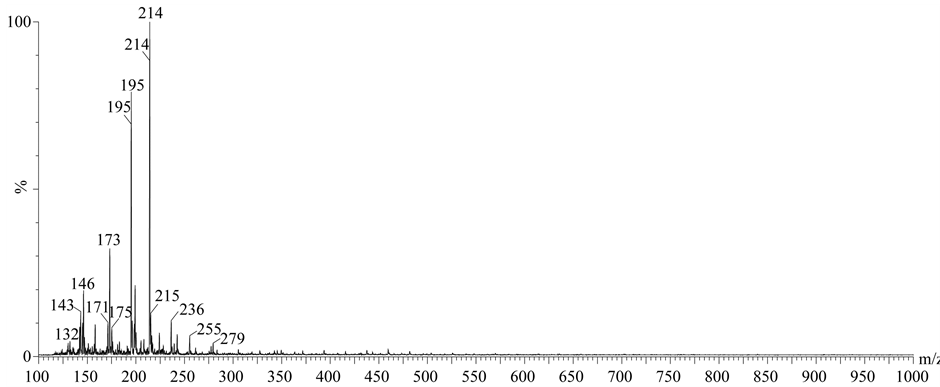 (c)
(c)
Figure 2. Summated spectra from the positive ion BPI chromatograms of the tea samples of (a) T100-3; (b) T300-3; and (c) T750-3.
 (a)
(a)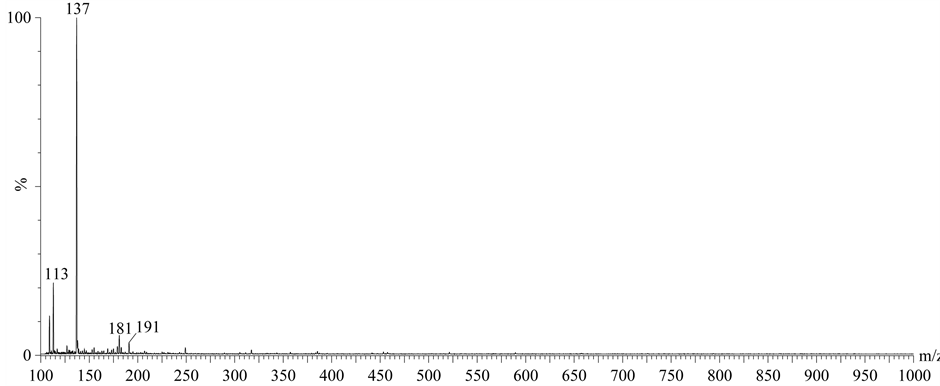 (b)
(b) (c)
(c)
Figure 3. Summated spectra from the negative ion BPI chromatograms of the tea samples of (a) T100-3; (b) T300-3; and (c) T750-3.
 (a)
(a)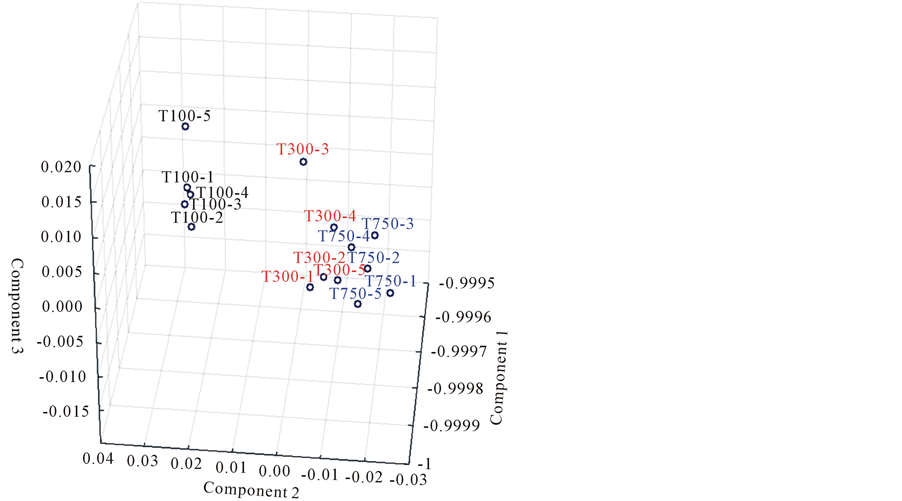 (b)
(b)
Figure 4. Score plots of the PCA. (a) Positive ion score plot; (b) Negative ion score plot.
214, and 215 showed a greater loading strength than other ions in the loading plot (Figure 5(a)), with the highest of m/z 195 appearing along the Component 1 axis. Two negative ions of m/z 137 and 191 had greater loading strengths (Figure 5(b)) along the axes of Components 1 and 2, respectively. These 7 ions represented the most influential chemical constituents for determining the quality of Oriental Beauty tea. They can be used as markers for the quality control of Oriental Beauty tea after their chemical structures were resolved.
 (a)
(a)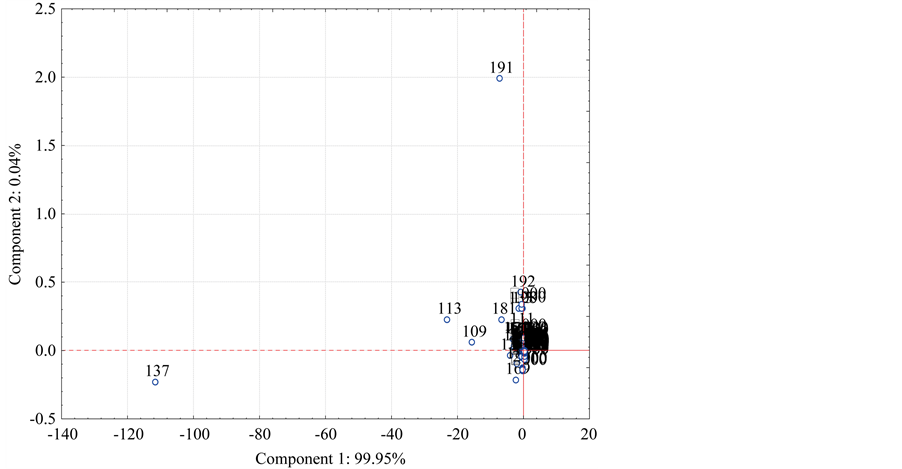 (b)
(b)
Figure 5. Loading plots of the PCA. (a) Positive ion loading plot; (b) Negative ion loading plot.
3.3. Tandem Mass (MS/MS) Analysis
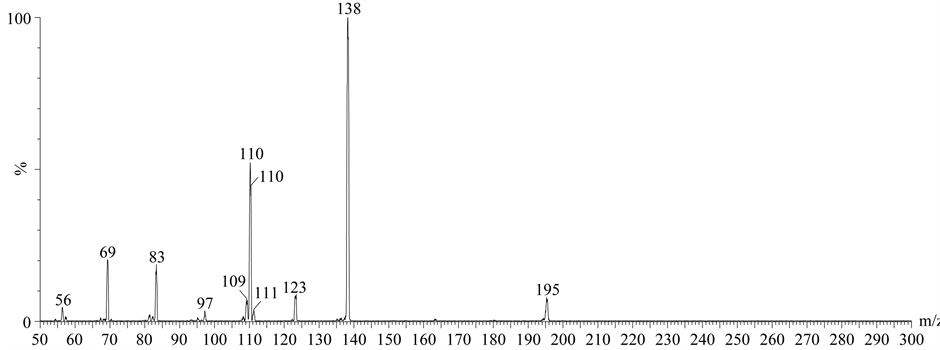
Before the MS/MS analysis of the ion with a specific m/z value to decipher its chemical structure, prediction is always performed by consulting online databases such as KEGG, METLIN, or the NIST Chemistry WebBook [25] . Previous metabolomic studies have usually relied on TOF mass spectrometers to provide a mass accuracy of an interested metabolite to the third decimal place. This accuracy helps in the database searching process by reducing the number of possible hits for an interested m/z value. Unfortunately, only the lower precision of TQ MS was available for this study, requiring elaborate database searching with reasonable guesses and a measure of luck. For example, the molecular weight of 194 was used to search for a possible chemical species with a positive m/z 195 ion in the NIST Chemistry WebBook. Thousands of hits were found without any search restrictions. Because the samples were natural products, we confined the chemical search to elements selected from C, H, O, N, or S, which reduced the number of hits and enabled easier judgment. Fifty-three species were found in the chemical formula containing only C, H, O, and N, and caffeine was considered the best prospect because this study involved teas. MS/MS analyses were then performed for the positive m/z 195 ion in all tea samples and the caffeine standard. The HPLC retention time and product ion profile verified that the positive m/z 195 ion in samples was caffeine (Figure 6). Similar procedures were performed to identify the remaining 6 ions. The positive m/z 196 ion was speculated to be an isotope of the m/z 195 ion because it exhibited the same HPLC retention time and relative abundance. The MS/MS analysis of the positive m/z 196 ion showed a similar product ion profile and relative abundance to those of the positive m/z 195 ion, providing strong evidence that these m/z 195 and 196 ions are isotopes. The positive m/z 214 and 215 ions were also speculated to be isotopes. A NIST database search also produced many hits. However, these m/z 214 and 215 ions were low in abundance, and MS/MS analyses did not provide explicit product ion fragments for chemical identification. The isotope frequency encountered in this study is likely the result of using a TQ MS detector for mass scanning because its sensitivity is not as high as that of a TOF MS detector. The positive m/z 173 ion was also low in abundance. Its chemical identity was not as easy to identify without proper enrichment before MS/MS analysis. The negative m/z 137 and 191 ions were also identified as salicylate and citrate, respectively, based on database consultation and MS/MS chromatographic reference from standard chemicals (data not shown). Caffeine and citrate are both crucial plant components in many metabolic processes. Both compounds were recorded in the KEGG Pathway
 (a)
(a)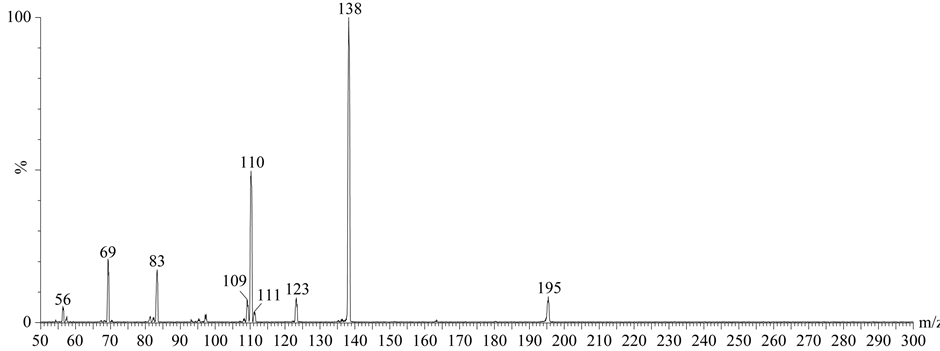 (b)
(b)
Figure 6. Product ion spectra of (a) caffeine and (b) the positive m/z 195 ion in T100-1 sample. The concentration of caffeine standard was 1 mM. Collision energy for MS/MS was 25 eV. (a) Product ion spectrum of caffeine; (b) Product ion spectrum of positive m/z 195 ion in T100-1 sample.
of map01060 (biosynthesis of plant secondary metabolites) and map01065 (biosynthesis of alkaloids derived from histidine and purine). Salicylate, on the other hand, is an important phenolic phytohormone mediating in plant defense against pathogens [28] .
The concentrations of caffeine, citrate and salicylate in the tea samples were further determined with HPLCMS/MS. The mass reaction monitoring of 195 > 110 in the positive mode was used for caffeine, whereas 191 > 85 and 137 > 93 in the negative mode were used for citrate and salicylate, respectively. The results of this study show that the tea T100 and T300 samples had equal amounts (p > 0.05) of caffeine (above 1000 mM) (Table 1). The T750 samples had a significantly (p ≤ 0.05) lower caffeine content than other samples. On the other hand, the citrate concentration of the T100 samples was significantly higher than those of the other 2 samples, which were equally low at approximately 50 mM. T300 had the significantly (p ≤ 0.05) highest salicylate content at 18.1 mM than the other two tea samples, which had salicylate contents at around 13 mM. Multiple regression analysis was then performed using the price of tea as the dependent variable, although price does not necessarily represent tea quality, and the identified plant chemicals as the independent variables. The linear price contour plane generated with caffeine and citrate as the only independent variables showed an adjusted R2 value of 0.56 (data not shown), which means that caffeine and citrate together had a 56% possibility of determining the price (quality) of Oriental Beauty tea. Better yet, if caffeine, citrate and salicylate were to be used together to judge the price of Oriental Beauty tea, an adjusted R2 value of 0.84 was obtained. A greater adjusted R2 value is usually obtained when more independent variables are used in the multiple regression analysis, and especially those with a high loading strength from PCA, which contribute substantially. Unfortunately, not all chemical identities of the ions with high loading strength in the PCA study were identified, and could therefore not be incorporated with caffeine and citrate to improve tea quality determination. This study may be criticized for being unlike typical metabolomic studies which have used a TOF MS detector for metabolic profiling to facilitate the annotation of MS ions. However, the annotated ions could not be verified until they were enriched before MS/MS analysis with a TQ MS detector. The real bottleneck lies in a lack of interested ion enrichment, a technology that requires complex instruments and is not usually performed in metabolomics. This study shows that using a single affordable TQ MS detector for both metabolic profiling and component identification may require laborious works in annotation. However, this technique demonstrates here to achieve a good result, making this a low-budget alternative for metabolomic study.
4. Conclusion
Mass spectrometry is becoming more popular than nuclear magnetic resonance (NMR) in metabolomics because of its accuracy and data acquisition rate. A TOF MS detector is the preferred detector in metabolic profiling because its mass accuracy facilitates the follow-up provisional annotation of various components based on database consultation. However, component identification cannot be completed without a validated, compound-specific method [29] such as MS/MS analysis for structural elucidation by TQ MS detector. Therefore, MS-based metabolomics research typically involves a TOF MS detector and a TQ MS detector. We have demonstrated a successful metabolomic study based on a single TQ MS detector for both metabolic profiling and component identification. Although this method may require more laborious annotation than the TOF MS technique, a single detector can be used throughout the metabolomic study, rendering this approach more affordable and useful for low-budget laboratories. In the study of Oriental Beauty tea, we used metabolomics to distinguish caffeine, citrate, salicylate and certain other unidentified components as important markers of tea quality. The contents of caffeine, citrate and salicylate varied among different grades of Oriental Beauty tea. But together, they had a fairly good linear regressional relationship to the price of tea with an adjusted R2 value of 0.84. Incorporating

Table 1. Concentrations of caffeine and citrate in different grades of Oriental Beauty tea sample.
*Values are mean ± SD (n = 5). Values with different superscript characters are significantly different among samples (p ≤ 0.05).
more markers in the analysis should improve the relevance toward the price, rendering the model more feasible for quality control.
Acknowledgements
The authors greatly appreciate the financial support for this study from the Ministry of Economic Affairs, Taiwan (102-EC-17-A-01-05-0643).
References
- Nicholson, J.K., Connelly, J., Lindon, J.C. and Holmes, E. (2002) Metabonomics: A Platform for Studying Drug Toxicity and Gene Function. Nature Reviews Drug Discovery, 1, 153-161. http://dx.doi.org/10.1038/nrd728
- Plumb, R.S., Stumpf, C.L., Gorenstein, M.V., Castro-Perez, J.M., Dear, G.J., Anthony, M., Sweatman, B.C., Connor, S.C. and Haselden, J.N. (2002) Metabonomics: The Use of Electrospray Mass Spectrometry Coupled to ReversedPhase Liquid Chromatography Shows Potential for the Screening of Rat Urine in Drug Development. Rapid Communications in Mass Spectrometry, 16, 1991-1996. http://dx.doi.org/10.1002/rcm.813
- Cascante, M., Boros, L.G., Comin-Anduix, B., de Atauri, P., Centelles, J.J. and Lee, P.W. (2002) Metabolic Control Analysis in Drug Discovery and Disease. Nature Biotechnology, 20, 243-249. http://dx.doi.org/10.1038/nbt0302-243
- Lindon, J.C., Holmes, E., Bollard, M.E., Stanley, E.G. and Nicholson, J.K. (2004) Metabonomics Technologies and Their Applications in Physiological Monitoring, Drug Safety Assessment and Disease Diagnosis. Biomarkers, 9, 1-31. http://dx.doi.org/10.1080/13547500410001668379
- Watkins, S.M. and German, J.B. (2002) Metabolomics and Biochemical Profiling in Drug Discovery and Development. Current Opinion in Molecular Therapeutics, 4, 224-228.
- Fiehn, O. (2002) Metabolomics—The Link Between Genotypes and Phenotypes. Plant Molecular Biology, 48, 155-171. http://dx.doi.org/10.1023/A:1013713905833
- Fiehn, O., Kopka, J., Dörmann, P., Altmann, T., Trethewey, R.N. and Willmitzer, L. (2000) Metabolite Profiling for Plant Functional Genomics. Nature Biotechnology, 18, 1157-1161. http://dx.doi.org/10.1038/81137
- Roessner, U., Luedemann, A., Brust, D., Fiehn, O., Linke, T., Willmitzer, L. and Fernie, A. (2001) Metabolic Profiling Allows Comprehensive Phenotyping of Genetically or Environmentally Modified Plant Systems. Plant Cell, 13, 11-29.
- Allen, J., Davey, H.M., Broadhurst, D., Heald, J.K., Rowland, J.J., Oliver, S.G. and Kell, D.B. (2003) High-Throughput Classification of Yeast Mutants for Functional Genomics Using Metabolic Footprinting. Nature Biotechnology, 21, 692-696. http://dx.doi.org/10.1038/nbt823
- Almaas, E., Kovács, B., Vicsek, T., Oltvai, Z.N. and Barabási, A.L. (2004) Global Organization of Metabolic Fluxes in the Bacterium Escherichia coli. Nature, 427, 839-843. http://dx.doi.org/10.1038/nature02289
- Smedsgaard, J. and Nielsen, J. (2005) Metabolite Profiling of Fungi and Yeast: From Phenotype to Metabolome by MS and Informatics. Journal of Experimental Botany, 56, 273-286. http://dx.doi.org/10.1093/jxb/eri068
- van der Werf, M.J., Overkamp, K.M., Muilwijk, B., Coulier, L. and Hankemeier, T. (2007) Microbial Metabolomics: Toward a Platform with Full Metabolome Coverage. Analytical Biochemistry, 370, 17-25. http://dx.doi.org/10.1016/j.ab.2007.07.022
- Picariello, G., Mamone, G., Addeo, F. and Ferranti, P. (2012) Novel Mass Spectrometry-Based Applications of the “Omic” Sciences in Food Technology and Biotechnology. Food Technology and Biotechnology, 50, 286-305.
- Catharino, R.R., Haddad, R., Cabrini, L.G., Cunha, I.B., Sawaya, A.C. and Eberlin, M.N. (2005) Characterization of Vegetable Oils by Electrospray Ionization Mass Spectrometry Fingerprinting: Classification, Quality, Adulteration, and Aging. Analytical Chemistry, 77, 7429-7433. http://dx.doi.org/10.1021/ac0512507
- Lerma-García, M.J., Ramis-Ramos, G., Herrero-Martínez, J.M. and Simó-Alfonso, E.F. (2007) Classification of Vegetable Oils According to Their Botanical Origin Using Amino Acid Profiles Established by Direct Infusion Mass Spectrometry. Rapid Communications in Mass Spectrometry, 21, 3751-3755. http://dx.doi.org/10.1002/rcm.3272
- Nishikawa, Y., Dmochowska, B., Madaj, J., Xue, J., Guo, Z., Satake, M., Reddy, D.V., Rinaldi, P.L. and Monnier, V.M. (2003) Vitamin C Metabolomic Mapping in Experimental Diabetes with 6-Deoxy-6-Fluoro-Ascorbic Acid and High Resolution 19F-Nuclear Magnetic Resonance Spectroscopy. Metabolism, 52, 760-770. http://dx.doi.org/10.1016/S0026-0495(03)00069-6
- Solanky, K.S., Bailey, N.J., Beckwith-Hall, B.M., Davis, A., Bingham, S., Holmes, E., Nicholson, J.K. and Cassidy, A. (2003) Application of Biofluid 1H Nuclear Magnetic Resonance-Based Metabonomic Techniques for the Analysis of the Biochemical Effects of Dietary Isoflavones on Human Plasma Profile. Analytical Biochemistry, 323, 197-204. http://dx.doi.org/10.1016/j.ab.2003.08.028
- Ercolini, D., Russo, F., Nasi, A., Ferranti, P. and Villani, F. (2009) Mesophilic and Psychrotrophic Bacteria from Meat and Their Spoilage Potential in Vitro and in Beef. Applied and Environmental Microbiology, 75, 1990-2001. http://dx.doi.org/10.1128/AEM.02762-08
- Ercolini, D., Casaburi, A., Nasi, A., Ferrocino, I., Di Monaco, R., Ferranti, P., Mauriello, G. and Villani, F. (2010) Different Molecular Types of Pseudomonas fragi Have the Same Overall Behaviour as Meat Spoilers. International Journal of Food Microbiology, 142, 120-131. http://dx.doi.org/10.1016/j.ijfoodmicro.2010.06.012
- Idborg, H., Zamani, L., Edlund, P.O., Schuppe-Koistinen, I. and Jacobsson, S.P. (2005) Metabolic Fingerprinting of Rat Urine by LC/MS. Part 1. Analysis by Hydrophilic Interaction Liquid Chromatography-Electrospray Ionization Mass Spectrometry. Journal of Chromatography B, Analytical Technologies in the Biomedical and Life Sciences, 828, 9-13. http://dx.doi.org/10.1016/j.jchromb.2005.07.031
- Idborg, H., Zamani, L., Edlund, P.O., Schuppe-Koistinen, I. and Jacobsson, S.P. (2005) Metabolic Fingerprinting of Rat Urine by LC/MS. Part 2. Data Pretreatment Methods for Handling of Complex Data. Journal of Chromatography B, Analytical Technologies in the Biomedical and Life Sciences, 828, 14-20. http://dx.doi.org/10.1016/j.jchromb.2005.07.049
- Plumb, R.S., Granger, J.H., Stumpf, C.L., Wilson, I.D., Evans, J.A. and Lenz, E.M. (2003) Metabonomic Analysis of Mouse Urine by Liquid Chromatography-Time of Flight Mass Spectrometry (LC-TOFMS): Detection of Strain, Diurnal and Gender Differences. The Analyst, 128, 819-823. http://dx.doi.org/10.1039/b304296k
- Plumb, R.S., Stumpf, C.L., Granger, J.H., Castro-Perez, J., Haselden, J.N. and Dear, G.J. (2003) Use of Liquid Chromatography/Time-of-Flight Mass Spectrometry and Multivariate Statistical Analysis Shows Promise for the Detection of Drug Metabolites in Biological Fluids. Rapid Communications in Mass Spectrometry, 17, 2632-2638. http://dx.doi.org/10.1002/rcm.1250
- Wilson, I.D., Nicholson, J.K., Castro-Perez, J., Granger, J.H., Johnson, K.A., Smith, B.W. and Plumb, R.S. (2005) High Resolution “Ultra Performance” Liquid Chromatography Coupled to oa-TOF Mass Spectrometry as a Tool for Differential Metabolic Pathway Profiling in Functional Genomic Studies. Journal of Proteome Research, 4, 591-598. http://dx.doi.org/10.1021/pr049769r
- Werner, E., Heilier, J.F., Ducruix, C., Ezan, E., Junot, C. and Tabet, J.C. (2008) Mass Spectrometry for the Identification of the Discriminating Signals from Metabolomics: Current Status and Future Trends. Journal of Chromatography B, Analytical Technologies in the Biomedical and Life Sciences, 871, 143-163. http://dx.doi.org/10.1016/j.jchromb.2008.07.004
- Chen, Y.-H., Chen, C.-H., Lin, C.-J. and Chen, C.-C. (2009) Metabonomic Study with a High Performance Liquid Chromatography Coupling to a Triple Quadrupole Mass Spectrometer to Identify Biomarkers from Urine of High-Fat Fed and Streptozotocin Treated Rats. Journal of Food and Drug Analysis, 17, 28-35.
- Wikipedia (2013) Dongfang Meiren. http://en.wikipedia.org/wiki/Dongfang_meiren_tea
- Hayat, S. and Ahmad, A. (2007) Salicylic Acid—A Plant Hormone. Springer, Berlin. http://dx.doi.org/10.1007/1-4020-5184-0
NOTES

*Corresponding author.