Food and Nutrition Sciences
Vol. 3 No. 7 (2012) , Article ID: 20509 , 5 pages DOI:10.4236/fns.2012.37124
Cost and Calorie Analysis of Fast Food Consumption in College Students
![]()
1Department of Nutrition Science, East Carolina University, Greenville, USA; 2Department of Nutrition, University of TennesseeKnoxville, Knoxville, USA; 3Department of Community Health Sciences, College of Applied Medical Sciences-King Saud University, Riyadh, KSA; 4Statistics & Research Consultant, East Carolina University, Greenville, USA.
Email: *heidalk@ecu.edu
Received May 11th, 2012; revised June 11th, 2012; accepted June 18th, 2012
Keywords: Cost Analysis; Students; Health; Food; Energy Intake
ABSTRACT
The purpose of this research was to assess money spent and calories consumed by college students from fast food restaurants located on and around a southern college campus. A convenience sample (n = 152) of undergraduate college students (aged 18 - 24) at a southern university participated in a survey that measured dietary intake from seven local fast food chains using a researcher developed food frequency questionnaire and a lifestyle behavior survey that collected data on health practices. A strong positive correlation was found between total monthly fast food expense and total monthly fast food caloric consumption (r(150) = 0.94, p < 0.05), indicating a significant linear relationship between the two variables. An independent-samples t test comparing the mean monthly fast food restaurant expense males to females found a significant difference between the two groups (t(150) = 4.19, p < 0.05). The more money spent by college students contributed to a higher amount of calories consumed from fast food in a typical month. Future research needs to determine if college students are contributing to the high obesity rate and if limiting fast food restaurants on and around college campuses would help decrease fast food consumption in college students.
1. Introduction
Consumption of fast food, prevalence of obesity, and related health problems have risen greatly over the past several decades [1]. In 2006, one out of every five United States dollars spent on retail shopping was accounted for by food and beverage purchases [2]. Consuming more energy than is used, leads to weight gain and obesity. Over a 15 year period, individuals that consumed fast food more than twice a week gained approximately 10 pounds and had twice the increase of insulin resistance, which has been linked to type 2 diabetes, than individuals that consumed fast food less than twice a week [3]. Americans who consumed three to six meals per week from fast food had a significantly higher body mass index (BMI) than those who consumed none or one to two meals per week from fast food [4]. Overall, adults who reported any fast food consumption were significantly more likely to be overweight [5].
Individuals who eat fast food tend to consume more total calories with less nutritional value (i.e. vitaminsminerals, fiber) compared to those who do not consume fast food [6]. In addition to calories, adults who ate fast food also consumed higher amounts fat and refined sugar compared to those who did not eat fast food [5]. Although most fast food restaurants now offer some healthier options, this may not have an effect on food selection and the healthier choices provided by fast food restaurants remain higher in sodium, calories, and saturated fat than what is recommended for a 2000 calorie based diet [7].
Younger adults have a high consumption of fast food. Individuals aged 19 to 20 years consumed fewer calories from home and more calories from fast foods as compared to adolescents 12 to 18 years of age [8]. Adults between 20 to 29 years of age had significantly greater consumption of fast food, approximately four times greater, as compared to those aged 55 years and older [6]. College students aged 19 to 25 years have reported that the top reasons reported for fast food consumption were convenience and cost (convenience being to top reason) [9]. A similar study concluded that college students aged 19 to 24 years were consuming fast food for convenience (which was in the top two reasons for consuming fast food) and males were likely to choose fast food due to the cost [10]. Males tend to consume more fast food items per week than females [11,12].
Southern states have the highest incidence of obesity with Alabama, Mississippi, and Tennessee as the top three states for obesity in 2007, while West Virginia, North Carolina, South Carolina, and Georgia were not far behind [13]. From 2004 to 2006, Alabama, Mississippi, and Tennessee were also among the highest for percentage of adults with diabetes in the United States (Alabama 9.3%, Tennessee 9.4%, Mississippi 10.1%) [14]. In 2006, Greenville, North Carolina was ranked number one for heavy fast food users per capita [15].
Although research has been conducted on fast food consumption among college students, no research has related dollar amount spent to calories consumed by college students. The purpose of this study was to assess money spent by college students on fast food and calories consumed from specific identified fast food items from seven chains of fast food restaurants located on and in close proximity of a college campus. The researchers wanted to explore how frequently these popular fast food chains were visited by college students and what impact, these dietary choices had on their health and budget.
2. Methods and Materials
A peer-reviewed, researcher developed Fast Food Food Frequency Questionnaire (FFFQ) was used in conjunction with a validated College Life Survey to collect data on the health status and food consumption of traditional college students at a moderate sized southern university. Five Registered Dietitians reviewed the FFFQ to ensure there were no missing food items, and the food items included were appropriate. The College Life Survey was previously validated by college students using test-retest. Traditional college students, aged 18 to 24 years, currently enrolled at the university were recruited to complete the surveys on campus using flyers and giveaways (stress balls and pencils). Students who completed the surveys were also entered in a drawing to win a $100 gift certificate to the university bookstore.
2.1. Fast Food Frequency Questionnaire
The FFFQ included 123 food and beverage items sold at seven fast food restaurants that were located either oncampus or near campus. These restaurants and food and beverage items were selected based on a previous survey, in which college students identified the fast food restaurants frequented most often. The restaurants identified included McDonalds (13 food items, 4 beverages), Burger King (15 food items, 4 beverages), Subway (15 food items, 2 beverages), Wendy’s (12 food items, 2 beverages), Taco Bell (28 food items, 2 beverages), Chic-Fil-A (12 food items, 3 beverages), and Bojangles (9 food items, 2 beverages). The food categories that were assessed included soft drinks and other sweetened beverages, chicken, hamburgers, French Fries, and desserts. Taco Bell’s food items included burritos, tacos, nachos, fried rice, and quesadillas and Subway included 6-inch and 12-inch sandwiches. Medium serving sizes were based on each restaurant’s posted medium serving size at that time. A small serving size was one-half the size of a medium serving, and a large serving was considered at least  times the medium serving.
Frequency of food and beverage consumption was determined by the number of times an individual food was reported to be consumed for a month by each participant and summing all the foods and beverages by category for each participant. For each food and beverage item, the participants selected the frequency of consumption measured as: none (0), once per month (1), less than once per week (3), 1 - 2 times per week (6), 3 - 4 times per week (14), 5 - 6 times per week (22), daily (30), or more than once per day (60). Estimated intakes were calculated for each food and beverage item by multiplying the frequency by the selected serving size: small (0.5), medium (1), or large (1.5).
These specific food and beverage items were identified from each of the seven fast food chains and local pricing at the time of the study were recorded for calculating dollars spent. A researcher visited each of the restaurants and documented the cost of each food item of interest. Prices were recorded for small, medium and large (supersized) food items.
2.2. College Life Survey
The College Life Survey consisted of 37 questions, which included information on demographic status, medical status, anthropometric measurements, and lifestyle behaviors. This study was part of a larger study that investigated demographic status, anthropometric measurements, and living environment. Demographic questions included: gender, age, marital status, and income. Body Mass Index (BMI) was calculated from the weight and height measures. Students were also asked about their living environment, including if they lived onor offcampus, if they had a campus meal plan, and who was generally responsible for their meal preparations (self, significant other, dining hall, fast food, parent). Statistics were performed using the Statistical Program for Social Sciences (SPSS), version 17.0. All procedures were approved by the University’s Internal Review Board.
3. Results
A total of 152 college students participated in this study. Participants were 40% (n = 61) male and 60% (n = 91) female students. All surveyed students reported fast food consumption in the past month. Seventy-one percent (n = 108) reported having a university meal plan. The frequency of university meal plans by male and female students were 68% and 74%, respectively. Sixty-two percent of participants reported living on campus. Eightythree percent of students who reported having a university meal plan lived on campus and 31% of those living off campus reported having a university meal plan.
A Pearson correlation coefficient was calculated for the relationship between total monthly fast food expense and total monthly fast food calorie consumption. A strong positive correlation was found (r(150) = 0.94, p < 0.05), indicating a significant linear relationship between the two variables.
An independent-samples t test comparing the mean monthly fast food restaurant expense male to female students found a significant difference between the two groups (t(150) = 4.19, p < 0.05). The mean male students’ monthly fast food restaurant expense was significantly higher $99.17 ± 87.75 compared to female students’ $52.11 ± 50.52. An independent-samples t test comparing mean monthly caloric intake male to female students found a significant difference between the two groups (t(150) = 4.82, p < 0.05). The mean monthly caloric intake for male students was significantly higher 17657.66 ± 16874.34 compared to female students 8053.80 ± 7222.73.
An independent-samples t test was calculated comparing mean monthly fast food restaurant expense for students with and without a university meal plan. No significant difference was found (t(150) = 1.47, p > 0.05). Money spent on specific fast food restaurants for those who had a meal plan versus those who did not have a meal plan are shown in Table 1. The mean for students with a university meal plan $65.57 ± 58.51 was not significantly different from those students without a meal
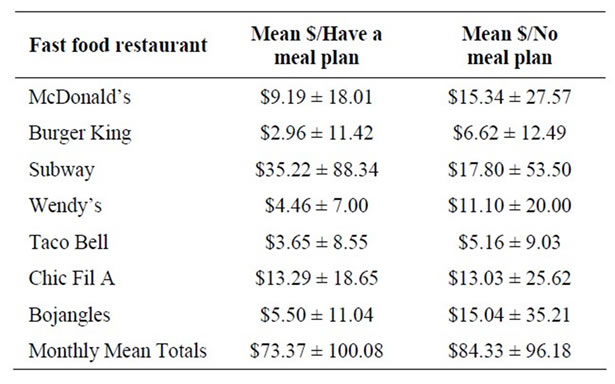
Table 1. Mean dollar spent per month by specific fast food chain restaurant for those with a meal plan compared to those without a meal plan.
plan $84.33 ± 96.18. An independent-samples t test was calculated comparing mean monthly caloric consumption from fast food restaurants for students with a university meal plan to students without a university meal plan. No significant difference was found (t(150) = 1.93, p > 0.05). The mean for students with a meal plan 10629.92 ± 10439.69 was not significantly different from those without a meal plan 15044.76 ± 17305.05.
An independent-samples t test was calculated comparing mean monthly fast food restaurant expense for students living on and off campus. No significant difference was found (t(149) = 0.78, p > 0.05). The mean dollars spent by students living on campus ($67.28 ± 71.29) was not significantly different from students living off campus ($76.68 ± 72.74). An independent-samples t test was calculated comparing mean monthly caloric consumption from fast food restaurants for students living on and off campus. No significant difference was found (t(149) = 1.38, p > 0.05). The mean calories consumed from fast food for students living on campus (10762.51 ± 11917.07) was not significantly different from students living off campus (3751.12 ± 14365.64).
Specific fast food chain items and money spent at specific fast food chains are presented in Table 2. Mean monthly fast food restaurant expense for students with a healthy BMI ($60.81 ± 53.22), overweight ($77.80 ± 74.95), and obese ($98.37 ± 108.93) were compared using a one-way ANOVA. No significant difference was found (F(2145) =2.61, p > 0.05). Figure 1 summarizes percent BMI category within group for gender and meal plan. Mean monthly fast food restaurant caloric consumption for students with a healthy BMI (9971.97 ± 9141.58), overweight (14154.20 ± 15971.52), and obese (14815.84 ± 15992.49) were compared using a one-way ANOVA. No significant difference was found (F(2,145) = 2.12, p > 0.05).
4. Discussion
The amount of money spent on fast food is associated with total calories consumed. The higher dollar value spent on fast food the more total calories consumed by college students. Students spent an overall average of $71 and consumed approximately 12,000 calories per month. Assuming this is a typical month, each college student would then approximately spend $850 and consume 144,000 calories each year from fast food based on reported consumption from these seven fast food restaurants alone that were located on or near this southern university campus.
Male students spent significantly (p < 0.05) more money and consumed significantly (p < 0.05) more calories on fast food than female students. Male students spent $47 more and consumed approximately 9600 more

Table 2. Dollar value spent and frequency per month by fast food chain restaurants for select food items with comparable calories.
calories per month than female students from fast food. Male students spent approximately $1200 on fast food a year on these specific fast food restaurants which is similar to previous research that found that men consumed more fast food than women [11]. In a typical month college students without a university meal plan spent approximately $19 dollars more and consumed approximately 4400 calories more on fast food than those with a meal plan. However, these groups were not significantly different (p > 0.05) for money spent or calories consumed. Students without a university meal plan probably did not consume food from dining halls on a regular basis. These students may have spent more money on fast food due to convenience. Research supports that convenience is one of the primary reasons for fast food consumption among college students [9,10].
There was also no significant difference (p > 0.05) in dollars spent and fast food consumption for students living on and off campus. Students living off campus spent approximately $9 more and consumed approximately 3000 calories per month on fast food. The majority of students that reported living off campus did not have a meal plan. This may suggest that those living off campus may choose fast food due to convenience or may choose other fast food restaurants that are not located on or in close proximity to campus.
Though not significantly different, a trend was found for BMI category, money spent, and calories consumed from fast food. Students in the obese body weight category spent approximately $38 and consumed almost 5000 more calories per month on fast food than students in the other weight categories. Obese students consumed

Figure 1. Percent BMI category within group for gender and meal plan.
almost 1.5 pounds more per month and 18 pounds more per year in calories from fast food than healthy and overweight students. This study did not examine weight gain or changes over time; therefore, weight gain over the previous year can not be determined. Research has shown that individuals with a higher fast food intake are more likely to have a higher BMI [4,5].
Limitations to this study include the limited number of fast food restaurants and food and beverage items included on the Fast Food Frequency Questionnaire. It is possible that participants may have consumed fast foods from other restaurants and other food and beverage items not captured in this survey. This data relies on self-reported intake of monthly fast food consumption.
Overall, students at this southern university are spending money and consuming calories on fast food. The more money college students spent contributed to a higher amount of calories consumed from fast food in a typical month. Males spent more money and consumed more calories than females. More dollars were spent and more calories were consumed from fast food in individuals in the higher BMI category. More nutrition education on college campuses may be beneficial in educating college students on the possible long term health effects from over consuming fast food and high caloric intakes. Future research needs to identify if college students are aware of calories consumed and money spent on fast food. Future research needs to determine if limiting fast food restaurant chains on and around college campuses will help decrease the fast food consumption in college students.
REFERENCES
- R. Jeffery, J. Baxter, M. McGuire and J. Linde, “Are Fast Food Restaurants an Environmental Risk Factor for Obesity?” International Journal of Behavioral Nutrition and Physical Activity, Vol. 3, 2006, p. 35. doi:10.1186/1479-5868-3-2
- J. Tillotson, “Fast Food-Through the Ages Part 1,” Nutrition Today, Vol. 43, No. 1, 2008, pp. 70-74. doi:10.1097/01.NT.0000303315.59534.d7
- M. Pereira, A. Kartashov, C. Ebbeling, L. Horn, M. Slattery, D. Jacobs and S. Ludwig, “Fast Food Habits, Weight Gain, and Insulin Resistance (the CARDIA Study): 15-Year Prospective Analysis,” The Lancet, Vol. 365, No. 9453, 2005, pp. 36-42. doi:10.1016/S0140-6736(04)17663-0
- “Price and Taste Trump Nutrition When Americans Eat Out,” ScienceDaily, 2009. http://www.sciencedaily.com
- S. Bowen and B. Vinyard, “Fast Food Consumption of US Adults: Impact on Energy and Nutrient Intakes and Overweight Status,” Journal of the American College of Nutrition, Vol. 23, No. 2, 2004, pp. 163-168.
- L. Harnack and S. French, “Fattening up on Fast Food,” Journal of the American Dietetic Association, Vol. 103, No. 10, 2003, pp. 1296-1297. doi:10.1016/j.jada.2003.08.029
- “Defensive Eating at Fast Food Restaurants,” Consumer Reports on Health, Vol. 20, No. 4, 2008, p. 1, 3, 5.
- S. Nielsen, A. Siega-Riz and B. Popkin, “Trends in Food Locations and Sources among Adolescents and Young Adults,” Preventive Medicine, Vol. 35, No. 2, 2002, pp. 107-113. doi:10.1006/pmed.2002.1037
- J. Driskell, Y. Kim and K. Goebel, “Few Differences Found in the Typical Eating and Physical Activity Habits of Lower-Level and Upper-Level University Students,” Journal of the American Dietetic Association, Vol. 105, No. 11, 2005, pp. 798-801. doi:10.1016/j.jada.2005.02.004
- K. Morse and J. Driskell, “Observed Sex Differences in Fast Food Consumption and Nutrition Self Assessments and Beliefs of College Students,” Nutrition Research, Vol. 3, 2009, pp. 173-179. doi:10.1016/j.nutres.2009.02.004
- A. Feeley, J. Pettifor and S. Norris, “Fast Food Consumption among 17-Year-Olds in the Birth to Twenty Cohort,” South African Journal of Clinical Nutrition, Vol. 22, No. 3, 2009, pp. 118-123.
- S. Bowen, S. Gortmaker, C. Ebbeling, M. Pereira and D. Ludwig, “Effects of Fast Food on Energy Intake and Diet Quality among in Children in a National Household Survey,” Pediatrics, Vol. 113, No. 1, 2004, pp. 112-118. doi:10.1542/peds.113.1.112
- Center for Disease Control, “Overweight and Obesity,” 2007. http://www.cdc.gov
- “F as in Fat: How Obesity Policies Are Failing in America,” 2009. http://healthyamericans.org
- “Boyle M: The Fast-Food Capital of America,” 2009. http://money.cnn
NOTES
*Corresponding author.