American Journal of Plant Sciences
Vol.06 No.14(2015), Article ID:59592,5 pages
10.4236/ajps.2015.614233
Genetic Diversity of Peanut (Arachis hypogea L.) Cultivars as Revealed by RAPD Markers
Mohannad G. Al-Saghir1*, Abdel-Salam G. Abdel-Salam2
1Department of Environmental and Plant Biology, Department of Biological Sciences, Ohio University Zanesville, Zanesville, OH, USA
2Department of Mathematics, Statistics and Physics, Qatar University, Doha, Qatar
Email: *al-saghi@ohio.edu
Copyright © 2015 by authors and Scientific Research Publishing Inc.
This work is licensed under the Creative Commons Attribution International License (CC BY).
http://creativecommons.org/licenses/by/4.0/


Received 18 August 2015; accepted 12 September 2015; published 15 September 2015
ABSTRACT
The objectives of this study were to evaluate the genetic diversity of the peanut accessions using Random Amplified Polymorphic DNA (RAPD) molecular marker and to evaluate RAPD markers to be used in peanut as genetic markers and improve such techniques as suitable strategies for peanut germplasm characterization. Twenty peanut accessions were included in this study and were subjected to RAPD molecular markers analysis. Twenty-seven RAPD primers produced 210 amplification products of which 80 (36.4%) were polymorphic. In conclusion, this study reported a successful fingerprinting of peanut accessions using RAPD markers and demonstrated the usefulness of these markers in estimating the extent of genetic variation in peanut germplasm.
Keywords:
RAPD, Peanut, Arachis hypogea, Genetic Diversity

1. Introduction
Peanut (Arachis hypogea L.) is one of the important oil and protein crops in the world. Peanut breeders in the USA have successfully developed hundreds of improved cultivars [1] . Knowledge of diversity patterns will allow breeders to better understand the evolutionary relationships among accessions, to sample germplasm in a more systematic fashion, and to develop strategies to incorporate useful diversity in their breeding programs [2] .
Different approaches were used to assay genetic diversity in crop plants including morphological traits, and isozyme electrophoresis, however, these techniques are insufficient to serve as accurate markers due to environmental influences on morphological traits and insufficient polymoprhism produced among closely related genotypes [3] .
Certain properties are desirable for a molecular marker such as highly polymorphic behavior, co dominant inheritance, and frequent occurrence in the genome, even distribution throughout the genome, selectively neutral behavior, easy access, easy and fast assay and high reproducibility [4] [5] . Examples of such DNA molecular markers are: random amplified polymorphic DNA (RAPDs) [5] [6] .
RAPD markers had proved to be good genetic markers to assay and evaluate the genetic diversity between and within the same species, populations and individuals [6] . RAPD marker depends on the amplification of DNA sequence by polymerase chain reaction using only a single primer of arbitrary nucleotide sequence. The technique has proved to be fast and simple needs small quantities of template DNA, beside its ability to detect relatively small amounts of genetic variation [7] [8] .
The objectives of this study were to characterize the molecular diversity of the peanut accessions by analyzing the DNA amplification products using RAPD molecular markers, evaluate RAPD method to be used in peanut as genetic markers and improve such techniques as suitable strategies for peanut germplasm characterization.
2. Material and Methods
2.1. Plant Material and DNA Extraction
This study was conducted between 04/2013 and 04/2014 at Ohio University Zanesville. Seeds represented 20 genotypes of peanut and two genotypes of Arachis duranensis to be used as an out-group were obtained from US department of Agriculture (USDA-ARS germplasm) (Table 1).

Table 1. USDA Arachis hypogea germplasm collection used in this study.
DNA was extracted from the young leaves of green house planted seedlings (4 week old) using DN easy Plant Mini Kit (QIAGEN Inc., Valenica, CA, USA).
2.2. RAPD Amplification
Thirty random primers (10-mer) from two kits (A and B) (Eurfins MWG Operon, Huntsville, AL, USA) of arbitrary sequence were used in this study (Table 2).
Table 2. Random primers used to screen peanut germplasm for RAPDs.
RAPD reactions were done in a total volume of 20 µl containing 20 - 60 ng of template DNA, 60 ng of each primer, 10 Ml of Taq PCR Master Mix (QIAGEN Inc., Valencia, CA, USA) and 8 ML of PCR water (QIAGEN Inc., Valencia, CA, USA). Template DNA was initially denatured at 94˚C for 2 min followed by 35 cycles for 1 min at 94˚C, at annealing temperature of 37˚C for 1 min and at 72˚C for 2 min as an extension step. The final extension step was done for 8 min at 72˚C and the reactions were kept at soak file at 4˚C.
The RAPD-PCR amplified products were analyzed by gel electrophoresis in 1.5% ultrapure agarose in 1X TBE buffer stained with ethidium bromide (0.5 µg/ml) at 100 volts using horizontal gel electrophoresis apparatus (Sigma Chemical Co. Louis, MO, USA). The amplified products were visualized under UV light and photographed with digital Olympus C-7070 camera (Olympus imaging America Inc., Melville, NY, USA). 1 kb ladder was used as a DNA standard to estimate the molecular weights of the amplified products.
2.3. Statistical Analysis
For each individual RAPD primer, PCR amplified products were designated. Data were scored on the basis of the presence or absence of the amplified products. If the product is present in a genotype, it was scored as 1, if absent, it was designated as 0. Using the SAS statistical computer program [9] , genetic similarities between the peanut genotypes were calculated using the simple matching coefficient and clustered by unweighted pairs group method with arithmetic average (UPGMA) based on the average linkage method of calculating distance between clusters [10] .
3. Results and Discussion
Out of a total of 220 amplification products (0.2 to 4 kilo base pairs) using twenty-seven primers, 80 (36.4%) were polymorphic and 140 products were shared among all genotypes (not polymorphic). The twenty-four primers (OPA-02, OPA-03, OPA-04, OPA-05, OPA-07, OPA-09, OPA-10, OPA-11, OPA-12, OPA-13, OPA-14, OPA-15, OPA-16, OPA-17, OPA-18, OPA-19, OPA-20, OPB-03, OPB-04, OPB-05, OPB-06, OPB-07, OPB-10, OPB-11, OPB-12) produced different banding patterns for all genotypes. While sixteen primers (OPA-01, OPA-06, OPA-08, OPB-01, OPB-02, OPB-08, OPB-09, OPB-13, OPB-14, OPB-15, OPB-16, OPB-17, OPB-18, OPB-19 and OPB-20) detected no polymorphism although they did successfully amplify a range of monomorphic bands.
Two major clusters resulted: One cluster included by itself (S1 to S8) and the second cluster included the rest of the accessions (S9 to S20). The third cluster had the two out groups of Arachis duranensis (Figure 1). The genetic distance between first and the second cluster was 6.6.
Cluster analysis of each RAPD profiles (Figure 1) showed that a significant genetic variation was detected in peanut accessions which could reflect different genetic background. Moreover, cluster analysis showed that samples S1 to S8 and S9 to S20 were genetically close (they showed 96% similarity).
The dendrogram (Figure 1) showed that the RAPD methodology was sensitive enough to detect low levels of variation in peanut accessions.
The current study aimed on using the PCR-based protocols to assess genetic variability and to fingerprint genotypes of peanut. Random amplified polymorphic DNA (RAPD) had been used effectively to assess the amount of genetic diversity in germplasm collections. Using wheat, barley, rye and wheat-barley addition lines, Weining and Langridge (1991) detected polymorphism using conserved, semi random and random primers [4] . With different combinations of primers, they were able to detect both inter and intra specific diversity. In this study it was possible to show that the amplification products from 27 random primers (RAPD assay) were sufficient to discriminate among individual genotypes of peanut.
Few genetic studies have been conducted on peanut cultivars. In recent studies, fingerprints based on different markers were compared using genotypes from different species. There were both agreements and disagreements in findings based on different markers and species: The study of Brassica oleracea by Lanner-Herrera et al. (1996) [11] , a moderate spearman’s rank correlation (r = 0.38) between RAPD and isozyme distances was found. Russell et al. (1997) [12] compared the levels of genetic variation among barley accessions revealed by RFLP, AFLP, SSR, and RAPD, and reported that when the spearman’s rank correlation was used, the correlation between SSR and RAPD was 0.235, the highest correlation was found between RFLP and AFLP (0.708).
Because of the low number of the genetic studies and the poor resolution of some employed molecular markers in these studies, more studies like the current study need to be done in order to evaluate and estimate the ge-
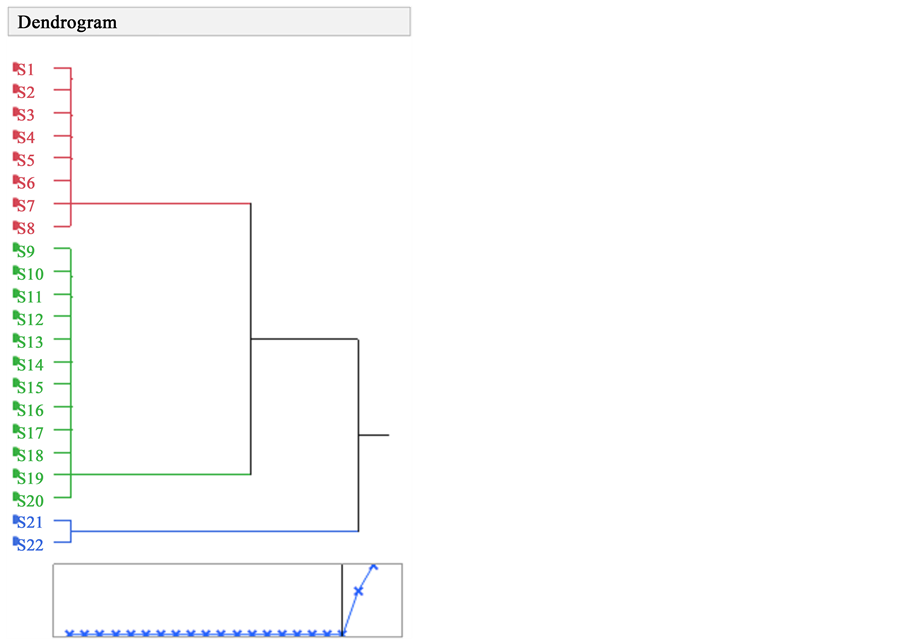
Figure 1. Dendrogram derived from the UPGMA procedure using genetic distances generated from the AMOVA program depicting the relationships among peanut accessions. Genetic distances are estimated from RAPD markers. Red = the first cluster which includes genotypes S1 to S8, Green = the second cluster which includes genotypes S9 to S20, Blue = outgroups S21 to S22.
netic diversity in the peanut germplasm.
4. Conclusions
In conclusion, this study reported a successful fingerprinting of peanut accessions using RAPD and demonstrated the usefulness of these markers in estimating the extent of genetic variation in peanut germplasm. The current results are supported by many recent molecular studies [13] [14] .
The use of RAPD markers in Arachis must be further continued in order to drive specific linkage between RAPD markers and genes controlling agronomically important characters. These diagnostic molecular tools will greatly assist in the identification of new and different sources of diversity which may help breeders to decide what genotypes to cross for making new genetic combinations and to determine which genetic resources should be retained in a collection in order to conserve maximum genetic diversity in the gene bank.
Acknowledgements
The authors are grateful for US Department of Agriculture for providing the peanut cultivars and for Ohio University Zanesville for funding this project.
Cite this paper
MohannadG. Al-Saghir,Abdel-SalamG. Abdel-Salam, (2015) Genetic Diversity of Peanut (Arachis hypogea L.) Cultivars as Revealed by RAPD Markers. American Journal of Plant Sciences,06,2303-2308. doi: 10.4236/ajps.2015.614233
References
- 1. Fehr, W.R. (1984) Genetic Contributions to Grain Yields of Five Major Crop Plants. CSSA Spec. Publ. 7. CSSA and ASA Madison, WI.
- 2. Bretting, P.K. and Widrlechner, M.P. (1995) Genetic Markers and Plant Genetic Resource Management. Vol. 13, In: Janick, J., Ed., Plant Breeding Reviews, John Wiley & Sons, Inc., New York, 11-87.
http://dx.doi.org/10.1002/9780470650059.ch2
http://onlinelibrary.wiley.com/doi/10.1002/9780470650059.ch2/summary - 3. Matus, I.A. and Hayes, P.M. (2002) Genetic Diversity in Three Groups of Barley Germplasm Assessed by Simple Sequence Repeats. Genome, 45, 1095-1106.
http://dx.doi.org/10.1139/g02-071 - 4. Weining, S. and Langridge, P. (1991) Identification and Mapping of Polymorphisms in Cereals Based on the Polymerase Chain Reaction. Theoretical and Applied Genetics, 82, 209-216.
http://dx.doi.org/10.1007/BF00226215
http://link.springer.com/article/10.1007%2FBF00226215#page-1 - 5. Song, W. and Henry, R.J. (1995) Molecular Analysis of the DNA Polymorphism of Wild Barley (Hordeums pontaneum) Germplasm Using the Polymerase Chain Reaction. Genetic Resources and Crop Evolution, 42, 237-281.
http://dx.doi.org/10.1007/BF02431262
www.scar.ac.cn/hhkxen/ch/reader/create_pdf.aspx?file_no=2012601 - 6. Welsh, J. and McCeleand, M. (1990) Fingerprinting Genomes Using PCR with Arbitrary Primers. Nuclear Acids Research, 18, 7213-7218.
http://dx.doi.org/10.1093/nar/18.24.7213
http://docsdrive.com/pdfs/ansinet/ajps/2006/1002-1006.pdf - 7. Williams, J.G.K., Kubelik, A.R., Livak, K.J., Rafalski, A. and Tingey, S.V. (1990) DNA Polymorphisms Amplified by Arbitrary Primers Are Useful as Genetic Markers. Nuclear Acids Research, 18, 6531-6535.
http://dx.doi.org/10.1093/nar/18.22.6531
www.academicjournals.org/journal/IJBMBR/article.../CCEFA3441326 - 8. Warburton, M.L. and Bliss, F.A. (1996) Genetic Diversity in Peach (Prunuspersica L. Batch) Revealed by Randomly Amplified Polymorphic DNA (RAPD) Markers and Compared to Inbreeding Coefficients. Journal of American Society of Horticultural Science, 121, 1012-1019.
http://journal.ashspublications.org/content/121/6/1012.abstract - 9. SAS Institute Inc. SAS 9.2. Help and Documentation. SAS Institute Inc., Cary, 2002-2009.
- 10. Rohlf, F.J. (1993) Numerical Taxonomy and Multivariate Analysis System NTSys-PC Version 1.80 Exeter Software. New York.
www.exetersoftware.com/downloads/ntsysguide21.pdf - 11. Lanner-Herrera, C., Gustagsson, M., Falt, A.S. and Bryngelsson, T. (1996) Diversity in Natural Populations of Wild Brassica olereacea as Estimated by Isozyme and RAPD Analysis. Genetic Resources and Crop Evolution, 43, 13-23.
http://dx.doi.org/10.1007/BF00126936 - 12. Russell, J.R., Fuller, J.D., Macaulay, M., Hatz, B.G., Jahoor, A., Powell, W. and Waugh, R. (1997) Direct Comparison of Levels of Genetic Variation among Barley Accessions Detected by RFLPs, AFLPs, SSRs and RAPDs. Theoretical and Applied Genetics, 95, 714-722.
http://dx.doi.org/10.1007/s001220050617 - 13. Powell, W., Morgante, M., Andre, C., Hanafey, M., Vogel, G., Tingey, S. and Rafalski, A. (1996) The Utility of RFLP, RAPD, AFLP and SSR (Microsatellite) Markers for Germplasm Analysis. Molecular Breeding, 2, 225-238.
http://dx.doi.org/10.1007/BF00564200
www.scielo.br/pdf/gmb/v27n4/22428.pdf - 14. Raina, S.N., Rani, V., Kojima, T., Ogihara, Y., Singh, K.P. and Devarumath, R.M. (2001) RAPD and ISSR Fingerprints as Useful Genetic Markers for Analysis of Genetic Diversity, Varietal Identification, and Phylogenetic Relationships in Peanut (Arachishypogaea) Cultivars and Wild Species. Genome, 44, 763-772.
http://dx.doi.org/10.1139/gen-44-5-763
http://www.nrcresearchpress.com/doi/abs/10.1139/g01-064#.VdJWBLTVvzI
NOTES

*Corresponding author.