Open Journal of Applied Sciences
Vol.06 No.08(2016), Article ID:70230,14 pages
10.4236/ojapps.2016.68057
Basic Study on the Evaluation of Thermoplastic Polymers as Hot-Melt Adhesives for Mixed-Substrate Joining
S. Schaible1, C. Bernet1, P. Ledergeber1, T. Balmer2, C. Brändli1*
1Institute of Materials and Process Engineering, Zurich University of Applied Sciences, Winterthur, Switzerland
2Sonova AG, Staefa, Switzerland

Copyright © 2016 by authors and Scientific Research Publishing Inc.
This work is licensed under the Creative Commons Attribution-NonCommercial International License (CC BY-NC).
http://creativecommons.org/licenses/by-nc/4.0/


Received 21 July 2016; accepted 28 August 2016; published 31 August 2016
ABSTRACT
A selection of 22 low-melting polymers was thermally and rheologically evaluated to be used as hot-melt adhesives in mixed-substrate joining samples. The choice of polymers was based on the published melting point. It was required to include a broad variety of different polymers backbones to study the influence of the different polymers comprehensively. A tool-box of widely applicable tests was developed to judge if a thermoplastic polymer is suitable for a hot-melt adhesive application. Melting temperature (onset, peak and offset temperature) and melting enthalpy were determined using standardized methods. Rheological methods were used to characterize the shear rate dependence and the flow behavior at the application temperature. The wetting behavior of the polymers was evaluated with contact angle measurements. The adhesive strength of the most promising candidates was analyzed using the Lumi Frac-adhesion method including the failure pattern.
Keywords:
Hot-Melt Adhesives, Thermal Analysis, Rheology, Mechanical Properties

1. Introduction
Adhesives are widely used in industry and are the ideal joining technology to bond different materials [1] - [8] . Hot-melt adhesives are a special class of adhesives based typically on low melting polymers without the use of any solvent, without curing and crosslinking. They are applied among others in packaging, textile, building and construction, and electronic industry due to the ease of processing, low health issues, good chemical resistance, and typically low price. The fundamental characteristics, recent developments and prospective research of hot- melt adhesives have been reviewed by Li et al. [9] and an adhesion model has been developed to describe the influence of the surface tension, bonding temperature, spreading, and the visco-elastic loss tangent on hot-melt adhesive [10] .
Engineers are often confronted with the vast amount of polymers possibly suitable for a specific hot-melt adhesive application. Data sheet properties are often unclear or specific to the producer and do not represent the need in the application. In this context, 22 polymers were chosen and thermally and rheologically characterized with standardized and self-developed methods. Further, two adhesive performance tests were developed for a first fast evaluation if the adhesive may adhere to polyamide (PA) and titanium (Ti). A relatively new test method based on centrifugal principles was used which can easily measure adhesion forces in a parallel manner which was ideally suited for this evaluation study [11] [12] .
Ethylene-vinyl acetate copolymers are among the most commonly used hot-melt adhesive in industry and in the scientific literature [13] - [18] . Blends of ethylene-vinyl acetate copolymers with aromatic hydrocarbon resins were rheologically characterized and the adhesion properties were investigated [13] . Different vinyl acetate contents were screened for the influence on the viscoelastic behavior [14] . Tackifier compatibility was investigated using dynamic mechanical thermal analysis and it was found that tackifiers based on rosin were better compatible than tackifiers based on hydrocarbon resins [15] . A ternary blend consisting of ethylene-vinyl acetate copolymer, calcium carbonate, and terpene phenol resin was studied rheologically and the strength of adhesion was correlated to the viscoelastic nature of the material [17] .
Most of the test methods discussed in this paper were exemplary performed on different ethylene-vinyl acetate copolymers grades. Ethylene-vinyl acetate copolymers are produced in a wide range of melt flow indices and are showing good adhesion properties to various adherents. The properties of ethylene-vinyl acetate copolymers are mainly affected by their vinyl acetate content and their melt flow index which is dependent on the molecular weight.
The objective of such paper is to evaluate suitable hot-melt adhesive for polyamide-titanium mixed-substrate joining including characterization, wetting and adhesion behavior of these polymers.
2. Experimental Details
2.1. Materials
The EVA-polymers Evatane™ 33-400, Evatane™ 28-05, Evatane™ 28-40, Evatane™ 28-150, and Evatane™ 28-800 were produced by Arkema. The polycarpolactone Capa™ 6250, Capa™ 6800, and Capa™ 6500 were produced by Perstorp. Four different thermoplasticpolyurethans (TPU) UNEX™ 4078 (Dakota), Elastollan™ E1195A (BASF), Pearlbond™ DIPP 539 (Merquinsa), and Pearlbond™ 123 (Merquinsa) were used. Two VLDPEs Exact™ 8201 and 8230 which were ethylene-octene-copolymers produced by Exxon Mobiland Engage™ 8440, which was produced by Dow, were used. The ethylene-propylene-copolymer Versify™ 4200 was producedby Dow. Europrene™ Sol T9133 is a co-styrene-isoprene polymer produced by Polimieri. Arkemaproduced Lotryl™ 35BA320 and Lotryl™ 35BA40 (co-ethylene-butylacrylate polymer). The polyester Griltex™ D1582E was produced by EMS Chemie. Vestamelt™ 451 was a copolyamide produced by Degussa. All polymers were delivered as granulates and used as received. Melting points were used from the corresponding data sheets provided by the producers or suppliers. Polyamid 6, 6 (PA) and standard grade sandblasted titanium (Ti) were supplied by Sonova AG.
2.2. Differential Scanning Calorimetry (DSC)
DSC analyses were carried out using a DSC 204 F1 Phoenix instrument (NETZSCH, Germany) under nitrogen atmosphere (gas flow 40 mL/min). Aluminum pans with pierced caps, each containing 10 - 11 mg samples, were heated from 20˚C to 150˚C, then cooled down to −50˚C followed by a second heating run to 150˚C. A second cooling run to −50˚C and a third heating run to 150˚C were followed. The heating and cooling rates were 10 K/min. The first heating run was carried out to obtain good sample contact with the pan leading to a good heat flow and to eliminate the thermal history. The second and third heating ramps were performed for thermal analysis and to verify polymer stability. Each polymer was measured three times.
2.3. Rheometry
Rheological investigations were conducted on an Anton Paar rheometer MCR-301 (Austria) with a CTD450 convection oven. Cooling was performed using a ULSP AR130 air chiller (The Netherlands). The polymers beads were pressed into sheets of 60 mm × 65 mm × 2 mm with a vacuum press P200PV from Collin (Germany) at 135˚C and 5 bar for 2 min under 100 mbar vacuum to achieve void-free samples. For the rheology test, the sheets were punched as circular samples of 26 mm in diameter.
All polymers were measured with plate-plate geometry (PP25) according to ISO 6721-10 and DIN 53019. A deformation sweep from 0.01% to 10% with a frequency of 1 1/s was performed for each polymer to ensure linear viscoelastic behavior at 120˚C. The frequency sweep was performed with 25 intervals from 100 to 0.01 1/s at 120˚C with 1% deformation. The temperature sweeps were performed at a frequency of 10 1/s and a deformation of 0.1% with a measurement time of 20 s for each measurement point. The samples were cooled down from 120˚C to 30˚C, hold at 30˚C for 15 min and heating up to 120˚C. Heating and cooling rates were 3 K/min.
2.4. Contact Angle Measurements
The standard method with a defined polymer drop through syringe and needle was not successful due to clogging of the needle with the hot-melt adhesive. Therefore, a modified method was applied for this project. A defined amount of a polymer bead was placed on the specimen. The samples were melted in a universal convection oven at 100˚C for 30 min and cooled down to room temperature. Contact angle measurements were performed with a DSA 100 instrument from Krüss (Germany).
2.5. Finger Nail Tests
For very first adhesion tests on different substrates, the finger nail test was applied [19] . A defined amount of a polymer bead was placed on the specimen. The samples were melted in a universal convection oven at 100˚C for 30 min and cooled down to room temperature. With manual pressure with the finger nail at the interface between the adhesive and the substrate until breaking of the joint, the adhesion strength can be compared with each other.
2.6. Adhesion
The adhesion tests were carried out on an Adhesion Analyzer LUMiFrac from LUM GmbH (Germany). The measurement principle is based on centrifugal force which is applied at up to 8 samples simultaneously. The load increase is performed by the variation of rotor turns. The failure of the adhesive is automatically detected and the force at rupture and the corresponding tensile strength are calculated. The load range is between 0.1 up to 6.5 kN. The test stamp (copper) weight was 17 g and the area was 78.54 mm2. The polymers beads were pressed into discs of 8 mm in diameter with a thickness of 0.25 mm at 100˚C and 5 bar for 1 min. The samples were bonded by placing the discs in a universal convection oven UFE500 from Memmert (Germany) between substrate and test specimen. The specific temperature was validated with rheological measurements. Bonding time was 15 min with a subsequent cooling at room temperature for 30 min.
3. Results and Discussion
3.1. Thermal Analysis by DSC
The thermal behavior is one of the most important characteristics for hot-melt adhesives [20] . We have analyzed the samples using a standardized heating-cooling repeating cycle as described in the experimental part. Table 1 shows the results from the DSC-measurements with melting enthalpy, onset temperature, peak temperature and offset temperature in comparison with data sheets values. Standard deviations have been determined for each experimental value. They are within the expected range (1 - 4 J/g for melting enthalpy, 1˚C - 5˚C for peak temperature, 1˚C - 6˚C for onset temperature, 1˚C - 4˚C for offset temperature). They have been omitted in the table due to easier readability of the table and easier.

Table 1. DSC measurements with melting enthalpy, onset, peak and offset temperatures in comparison with data sheet values. n.a. = not applicable.
The peak temperature usually showed only slight deviations to the literature values. The largest deviation was examined with the Exact 8201. The difference could be explained with the high viscosity in the melting range. Another relatively high deviation to literature values was shown with Pearlbond 123 (12˚C). Here, the melting point given in the data sheet was determined by Koflerbank which is a completely different measurement technique. In addition, Pearlbond 123 exhibited also a high viscosity in the melting range. The offset temperature could be very accurately evaluated with most of the adhesives. EVA 33-400 showed lowest values for onset (50˚C), peak (57˚C), and offset (74˚C) temperature within the EVA polymers, while Evatane 28-05 showed the highest values for onset (63˚C), peak (72˚C), and offset (83˚C) temperature, as expected.
Out of curiosity, a paraffin wax was also analyzed showing a similar behavior like a hot-melt adhesive. The melting point at 60˚C fit well with the requirement of a hot-melt adhesive. The melting enthalpy of 184 J/g was over double the melting enthalpy of typical polymer based hot-melt adhesives. For the application, polymers with a high melting enthalpy need more energy for the melting process than polymers with low melting enthalpy and are therefore not ideal as hot-melt adhesives. This is valid especially for bonding temperature-sensitive parts.
It is often not easy to define the melting enthalpy due to unclear baselines. A typical example is EVA, which has a very broad peak over the entire temperature sweep. Evaluation of three melting enthalpy analysis methods was performed: horizontal baseline, linear base line, and linear base line with starting at 20˚C (see Figure 1). We found that the mean values for the three methods differed significant but for comparison of different EVA- types it plays an insignificant role as long as the same method is used. Statistical evaluation showed the highest

Figure 1. Evatane 28-05 melting enthalpy evaluated with different methods: horizontal base line, linear base line, and linear base line starting at 20˚C.
standard deviations (4.8 J/g) and highest standard error (2.1 J/g) for horizontal baselines analysis. The linear baseline analysis showed the lowest standard deviation (0.4 J/g) and the lowest standard error (0.2 J/g).
The mean melting enthalpies laid between 12 and 31 J/g with the lowest value for Evatane 33-400 (highest acetate content) and the highest values for Evatane 28-05 (lowest melt flow index (MFI)) which is consistent with the degree of crystallization and the corresponding vinyl acetate content [21] .
3.2. Rheological Evaluation
Rheological investigations are rarely done in industry and development for hot-melt adhesives due to the relative complexity of the measurement methods and analysis [22] - [26] . Sample preparation and test methods are important for consistent and meaningful results. While temperature sweeps are more like a standardized method, we have also performed frequency sweeps revealing structural differences. Frequency sweeps measure the time dependence of the viscoelastic properties [27] . Hot-melt adhesives are usually based on linear polymer chains. The complex viscosity exhibits a plateau at low frequencies which is defined as the zero shear viscosity. Figure 2 shows the double logarithmic plot of the complex viscosity versus shear rate for all polymers at 120˚C and 1% deformation.
The shear rate dependency of the complex viscosity can be clearly seen. All polymers were showing a shear thinning effect. Some of them had a Newtonian plateau and a yield stress at shear rates between 0.1 and 100 1/s. In some cases, the Newtonian plateau could not be observed. The zero shear viscosities ranged between 80 and 200,000 Pas with the lowest value for Evatane 28-800 (EVA polymer) and the highest value for Europrene Sol 9133 (styrene-isprene. copolymer).
Figure 3(a) shows the double logarithmic plot complex viscosity versus shear rate of five EVA polymers with different viscosities. A clear zero shear viscosity was observed for Evatane 28-800, 33-400, and 28-150, while EVA 28-40 and 28-05 did not show a constant complex viscosity at 120˚C at any frequency down to 0.1 1/s. This can be explained with the longer polymer chains for Evatane 28-05 and 28-40 compared to the other EVA grades. As the amount of entanglement increases, the Newtonian plateau region decreases and the shear thinning effect become more pronounced. Evatane 28-800 showed a distinguished plateau of the zero shear viscosity at 120˚C at frequencies below 10 1/s. The low zero shear viscosity of about 81 Pas indicates a relatively fast flow under its own weight. The complex viscosity at the low frequency (0.1 1/s) for Evatane 28-05 is

Figure 2. Frequency sweep of complex viscosity at 120˚C and 1% deformation for different polymers.
23,000 Pas, which means that this adhesive hardly flows at 120˚C under its own weight. Hence the much lower MFI is confirmed by Evatane 28-05 against Evatane 28-800. Even at high shear rates, the viscosity (423 Pas at 628 1/s) was significantly higher than the one for Evatane 28-800 (59 Pas). A very similar behavior could be observed for polycaprolactones as shown in Figure 3(b). Almost Newtonian behavior was observed for a polycaprolactone with molecular weight of 25,000 g/mol (Capa 6250). If the molecular weight increases to 50,000 g/mol (Capa 6500) or even to 80,000 g/mol (Capa 6800), the plateau region decreased significantly which is consistent with theory of increasing entanglements of higher molecular weight polymers and therefore reduces the Newtonian plateau region.
The storage and loss moduli shear rate dependence have been analyzed for all polymers. The shear rate dependence of the storage and loss moduli for different EVA- and polycaprolactone-type polymers are shown in Figure 4. A clear influence of the molecular weight on the storage modulus was detected. A typical Maxwell behavior could be seen for Evatane 28-800, since the slope for the loss modulus vs. frequency is 1:1 (double logarithmic scale) and the slope for the storage modulus vs. frequency is 2:1 (double logarithmic scale), meaning Evatane 28-800 is a chemically or physically non-cross-linked polymer. Intersection of storage and loss modulus for Evatane 28-800 wasat 700 1/s, while the intersection of storage and loss modulus for Evatane 28-05 was at 13 1/s. This reveals a higher molecular weight of Evatane 28-05 compared to Evatane 28-800 which is in-line with the higher viscosity and lower melt flow index of Evatane 28-05. Low modulus and low frequency measurements are below measurable range resulting in inhomogeneous curves.
A typical temperature sweep dependence of the storage and loss modulus for Evatane 28-800 is exemplary depicted in Figure 5. Cooling from 120˚C to 25˚C shows the solidification at the cross-over of storage and loss modulus. After the temperature was hold for 30 min, heating up at constant heating ramp to 120˚C was revealing the melting process with a cross-over of the storage and loss modulus. The difference of the solidification and melting can be seen from the temperature-dependence of the cross-over points between the storage and loss modulus. Melting point is at higher temperature than the solidification point.
Another very useful representation of the melting and solidification behavior is shown in Figure 6. It is the plotting of storage and loss modulus versus temperature. The absolute value of the complex viscosity is also shown in Figure 6. The linearity of the complex viscosity indicated a typical exponential behavior as described by the Arrhenius model. Three distinguished segments can be analyzed from thisfigure: (a) solidified material
 (a)
(a) (b)
(b)
Figure 3. Frequency sweep of complex viscosity at 120˚C. (a) Different EVA polymers. (b) Different polycaprolactones.
(storage modulus higher than the loss modulus); (b) melting process (non-linear behavior of storage and loss modulus); (c) viscous material (loss modulus higher than storage modulus).
For the application as hot-melt adhesive, Figure 6 shows on the one hand the minimal temperature needed for a completely melted polymer (application temperature, segment (c)) and on the other hand the maximal temperature allowed for the usage as an adhesive (dimensional stability, segment (a)). The melting temperature itself is not a good indication for the application temperature of a hot-melt adhesive. Generally, the application temperature needs to be at least 15˚C to 30˚C higher than the melting temperature, depending on the polymer. The
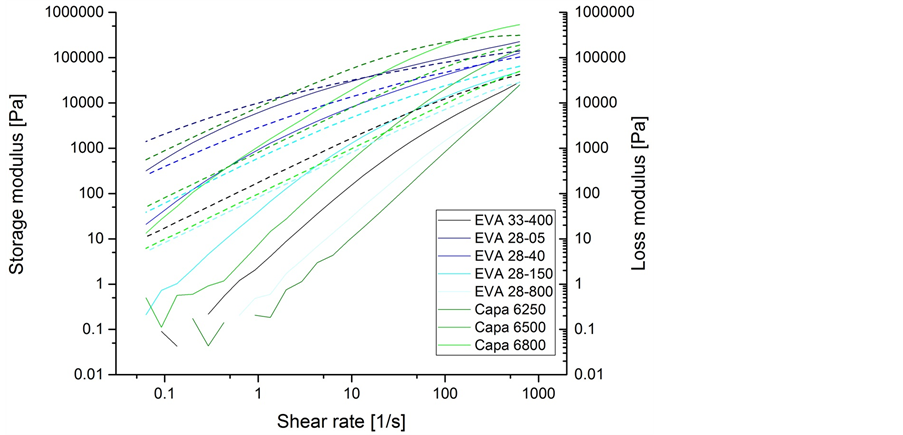
Figure 4. Frequency sweep of storage (solid line) and loss (dashed line) moduli for EVA- and polycaprolactone-type polymers.

Figure 5. Temperature dependence behavior of storage and loss modulus for Evatane 28-800.
temperature needed can be derived from data according to Figure 5 and Figure 6. A comparison between rheological data and DSC measurements of the end of the melting process is shown in Table 2. There is a good agreement of both measurements techniques. The deviations were below 10%. The highest deviation was measured with UNEX 4078, a thermoplastic polyurethane, which showed a very broad melting peak in the DSC.
We have further analyzed the viscosities at 100˚C, at the end of the melting process and 15˚C and 30˚C above melting point, since for the hot-melt adhesive application these might be the most relevant values (see Table 3). All tested polymers had melting temperatures lower than 100˚C. Therefore, all complex viscosities at 100˚C were lower than the complex viscosities at the end of the melting process. For the application as hot-melt adhesives, the flow behavior at 15˚C above the melting temperature (corresponds to the +15˚C value) is significant.

Figure 6. Temperature dependence of the storage and loss modulus and complex viscosity of Evatane 28-800.
Table 2. Comparison of rheological and DSC data for the melting process.
For polymers with high melt viscosity, the complex viscosity at 30˚C above melting temperature (corresponds to the +30˚C value) is relevant. The complex viscosity decreases between 22% - 46% (mean: 32%) for the +15˚C value, while a decrease of the complex viscosity between 38% - 69% (mean 53%) for the +30˚C value is observed. As a general observation, the smaller the complex viscosity, the higher the relative decrease is. That
Table 3. Complex viscosity at 100˚C, at the end of the melting process and 15˚C and 30˚C higher than the melting point.
means that adhesives with low viscosities must not be heated much higher than melting temperature.
3.3. Finger Nail Test
For a very first evaluation of the wetting and adhesion performance, we have evaluated the finger nail test as described on the experimental part. The results are summarized in Table 4 and some examples are shown in Figure 7.
In general, most of the lower viscous polymers were showing a good wetting behavior at 100˚C on polyamide while the higher viscous polymers are considerably worse. Paraffin wax showed the largest spreading measured at 60˚C. The lower viscous polycaprolactones (Capa 6250 and 6500) were showing a good wetting behavior. But they did not adhere on the polyamide. All lower viscous EVAs showed a good adhesion behavior. The co-polyester (GriltexD1582E), and the TPU (Pearlbond 123) showed a good adhesion behavior on titanium while the co-ethyl-butyl-acrylate-copolymer (Lotryl 35BA320) exhibited a significant good adhesion to PA but surprisingly not on titanium.
The finger nail test is a very subjective and relative method but gives fast and surprisingly consistent results and can be used for fast screening of polymers on different substrates. The finger nail test has been performed by different people in the lab showing identical results.
3.4. Contact Angle Measurement
The wetting behavior can be quantified by contact angle measurements (see Table 5). Since the measurement chamber of the contact angel instrument could not be heated, the samples were prepared in a convection oven. A defined amount of a polymer bead was placed on the substrate and heated up to 100˚C for 30 min resulting in a molten drop of polymer. This molten drop is solidified upon cooling and the contact angle was measured. The sample preparation was reproducible. It was found, that the contact angle results are in principle comparable with the wetting test. In order to get the hot-melt significant contact angle, a defined amount of adhesive was melted on the polyamide or titanium substrate, respectively.
Evatane 28-800 had a low contact angle (33˚ on PA and 29˚ on Ti) and showed very good wetting behavior (see above). Interestingly, Evatane 33-400 had a higher contact angle on PA (40˚) than on Ti (36˚), while the opposite has been observed for Evatane 28-150 (54˚ on PA and 65˚ on Ti). An explanation is the acetate content on the polymer backbone which is higher for Evatane 33-400 than for Evatane 28-15 leading to stronger interaction with the polyamide groups. Lotryl 35BA320 showed slightly higher contact angle on Ti (47˚) than on PA (42˚). Almost the same contact angle on both substrates has been measured for Griltex D1582E.
Table 4. Wetting and adhesion behavior. Nok = not ok. n.a. = not applicable due to not sufficient wetting behavior.
Table 5. Contact angle measurements of selected examples on polyamide and titanium samples.

Figure 7. Wetting probes on polyamide and titanium. From left to right: Pearlbond DIPP 539, Griltex D1582E, Lotryl 35BA320, Capa 6250.
3.5. LumiFrac Adhesion Test
For LumiFrac adhesion tests, we have selected 5 polymers of different polymer basis. In general, the adhesion forces were relatively low which is typical for hot-melt adhesives. The highest adhesion force was measured for Evatane 28-800 with 0.46 MPa as shown in Figure 8(a). It was applied at 78˚C. The standard deviations were relatively large which is typical for pull tests. Pearlbond 123 (0.38 MPa; applied at 77˚C), Griltex D1582E (0.36 MPa; applied at 107˚C) and Lotryl 35BA320 (0.32 MPa; applied 89˚C) were insignificant different within the

 (a) (b)
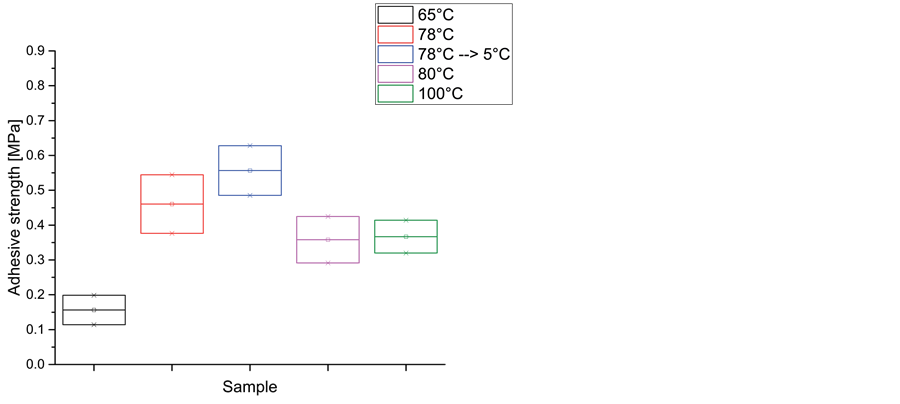
 (c) (d)
Figure 8. LumiFrac adhesion tests. (a) Adhesion strength [MPa]. (b) Adhesive thickness dependence. (c) Temperature dependence. (d) Example of failure mode of an Evatane 28-800 sample.
standard deviation. The polyolefin Exact 8230 showed significant lower adhesion strength (0.16 MPa) and was applied at 96˚C. In order to evaluate the correlation of the adhesion strength on the film thickness, we have performed a series of measurements with Evatane 28-800. A linear relationship between the amount of adhesive and adhesive strength have been found (see Figure 8(b)). A thickness of 0.1mm lead to a mean value of 0.31 MPa adhesion strength while a thickness of 0.25 mm lead to 0.46 MPa adhesion strength.
Failure mode analysis is summarized in Table 6. Evatane 28-800 showed a clear better adhesion to polyamide than to sandblasted titanium. The same results have been observed for Lotryl 35BA320 and for Griltex D1582E. Out of the tested adhesives, only Pearlbond 123, thermoplastic polyurethane, adhered better to titanium than to polyamide which was expected. A typical failure pictures is shown in Figure 8(d). The titanium substrate is covered by the aluminium socket where the copper weight is placed and the polyamide substrate is shown on the right side as a plate. Often, mixed failure modes are observed.
Sample preparation is critical for adhesion tests. Homogenous sample thickness is important to avoid peeling behavior which leads to lower values. As discussed in the rheological part, the adhesion is strongest if the bonding temperature is within part C of the oscillation temperature sweep curve [28] [29] . If the temperature is lower, the wetting is not sufficient and insufficient adhesion forces are expected. This explains the different application
Table 6. Adhesion to polyamide and titanium in mixed substrate joining.
temperatures which have been used for the different polymers. This has been verified using Evatane 28-800, which has been applied at different temperatures (Figure 8(c)). A maximum of adhesion strength was observed for application at 78˚C. Interestingly, we have found that after very fast cooling of the samples in a refrigerator, the adhesion to titanium is better than to polyamide leading to even higher adhesion strength (0.55 MPa). It is suppose that this is due to different crystallization processes and the interaction with the rough surface of titanium. This finding will be analyzed in detail in a further work.
4. Conclusion
This study shows methods for choosing and evaluating hot-melt adhesives for simple mixed substrate bonding. Thermal, wetting, and adhesion behaviors of a wide range of hot-melt adhesives were characterized using standardized as well as new methods. Detailed investigation of the rheological behavior has been performed. It will give engineers and adhesive users a toolbox of easy applicable and ready available techniques for the evaluation of different adhesives. Methods were compared and the different chemical structures of the adhesives were explained. These results can be used in a further work to study the dependence of adhesion on crystallization phenomena. Clearly, each specific industrial hot-melt application might need refined or modified experimental tools to characterize the hot-melt adhesive.
Cite this paper
S. Schaible,C. Bernet,P. Ledergeber,T. Balmer,C. Brändli, (2016) Basic Study on the Evaluation of Thermoplastic Polymers as Hot-Melt Adhesives for Mixed-Substrate Joining. Open Journal of Applied Sciences,06,579-592. doi: 10.4236/ojapps.2016.68057
References
- 1. Habenicht, G. (2009) Kleben: Grundlagen, Technologien, Anwendungen. Vol. 6, Springer-Verlag, Berlin Heidelberg.
- 2. Adams, R.D. (2005) Adhesive Bonding: Science, Technology and Applications. Elsevier, Cambridge, England. http://dx.doi.org/10.1533/9781845690755
- 3. Brockmann, W., Geiß, P.L., Klingen, J. and Schröder, B. (2009) Adhesive Bonding—Materials, Applications and Technology. Wiley-VCH, Weinheim, Germany.
- 4. Kinloch, A. (2012) Adhesion and Adhesives: Science and Technology. Springer Science & Business Media, Cambridge, England.
- 5. Pizzi, A. and Mittal, K.L. (2003) Handbook of Adhesive Technology, Revised and Expanded. CRC Press. http://dx.doi.org/10.1201/9780203912225
- 6. Pocius, A.V. (2012) Adhesion and Adhesives Technology: An Introduction. Carl Hanser Verlag GmbH & Co. KG, New York, USA. http://dx.doi.org/10.3139/9783446431775
- 7. Possart, W. (2006) Adhesion: Current Research and Applications. John Wiley & Sons, Hannover, Germany.
- 8. Müller, B. and Rath, W. (2004) Formulierung von Kleb-und Dichtstoffen: Das kompetenteLehrbuch für Studium und Praxis. Vincentz Network GmbH & Co. KG, Hannover, Germany.
- 9. Li, W., Bouzidi, L. and Narine, S.S. (2008) Current Research and Development Status and Prospect of Hot-Melt Adhesives: A Review. Industrial & Engineering Chemistry Research, 47, 7524-7532. http://dx.doi.org/10.1021/ie800189b
- 10. Tse, M.F. (1995) Application of Adhesion Model for Developing Hot Melt Adhesives Bonded to Polyolefin Surfaces. The Journal of Adhesion, 48, 149-167. http://dx.doi.org/10.1080/00218469508028160
- 11. Kraus, E., Baudrit, B., Heidemeyer, P. and Bastian, M. (2014) Fast Detection of Mechanical Strength. Adhesion— Adhesives & Sealants, 11, 31-34. http://dx.doi.org/10.1365/s35784-014-0324-4
- 12. Hielscher, S., Beck, U., Lange, T. and Weise, M. (2014) Comparative Study on the Adhesive Strength of Optical & Ophtalmic Coatings by Means of Centrifuge Technology. International Workshop Dispersion Analysis & Materials Testing, Berlin.
- 13. Park, Y.-J., Joo, H.-S., Kim, H.-J. and Lee, J.-K. (2006) Adhesion and Rheological Properties of EVA-Based Hot-Melt Adhesives. International Journal of Adhesion and Adhesives, 26, 571-576. http://dx.doi.org/10.1016/j.ijadhadh.2005.09.004
- 14. Arsac, A., Carrot, C. and Guillet, J. (1999) Rheological Characterization of Ethylene Vinyl Acetate Copolymers. Journal of Applied Polymer Science, 74, 2625-2630. http://dx.doi.org/10.1002/(SICI)1097-4628(19991209)74:11<2625::AID-APP9>3.0.CO;2-G
- 15. Shih, H.H. and Hamed, G.R. (1997) Adhesion and Viscoelasticity of Poly(ethylene-co-vinyl acetate)-Based Hot Melt Adhesives. I. The Effect of Tackifier Compatibility. Journal of Applied Polymer Science, 63, 323-331. http://dx.doi.org/10.1002/(SICI)1097-4628(19970118)63:3<323::AID-APP7>3.0.CO;2-P
- 16. Stark, W. and Jaunich, M. (2011) Investigation of Ethylene/Vinyl Acetate Copolymer (EVA) by Thermal Analysis DSC and DMA. Polymer Testing, 30, 236-242. http://dx.doi.org/10.1016/j.polymertesting.2010.12.003
- 17. Turreda, L.D., Sekiguchi, Y., Takemoto, M., Kajiyama, M., Hatano, Y. and Mizumachi, H. (1998) Rheological Study on the Adhesion Properties of the Blends of Ethylene Vinyl Acetate/Terpene Phenol Adhesives. Journal of Applied Polymer Science, 70, 409-418. http://dx.doi.org/10.1002/(SICI)1097-4628(19981010)70:2<409::AID-APP22>3.0.CO;2-X
- 18. Park, Y.-J. and Kim, H.-J. (2003) Hot-Melt Adhesive Properties of EVA/Aromatic Hydrocarbon Resin Blend. International Journal of Adhesion and Adhesives, 23, 383-392. http://dx.doi.org/10.1016/S0143-7496(03)00069-1
- 19. Bernet, C., Ledergerber, P. and Brändli, C. (2015) Unpublished Results.
- 20. Dumas, J.P., Tordjeman, P., Zeraouli, Y. and Di Paolo, F. (1998) Heat Transfer Model for the Cooling of Hot Melt Adhesives. Journal of Adhesion Science and Technology, 12, 399-413. http://dx.doi.org/10.1163/156856198X00119
- 21. Johnsen, V.U. and Nachtrab, G. (1969) Die Kristallinität von Äthylen-Vinylacetat-Copolymeren. Macromolecular Materials and Engineering, 7, 134-146. http://dx.doi.org/10.1002/apmc.1969.050070112
- 22. Gilbert, F.X., Marin, G., Derail, C., Allal, A. and Lechat, J. (2003) Rheological Properties of Hot Melt Pressure Sensitive Adhesives Based on Styrene—Isoprene Copolymers. Part 1: A Rheological Model for [sis-si] Formulations. The Journal of Adhesion, 79, 825-852. http://dx.doi.org/10.1080/00218460309552
- 23. Kalish, J.P., et al. (2015) An Analysis of the Role of Wax in Hot Melt Adhesives. International Journal of Adhesion and Adhesives, 60, 63-68. http://dx.doi.org/10.1016/j.ijadhadh.2015.03.008
- 24. Derail, C., Cazenave, M.N., Gilbert, F.X., Marin, G., Kappes, N. and Lechat, J. (2004) Rheological Properties of Hot- Melt Pressure-Sensitive Adhesives (HMPSAS) Based on Styrene-Isoprene Copolymers. Part 2: Innovative Molecular Design from Predictive Formulation. Journal of Adhesion, 80, 1131-1151. http://dx.doi.org/10.1080/00218460490884259
- 25. Cazenave, M.N., Derail, C., Leonardi, F., Marin, G. and Kappes, N. (2005) Rheological Properties of Hot Melt Pressure Sensitive Adhesives (HMPSAs) Based on Styrene-Isoprene Copolymers. Part 3: Rheological Behavior of Different Block Copolymers with High Diblock Content. Journal of Adhesion, 81, 623-643. http://dx.doi.org/10.1080/00218460590954610
- 26. Kadam, P., Vaidya, P. and Mhaske, S. (2014) Correlation between Rheological and Adhesion Properties of Polyamide Hot Melt Adhesive Synthesized from Dimer Acid (Dilinoleic Acid) and Ethylene Diamine. Indian Journal of Advances in Chemical Science, 2, 124-133.
- 27. Mezger, T.G. (2006) The Rheology Handbook: For Users of Rotational and Oscillatory Rheometers. Vincentz Network GmbH & Co. KG, Hannover, Germany.
- 28. Shih, H.H. and Hamed, G.R. (1997) Poly(Ethylene-co-Vinylacetate) Based Hot Melt Adhesives: I. Relating Adhesive Rheology to Peel Adhesion. Journal of Adhesion, 61, 231-245. http://dx.doi.org/10.1080/00218469708010524
- 29. Komornicki, J., Marin, G. and Leclere, I. (1991) Rheological Behavior and Adhesion Properties of EVA-Based Hot- Melt Adhesives—Use of Computational Tools. Tappi Journal, 74, 233-237.
NOTES

*Corresponding author.