Journal of Sustainable Bioenergy Systems
Vol.3 No.1(2013), Article ID:29100,6 pages DOI:10.4236/jsbs.2013.31009
Row Spacing Affects Biomass Yield and Composition of Kenaf (Hibiscus cannabinus L.) as a Lignocellulosic Feedstock for Bioenergy
1Department of Plant Sciences, North Dakota State University, Fargo, USA
2Department of Chemical Engineering, University of North Dakota, Grand Forks, USA
Email: *marisol.berti@ndsu.edu
Received January 27, 2013; revised March 1, 2013; accepted March 12, 2013
Keywords: Bioenergy; Lignocellulosic; Feedstock; Plant Density; Glucans; Xylans; Ash
ABSTRACT
Kenaf (Hibiscus cannabinus L.) is a warm-season annual. Kenaf fibers are commonly used for paper pulp and cordage, but it is also a promising lignocellulosic feedstock for bioenergy production, although optimum plant density for biomass production has not been determined for the northern region of the USA. The objective of this study was to determine the best plant density and row spacing of kenaf to maximize biomass yield and chemical composition for biofuel conversion. The experiments were conducted at Fargo and Prosper, ND, in 2010 and 2011. The experiment was a randomized complete block design with a split-plot arrangement where the main plot was tworowspacings (30 and 60 cm) and the sub-plot fourplant densities (32, 16, 8, and 4 plants∙m−2). Row spacing had a significant effect on both biomass and biofuel yield. Narrower rows had higher biomass and biofuel yield. Maximum biomass and estimated biofuel yield was obtained with the two highest plant densities of 16 and 32 plants∙m−2 and fluctuated between 9.45 and 10.22 Mg∙ha−1 and 1354 and 1464 L∙ha−1, respectively. Stem diameter increased with a decrease in plant density. Chemical composition varied with plant density; glucan (27%) and xylan (9.8%) content were lower at the lowest plant density. Ash content was not different among plant densities but it is interesting to mention the very low ash content of kenaf (0.15%). According to the results of this study, it is recommended to plant kenaf at 30-cm rows with a plant density of 16 to 32 plants∙m−2 to maximize biomass yield. Kenaf has a tremendous potential as a cellulosic feedstock for biofuel and green chemicals in the Northern Great Plains because of high biomass yield and low ash content.
1. Introduction
Kenaf is a warm-season annual plant in the Malvaceae family closely related to cotton (Gossypium hirsutum L.). It is native to tropical Africa and it was introduced into the United States in the 1940s as a substitute for jute (Crochorus solitorius L.). Kenaf fibers are used for paper pulp and cordage. It produces both bast and core fiber. The longer bast fibers are located in the outer part of the stem, can be used in high quality paper, as a substitute for fiber glass, bioplastics, and are a good source of nanofibers for many applications. Core fibers are shorter and can be used as fillers for pet litters, industrials socks, pillows, and many other industrial applications due to their high absorbent properties. Core fibers have also been proposed as a bioadsorbent for the removal of glycerin contained in the wastewater from biodiesel treatment facilities [1], as an adsorbent for dehydration of ethanol [2], and as an enhancer of bioremediation, since its fibers can absorb oil in contaminated soils [3,4]. Kenaf plants are very efficient to absorb CO2 from the air which will impact the carbon footprint if extensive areas of the United States grow kenaf.
Kenaf evaluated in Ladonia, TX, in 1989 and 1990, produced aboveground biomass yield up to 14 Mg∙ha−1 [5]. Kenaf was produced in North Dakota as a fiber crop between 2002 and 2004. Aboveground biomass yield ranged between 7.5 and 13.4 Mg∙ha−1, in experiments conducted at Minot, Carrington, Langdon, and Prosper, ND, in 2002, 2003, and 2004, respectively [6]. The economics of kenaf production in the Rio Grande Valley in Texas, indicated that kenaf net returns fluctuated between $138 and $270 ha−1, based on an average yield of 12 to 15 Mg∙ha−1, a price of $44 Mg−1, variable cost $252 ha−1, and a land cost of $136 ha−1 [7].
Management guidelines for kenaf production for biomass have not been conducted previously in North Dakota. Massey [8] in the state of Georgia, USA, determined that the highest biomass yield occurred with 26.2 plants∙m−2. He also noted higher plant densities inhibited lateral branch growth and increased fiber quality. Another study conducted by Robinson [9] in California, indicated that highest stem yields were obtained with 34.5 plants∙m−2. In Greece, Danalatos and Archontoulis [10] indicated that maximum productivity of kenaf was obtained with a population of 20 plants∙m−2. Baldwin and Graham [11] indicated that the highest biomass yield was obtained with the narrowest row spacing of 35.5 cm. There is no reported information on the effect of plant density and stem diameter on the chemical composition of kenaf.
The objective of this study was to determine the effect of plant density and row spacing on biomass yield. Carbohydrate composition of kenaf feedstock was also analyzed in order to determine whether kenaf can be used as a potential feedstock for biofuels production in the Northern Great Plains in the USA.
2. Materials and Methods
2.1. Experimental Site
Research was conducted in 2010 and 2011 at the North Dakota State University (NDSU) research site at Fargo, ND, (−96˚812'W, 46˚897'N, 274 m elevation) and at the NDSU research site in Prosper, ND, (−97˚115'W, 47˚002'N, 284 m elevation). Soil type in Fargo is Fargo-Ryan silty clay soil (fine, montmorillonitic, frigid, Vertic Haplaquoll, with a leached and degraded nitric horizon) while the soil type in Prosper is a Bearden silty clay loam (fine-clay, frigid AericCalciaquolls). The Fargo series is fine, smectitic, frigid TypicEpiaquerts, while the Ryan series is fine, smectitic, frigid TypicNatraquerts.
Plant density treatments included two row spacings (30 and 60 cm) and four plant density sub treatments (32, 16, 8, and 4 plants∙m−2 or 320,000, 160,000, 80,000, and 40,000 plants∙ha−1). Kenaf (cv. Dowling provided by Thomas Rymsza) was seeded on 19 May at both locations in 2010 and in 4 and 8 June at Prosper and Fargo, in 2011, respectively. The experimental design was a randomized complete block, with four replicates, in a splitplot arrangement where the row spacing was the main plot and plant density was the subplot. Experimental units were 5-m in length and had 6 rows, 30-cm apart, or 3-rows 60 cm apart. The planter was a plot seeder with six belt cones each delivering seed to a set of double disk openers with Twin-Vee arranged press wheels. Seeding rate was 12 kg∙ha−1 and plots were thinned to the plant densities indicated, 4 weeks after planting. Plots were fertilized with 80 kg∙N∙ha−1 in July at both location and years. Plots were hand-harvested on 7 and 12 October, at Prosper and Fargo, in 2010, and on 16 September, at both locations in 2011.
2.2. Evaluations
Plant height, population density, basal stem diameter, and biomass yield at harvest were evaluated. Three plants per plot were measured for height. Stem base diameter was measured on three plants from the center row with a caliper, 2-cm above-soil surface. Biomass yield was taken from the 2-center rows on the plots planted at 30- cm in-between row spacing and from the center row on those planted at 60-cm in-between row spacing.
Conversion to biofuel yield was evaluated. Theoretical ethanol yield was calculated using the conversion factor of 113 mg ethanol∙g−1 of dry biomass [12].
2.3. Chemical Composition of Kenaf Biomass
Samples of kenaf from eight different plant density treatments from Fargo and Prosper in 2010 were sent to the Chemical Engineering Department at the University of North Dakota, Grand Forks, ND, for analysis.
The solid biomass was pulverized to less than a 20- mesh size and a 300 mg sample was loaded into pressure tubes. Three mL (72% acid concentration) of sulfuric acid was added to each pressure tube. These tubes were placed in a water bath at 30˚C for 1 hour. The samples in the pressure tubes were stirred thoroughly using glass stir rods every 10 minutes to ensure good mixing of the biomass and acid. The acid concentration was then diluted to 4% by adding 84 ml of deionized water. The pressure tubes were then placed in an autoclave oven at 121˚C for 60 minutes. The resultant slurry was vacuum filtered using porous ceramic crucibles. The hydrolyzate samples were analyzed using Agilent 1200 series HPLC to determine the amount of cellulose and hemicellulose present in the biomass. Solid fractions retained in crucibles were oven dried at 105˚C for 12 hours to determine acid insoluble lignin content (AIL). Then these crucibles were placed in muffle furnace for 24 hours at 575˚C to determine ash content. This process was performed in accordance with National Renewable Energy Laboratory Procedure (NREL/TP-510-42619).
2.4. Statistical Analysis
Statistical analysis was conducted by using standard procedures for a randomized complete-block design with a split-plot arrangement. Each location-year combination was defined as an “environment” and was considered a random effect in the statistical analysis. Row spacing and plant density were considered fixed effects. Environments were analyzed individually by ANOVA. Trait mean square errors were tested for homogeneity before analysis was performed across environments. To separate treatment means, F-protected LSD comparisons with P ≤ 0.05 were applied. The estimated variance of pairwise mean differences and the corresponding degrees of freedom were calculated to estimate the correct LSD values for comparison of significant interactions [13]. The SAS System was used to analyze the data [14].
Regression analysis was considered for trait responses when there was a significant main effect or interaction for any of the fixed effects. Linear and polynomial regression models were tested. The regression models are presented and all parameter estimates were significant at P ≤ 0.05.
3. Results and Discussion
3.1. Stem Diameter, Biomass and Ethanol Yield
The analysis of variance indicated a significant effect between the environment and plant density for population density at harvest, stem diameter, and biomass and ethanol yield. Since environments were random, data at each environment is not shown, but the strong interaction between plant density and environment was due to the fact that the 2011 growing season was much shorter (killing frost 15 Sept.) and plants had less time to grow before freezing.
The analysis of variance indicated significant differences between row spacings for biomass and theoretical ethanol yield while population density at harvest and stem diameter varied significantly among different plant densities (Table 1). Also, a significant interaction between both fixed effects (row spacing and plant density) was observed for plant height, biomass and theoretical ethanol yield.
Population density at harvest was 5.1, 8.1, 14.1 and 19.8 plants∙m−2 for the 4, 8, 16, and 32 plants∙m−2, respectively (Table 2). Plant density decreased signifi-
Table 1. Analysis of variance and mean squares for kenaf plant density, plant height, stem diameter, and biomass and ethanol yield for two row spacings (RS) and four plant densities (PD) combined across four environments (env), fargo and prosper, ND, in 2010 and 2011.
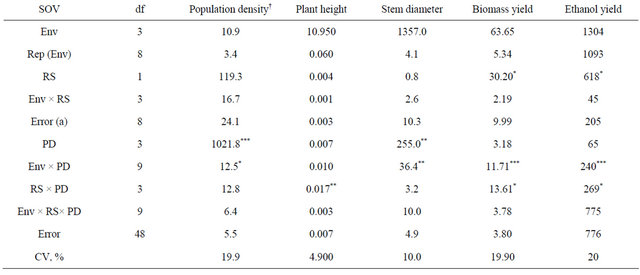
*, **, ***, significant at 0.05, 0.01, and 0.001 probability, respectively; †Population density at harvest.
Table 2. Means for population density at harvest, plant height, stem diameter, biomass and ethanol yield for four plant densities across two row spacings and four environments, fargo and prosper, ND, in 2010 and 2011.
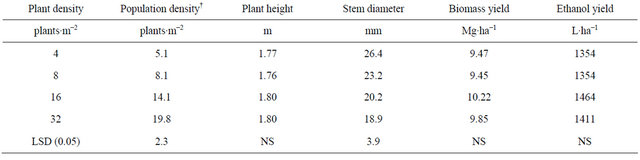
†Population density at harvest.
cantly from establishment to harvest for the 32 plants∙m−2 density. Intraspecific competition for light most likely enhanced self-thinning of the stands.
As plant density increased basal stem diameter decreased most likely due to the increased inter specific competition for light (Table 2). Although not recorded, it was observed that the branching of the basal stem was much lower at high plant densities and narrow row spacing. Danalatos and Archontoulis [10] also observed that at higher plant densities plant branching and basal stem diameter were lower. Also, a thinner stem will facilitate harvest.
The highest biomass and theoretical ethanol yield was obtained with 16 plants∙m−2 with a 30-cm row spacing although not significantly different than 32 plants∙m−2 at 30-cm row spacing (Table 3). At all plant densities, biomass and ethanol yield were higher when in 30-cm than 60-cm row spacing. Similarly, in a plant density study conducted in Mississippi, kenaf biomass yield was greatest with the narrowest row spacing of 35.5 cm, and lowest at the wider 71- and 101.6-cm row spacing [11]. Also, plant density had a minimal effect on final productivity in a kenaf study conducted in Greece [10].
In this study, biomass yield fluctuated between 9.45 and 10.22 Mg∙ha−1 and ethanol yield between 1354 and 1464 L∙ha−1. Greatest biomass yield obtained in Mississippi from a similar study was 21.3 Mg∙ha−1 from a 35-cm row spacing [11]. A recent study in New Mexico, reported biomass yields of only 2 to 5 Mg∙ha−1 when grown without irrigation [15].
Plant height was lower for the 4 plants∙m−2 density at the 60-cm row spacing than at the higher densities. Differences observed in plant height would not make a difference on harvest handling. Plant density did not affect plant height in a study conducted in Greece with plantdensities of 20 and 30 plants∙m−2 [10] with a row spacing of 50 cm.
Kenaf plants have the ability to branch and use the available land space to maintain total biomass productivity at lower plant densities; however, thicker plant stems resulting from the lower densities will make harvest difficult and accelerate wear on commercially forage harvesters.
3.2. Chemical Analysis
The analysis of variance indicated a significant main effect of plant density on glucan and xylan content (Table 4). The lowest plant density (4 plants∙m−2) had the lowest glucan and xylan content (P < 0.05) (Table 5). This result may be explained by the fact that the stems in the lowest plant density where thicker, and therefore, most likely, these stems had a higher proportion of core vs. bast fibers, the latter having a greater content of glucans than core fibers [16].
In other dedicated energy crops, such as switchgrass (Panicum virgatum L.), glucan and xylan content ranged between 34% to 46% and 22% to 26 %, respectively [17]. In corn (Zea mays L.) stover, glucan content ranged between 33% and 41%, and xylan content fluctuates between 19% and 25% [18].
Plant density did not influence lignin or ash content, but it is interesting to highlight the low ash content of kenaf that is less than 0.2%. Wood pellets a preferred
Table 3. Means for plant height, and biomass and ethanol yield for the interaction between row spacing and plant density combined across four environments in fargo and prosper, ND in 2010 and 2011.
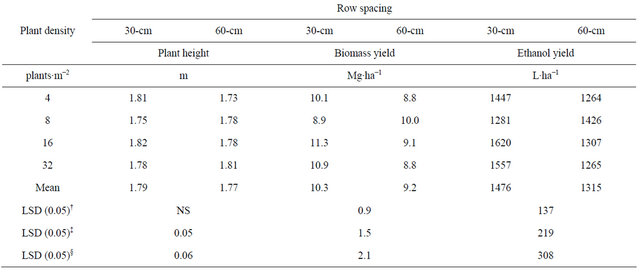
†LSD (0.05) to compare means between-row spacing; ‡LSD (0.05) to compare between different row spacing at the same level of within-row density; §LSD (0.05) to compare between same row spacing at different levels of within-row density.
Table 4. Analysis of variance and mean squares for kenaf biomass chemical composition for two row spacings (RS) and four plant densities (PD) combined across two environments (env), fargo and prosper, ND, in 2010.
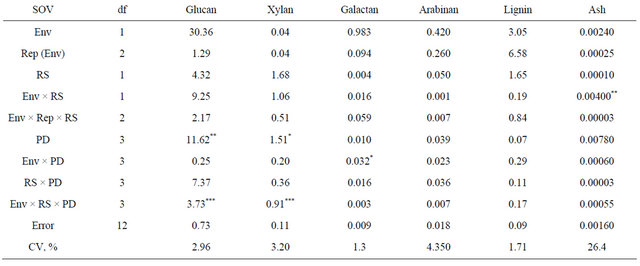
*, **, ***, significant at 0.05, 0.01, and 0.001 probability, respectively.
Table 5. Means for kenaf biomass chemical composition for four plant densities combined across two row spacings and two environments in fargo and prosper, ND, in 2010.
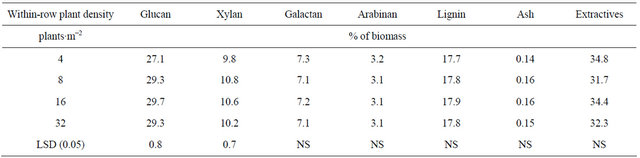
source of biomass for thermochemical conversion processes, have lower than 1% of ash, while agricultural residues and perennial grasses vary between 4% to 14% of ash content. Ash content and composition affects thermochemical conversion processes, such as gasification and pyrolysis, mainly at high temperatures. Ash melts at high temperatures plugging parts of the equipment and is difficult to remove and collect and thereby increases the operational costs of the processing plant [19]. Ohtani et al. [16] reported ash contents of 1.1% and 1.4% for kenaf bast and core fiber, respectively.
Lignin mean value in this study was 17%, lower than what is reported for switchgrass (18% - 23%) [17], corn stover [18], and other energy agricultural feed stocks [18, 20]. Ohtani et al. [16] reported a lignin content of 9.2% and 19% for kenaf bast and core fiber, respectively.
4. Conclusions
Kenaf plants responded significantly to row spacing but not plant density. Kenaf individual plants plasticity allows them to compensate for biomass productivity. A row spacing of 30-cm and plant densities of 16 to 32 plants∙m−2 are recommended for kenaf biomass production in the northern Great Plains. Although lower plant densities will compensate for yield, the thicker stems will make harvest difficult. Also higher plant densities increase the content of glucan and xylan which are the structural carbohydrates of interest for biochemical conversion to biofuel. The low ash content of kenaf biomass will make this feedstock suitable for thermochemical conversion processes as well.
Biomass yield obtained fluctuated between 9.45 and 10.22 Mg∙ha−1. The higher biomass yield, less lignin, and very low ash content of kenaf compared with most other perennial grasses and agricultural residues makes kenaf a promising feedstock for bioenergy production in the Northern Great Plains, USA.
5. Acknowledgements
This research was funded in part by USDA-CREES 2009-34622-19970 and USDA-NIFA SRGP 002756 (2009- 2012), Renewable Energy and Products: Agronomic potential for fuel production in North Dakota and the EPSCoR/DOE award, “Evaluation of Kenaf as a Renewable Source for ‘Green’ Chemicals and Fuels”.
Authors wish to thank Thomas Rymza (KP Products Inc. Vision Paper) for providing the seed for these studies, and to all technical staff, undergraduate and graduate students that collaborated in this project.
REFERENCES
- R. Hernández, S. Fernando and T. French, “Development of a Bioadsorbent for the Biodiesel Industry,” 2012. http://www.technologyalliance.ms/strategic-biomass-solu-tions/ms-projects/university-research.php
- T. J. Benson and C. E. George, “Cellulose Based Adsorbent Materials for the Dehydration of Ethanol Using Thermal Swing Adsorption,” Adsorption, Vol. 11, No. 1, 2005, pp. 697-670. doi:10.1007/s10450-005-6009-1
- A. Borazjani and S. Diehl, “Kenaf Core as an Enhancer of Bioremediation,” 2010. http://journeytoforever.org/biofuel.html
- C. E. Goforth, “The Evaluation of Kenafan Oil Sorbent,” 2011. http://journeytoforever.org/biofuel.html
- C. L. Webber III and R. E. Bledsoe, “Kenaf: Production, Harvesting, Processing, and Products,” In: J. Janick and J. E. Simon, Eds., New Crops, Wiley, New York, 1993, pp. 416-421.
- S. Dash, “Screening Plant Species for Potential Adaptation as Agronomic Crops in North Dakota,” MS Thesis, North Dakota State University, Fargo, 2005.
- A. W. Scott Jr. and C. S. Taylor, “Economics of Kenaf Production in the Lower Rio Grande Valley of Texas,” In: J. Janick and J. E. Simon, Eds., Advances in New Crops, Timber Press, Portland, 1990, pp. 292-297.
- J. H. Massey, “Effects of Plant Density on Two Varieties of Kenaf in the Georgia Piedmont Region,” Agronomy Journal, Vol. 65, No. 5, 1973, pp. 848-849. doi:10.2134/agronj1973.00021962006500050055x
- F. E. Robinson, “Kenaf: Anew Fiber Crop for Paper Production,” California Agriculture, Vol. 42, 1988, pp. 31- 32.
- N. G. Danalatos and S. V. Archontoulis, “Growth and Biomass Productivity of Kenaf (Hibiscus cannabinus, L.) under Different Agricultural Inputs and Management Practices in Central Greece,” Industrial Crops and Products, Vol. 32, No. 3, 2010, pp. 231-240. doi:10.1016/j.indcrop.2010.04.013
- B. S. Baldwin and J. W. Graham, “Population Density and Row Spacing Effects on Dry Matter Yield and Bark Content of Kenaf (Hibiscus cannabinus L.),” Industrial Crops and Products, Vol. 23, No. 3, 2006, pp. 244-248. doi:10.1016/j.indcrop.2005.06.005
- B. S. Dien, G. Sarath, J. F. Pedersen, S. E. Sattler, H. Chen, D. L. Funnell-Harris, N. N. Nichols and M. A. Cotta, “Improved Sugar Conversion and Ethanol Yield for Forage Sorghum (Sorghum bicolor L. Moench) Lines with Reduced Lignin Contents,” Bioenergy Research, Vol. 2, No. 3, 2009, pp. 153-164. doi:10.1007/s12155-009-9041-2
- S. G. Carmer, W. E. Nyquist and W. M. Walker, “Least Significant Differences for Combined Analyses of Experiments with Twoor Three-Factor Treatment Designs,” Agronomy Journal, Vol. 81, No. 4, 1989, pp. 665-672. doi:10.2134/agronj1989.00021962008100040021x
- SAS Institute, “The SAS System for Windows,” SAS Institute, Cary, 2009.
- L. M. Lauriault and N. Puppala, “The Influence of Rainfed and Limited Irrigation Conditions and Early vs. Late Plantings on Kenaf as Potential Industrial Crop in the Southern High Plains, USA,” Industrial Crops and Products, Vol. 29, No. 2-3, 2009, pp. 549-553. doi:10.1016/j.indcrop.2008.10.006
- Y. Ohtani, B. B. Masumder and K. Sameshima, “Influence of the Chemical Composition of Kenafbast and Core on the Alkaline Pulping Response,” Journal of Wood Science, Vol. 47, No. 1, 2001, pp. 30-35. doi:10.1007/BF00776642
- Z. Hu, R. Skyes, M. F. Davis, E. C. Brummer and A. J. Ragauskas, “Chemical Profiles of Switchgrass,” Bioresource Technology, Vol. 101, No. 9, 2010, pp. 3253-3257. doi:10.1016/j.biortech.2009.12.033
- D. K. Lee, V. N. Owens, A. Boe and P. Jeranyama, “Composition of Herbaceous Biomass Feedstocks,” North Central Center, South Dakota State University, Brookings, 2007.
- Biomass Energy, “Significant Biomass Properties. Part 2: Ash Content,” 2012. http://www.biomassenergy.gr/en/articles/technology/biom-ass/315-significant-biomass-properties-part-2-ash-content
- Q. Xue, P. E. Nyren, G. Wang, E. Ericksmoen, G. Bradbury, M. Halverson, E. Aberle, K. Nichols and M. Liebieg, “Biomass Composition of Perennial Grasses for Biofuel Production in North Dakota, USA,” Biofuels, Vol. 2, No. 5, 2011, pp. 1-13. doi:10.4155/bfs.11.123
NOTES
*Corresponding author.