American Journal of Analytical Chemistry
Vol.4 No.10A(2013), Article ID:38577,15 pages DOI:10.4236/ajac.2013.410A1009
Normalized Rare Earth Elements in Water, Sediments, and Wine: Identifying Sources and Environmental Redox Conditions
1Geological Survey, Menlo Park, USA
2Jacobs University, Bremen, Germany
Email: dzpiper@usgs.gov
Copyright © 2013 David Z. Piper, Michael Bau. This is an open access article distributed under the Creative Commons Attribution License, which permits unrestricted use, distribution, and reproduction in any medium, provided the original work is properly cited.
Received July 25, 2013; revised August 25, 2013; accepted September 20, 2013
Keywords: Rare Earth Elements; Cerium Redox; Seawater/Sediment; Sources
ABSTRACT
The concentrations of the rare earth elements (REE) in surface waters and sediments, when normalized on an elementby-element basis to one of several rock standards and plotted versus atomic number, yield curves that reveal their partitioning between different sediment fractions and the sources of those fractions, for example, between terrestrial-derived lithogenous debris and seawater-derived biogenous detritus and hydrogenous metal oxides. The REE of ancient sediments support their partitioning into these same fractions and further contribute to the identification of the redox geochemistry of the sea water in which the sediments accumulated. The normalized curves of the REE that have been examined in several South American wine varietals can be interpreted to reflect the lithology of the bedrock on which the vines may have been grown, suggesting limited fractionation during soil development.
1. Introduction
The rare earth elements (REE), or lanthanide elements, are a group of 14 elements that have similar crystal ionic radii and valance state. They have a decreasing crystal ionic radius from La (1.016 Å) to Lu (0.85 Å) and a single 3+ valence within the siliciclastic fraction of sediments and sedimentary rocks. This imposes limitations on their fractionation within siliciclastic debris during weathering and eventual transport by rivers as a suspended or colloidal fraction. Thus, they are an ideal group to identify the sources of the lithogenous fraction of marine and non-marine sedimentary deposits, e.g., maficand felsic-igneous and sedimentary rocks.
By contrast, the REE in the dissolved load of rivers may exhibit measurable fractionation [1-3]. Cerium, in the 3+ valence state in the suspended load of rivers, is oxidized to the highly insoluble 4+ valence state that continues upon its entering the ocean [4-9]. As a result, Ce is depleted in seawater, relative to the remaining elements of the group that maintain their 3+ valence state. Nonetheless, the 3+ valence REE also exhibit interelement fractionation, owing to their formation of complexes mostly with 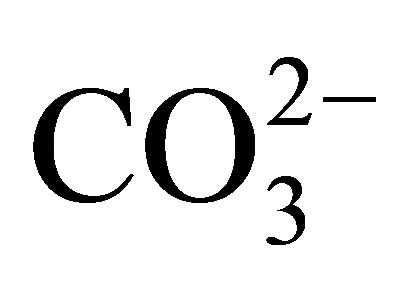 [10-12]. In seawater, the complexed species exhibit an increase in their stability with increasing atomic number. This results in a relative increase in their concentration with increasing atomic number. Adsorption reactions on particle surfaces contribute further to their fractionation [13].
These differences in the behavior of the individual REE in seawater are recorded by differences in the REE curves of the various seawater-derived fractions of marine sediments, i.e., the marine hydrogenous and biogenous sediment fractions [4] versus the terrestrial-derived lithogenous fraction. For example, abyssal ferromanganese nodules (e.g., [6,14]) and seamount ferromanganese crusts [15-18] exhibit an enrichment of Ce, whereas pelletal carbonate fluorapatite (CFA), glauconite [19], phillipsite [20], biogenic calcium carbonate [21], opal [6], and less so barite [22] exhibit a Ce depletion relative to its nearest neighbors La and Pr. The 3+ valence REE commonly exhibit an increase in concentration with increasing atomic number, again a reflection of their propensity to form complexes with 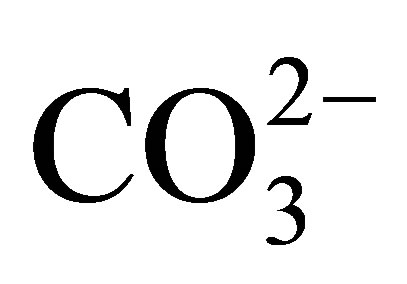 and other ligands. We review here a fraction of the research on the behavior of the REE in soils, surface waters, sediments, and sedimentary rocks; from source rocks, to streams, to seawater, to their deposition and eventual burial in sea floor sediments. They have proven to be invaluable in contributing to an overall improved understanding of the geochemistry of earth-surface processes.
2. Analytical Techniques
The REE gained wide attention following the work of Haskin and Gehl [23], Goldberg et al. [4], and Høgdahl et al. [24], who documented the potential that these elements offered in advancing our understanding of the geochemical history of sedimentary environments. They showed that several members of the group can be measured by neutron activation analysis in marine sediments and seawater, in which the concentrations are as low as a few nanograms per liter (in seawater) to micrograms per gram (in sediments). This method was expanded to include the examination of a wide range of sedimentary components following the development of high-resolution Ge(Li) g-ray detectors, e.g., soils, marine and nonmarine sediments, volcanic deposits, biogenic detritus, aerosols, the dissolved and suspended fractions of steams and seawater, moon rocks, and chondrites. Instrumental neutron activation analysis remained widely used for some 20 years until it was largely supplanted by other techniques, coupled with various leaching and extraction procedures that have allowed for the analysis of the complete group of REE in a wide range of sample types [1,5,8,9,16,25]. These techniques also greatly improved the analytical accuracy and precision, now better than ca 5%.
The REE are the prime example of the Oddo-Harkins Rule [26-28], whereby even-numbered elements are more abundant than odd-numbered elements (Figure 1), owing to the greater nuclear stability gained by the pairing of protons that offsets the spin of the one by the other. Promethium (atomic number 61) does not occur naturally, having no isotope with a half-life greater than ca 20 days. The herringbone-shaped curve of their measured concentrations, when plotted versus atomic number, is converted to a smooth curve by normalizing the REE on an element-by-element basis to one of several rock standards (Figure 2). The procedure allows the relative concentrations of the REE in different samples to be easily compared visually.
Standards that are commonly used (Table 1) include the World Shale Average (WSA), as calculated by Piper [20] from analyses published by Haskin and Haskin [29] and Wedepohl [30]; the North American Shale Composite (NASC), analyzed by Gromet et al. [31]; the Upper Continental Crust (UCC), with several slightly different values reported by numerous individuals (e.g., [32-34]), but with quite similar interelement concentrations; Post Archean Australian Shale (PAAS), advanced by McLennan [35]; and lastly an average of chondrites [26]. The concentrations of the REE in these standards represent two compositional extremes of siliciclastic-source-rocks
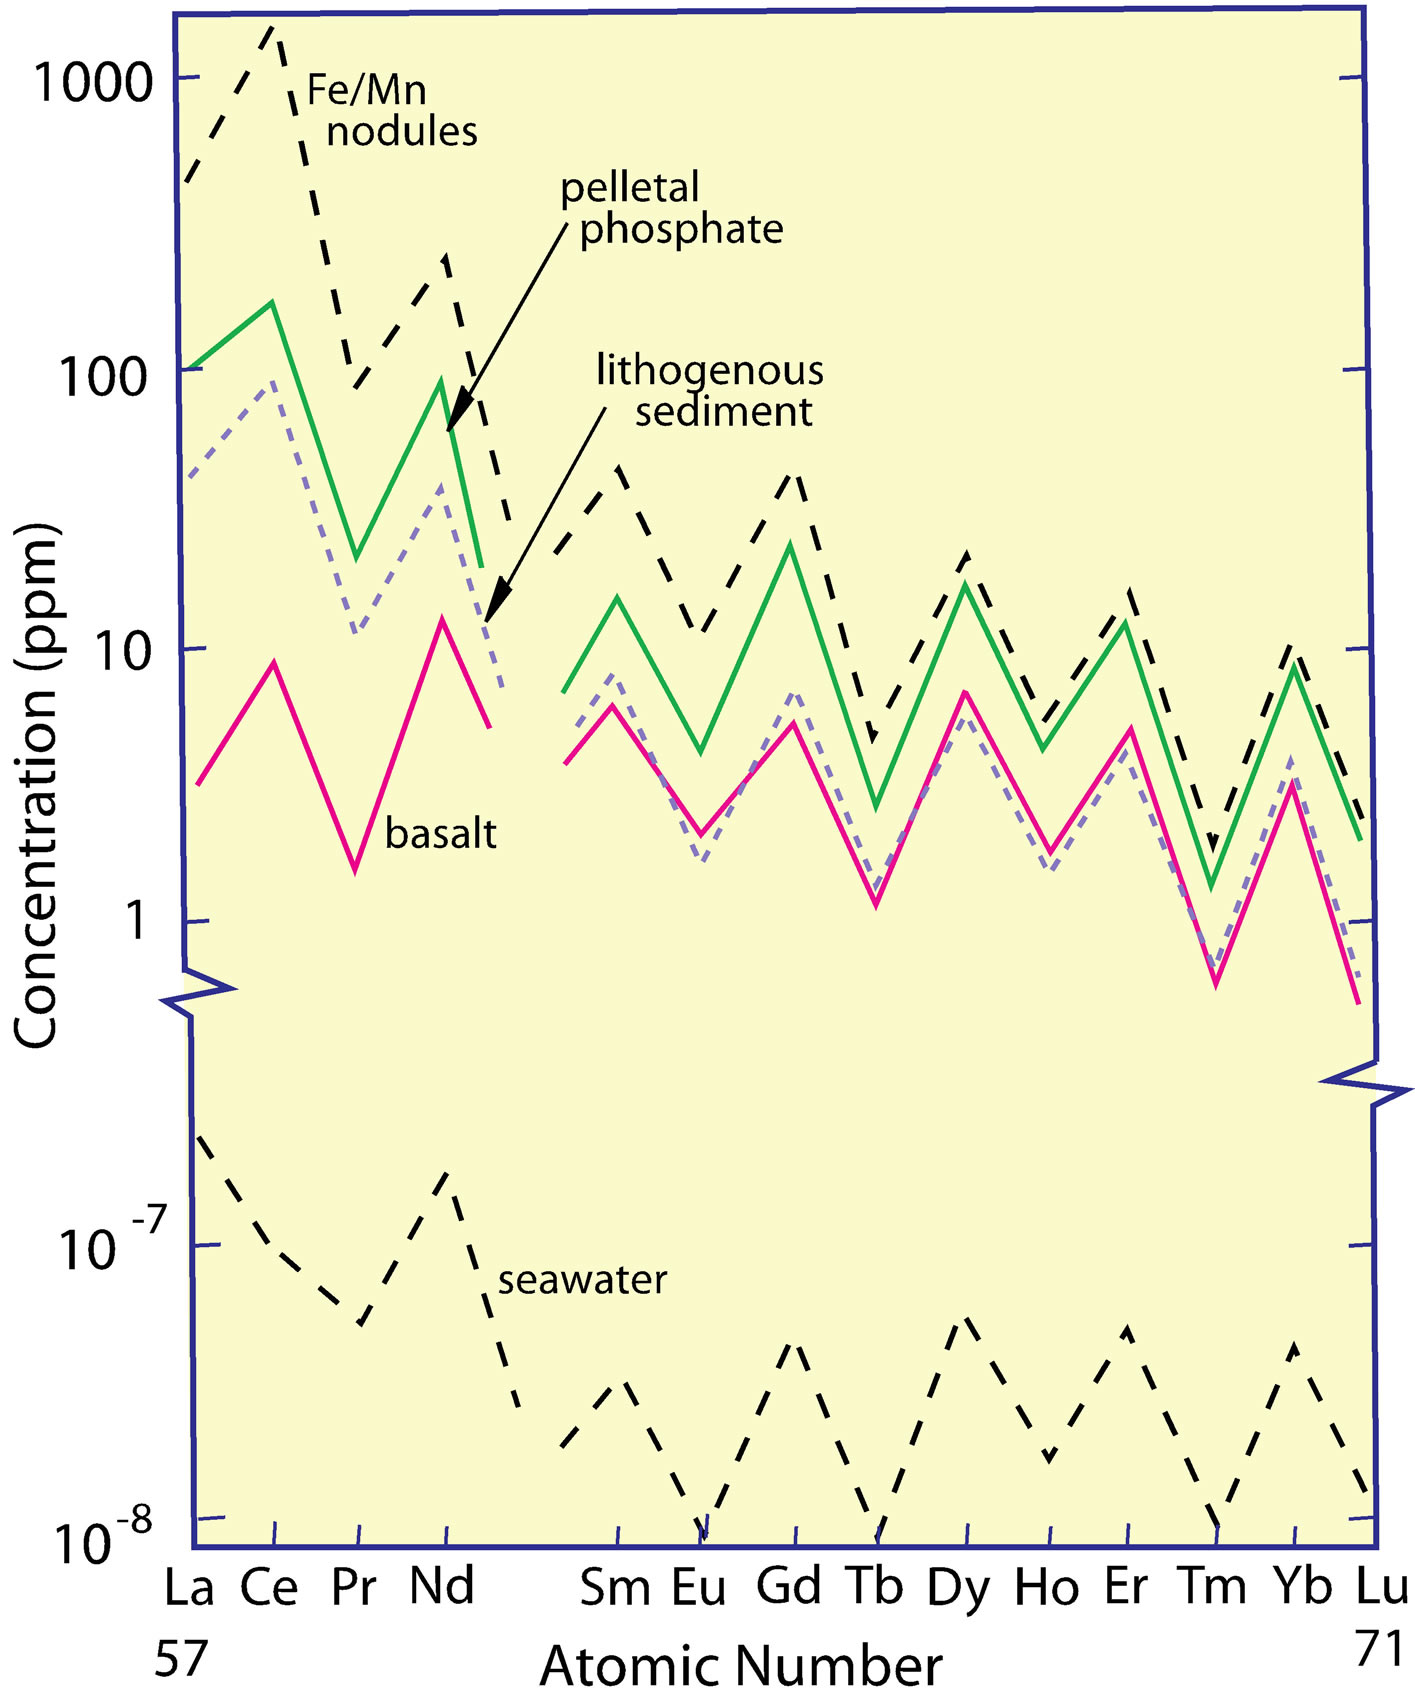
Figure 1. The measured concentrations of REE in seawater, several marine sediment phases, and basalt, all of which exhibit the odd/even concentration difference explained by the Oddo-Harkins Rule.
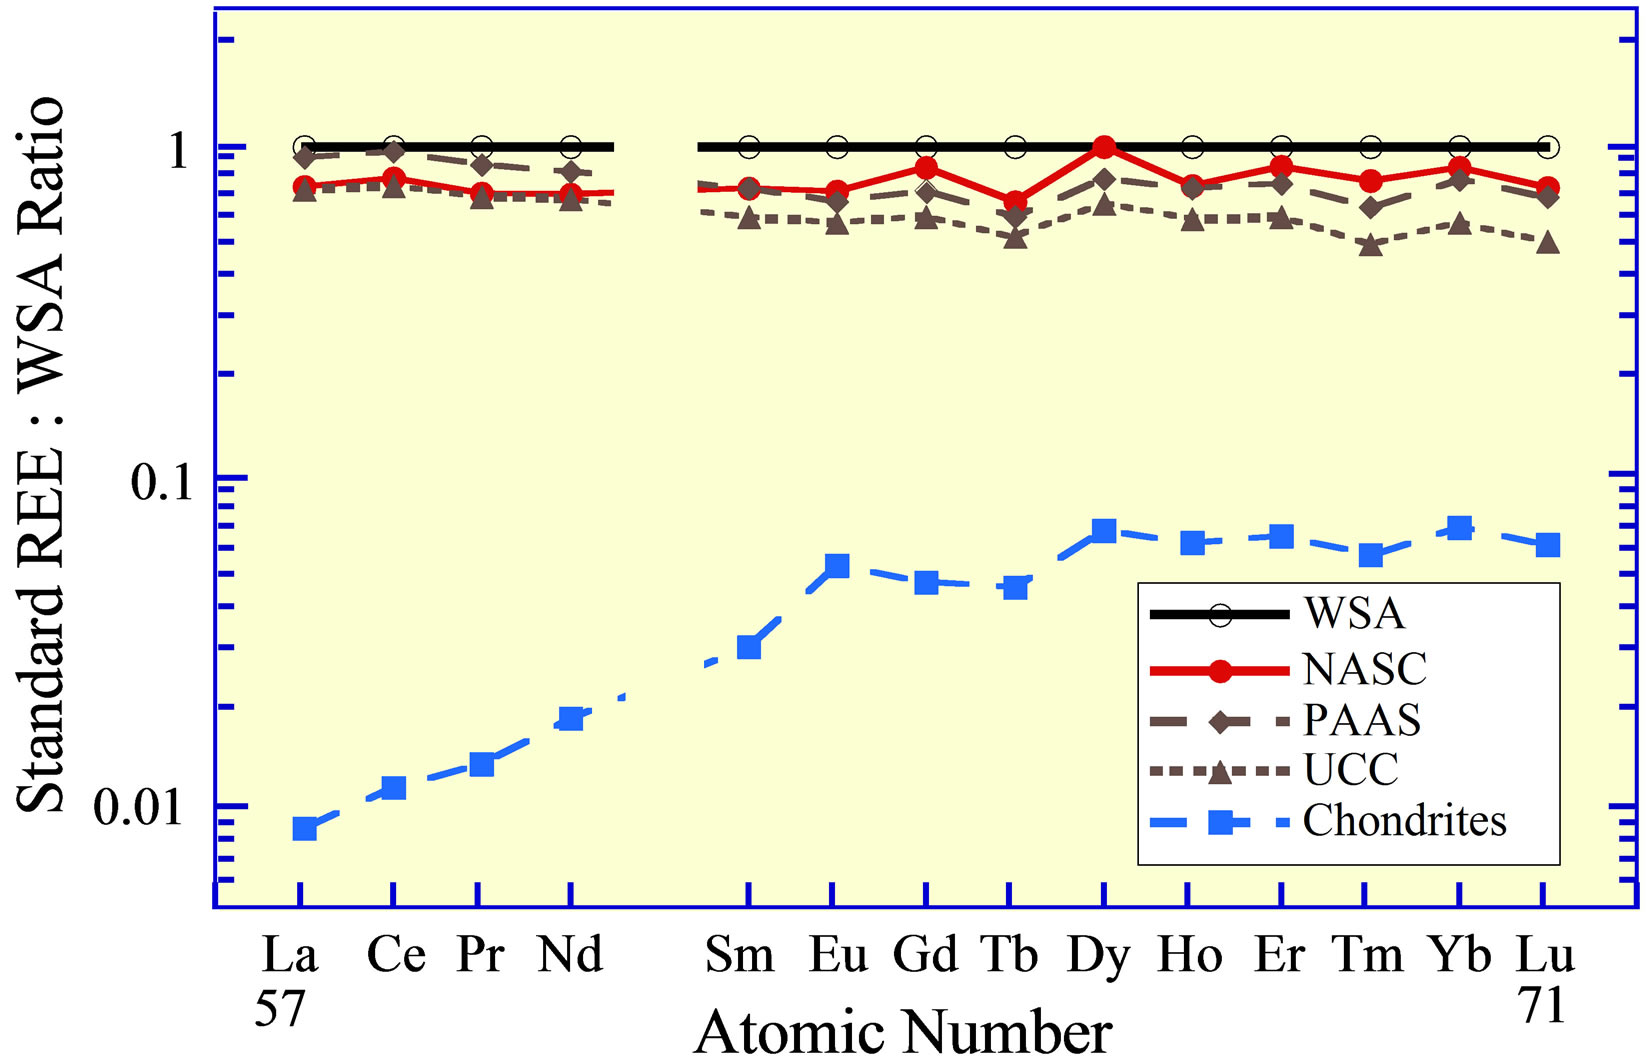
Figure 2. The REE curves of rock standards (Table 1): World Shale Average (WSA), Post Archean Australian Shale (PAAS), North American Shale Composite (NASC), the Upper Continental Crust (UCC), and an average of chondrites.
(Figure 2), the one felsic (WSA, UCC, PAAS, NASC) and the second ultramafic (chondrites).
Although the curves for the WSA and NASC exhibit slightly higher concentrations of the heavy REE versus the light REE, than the curves for the UCC and PAAS, these standards exhibit normalized curves that are quite similar. Considering that they represent sedimentary rocks of different geologic ages that were collected throughout the world and likely have been recycled numerous times (from surface weathering under various conditions, to erosion, to stream and/or wind transport, to ocean deposition under possibly different geochemical environments, to burial, to uplift, to…), their virtually identical interelement REE concentrations seem to reflect a coherence for this group of chemical elements quite beyond what might have been expected, considering their different
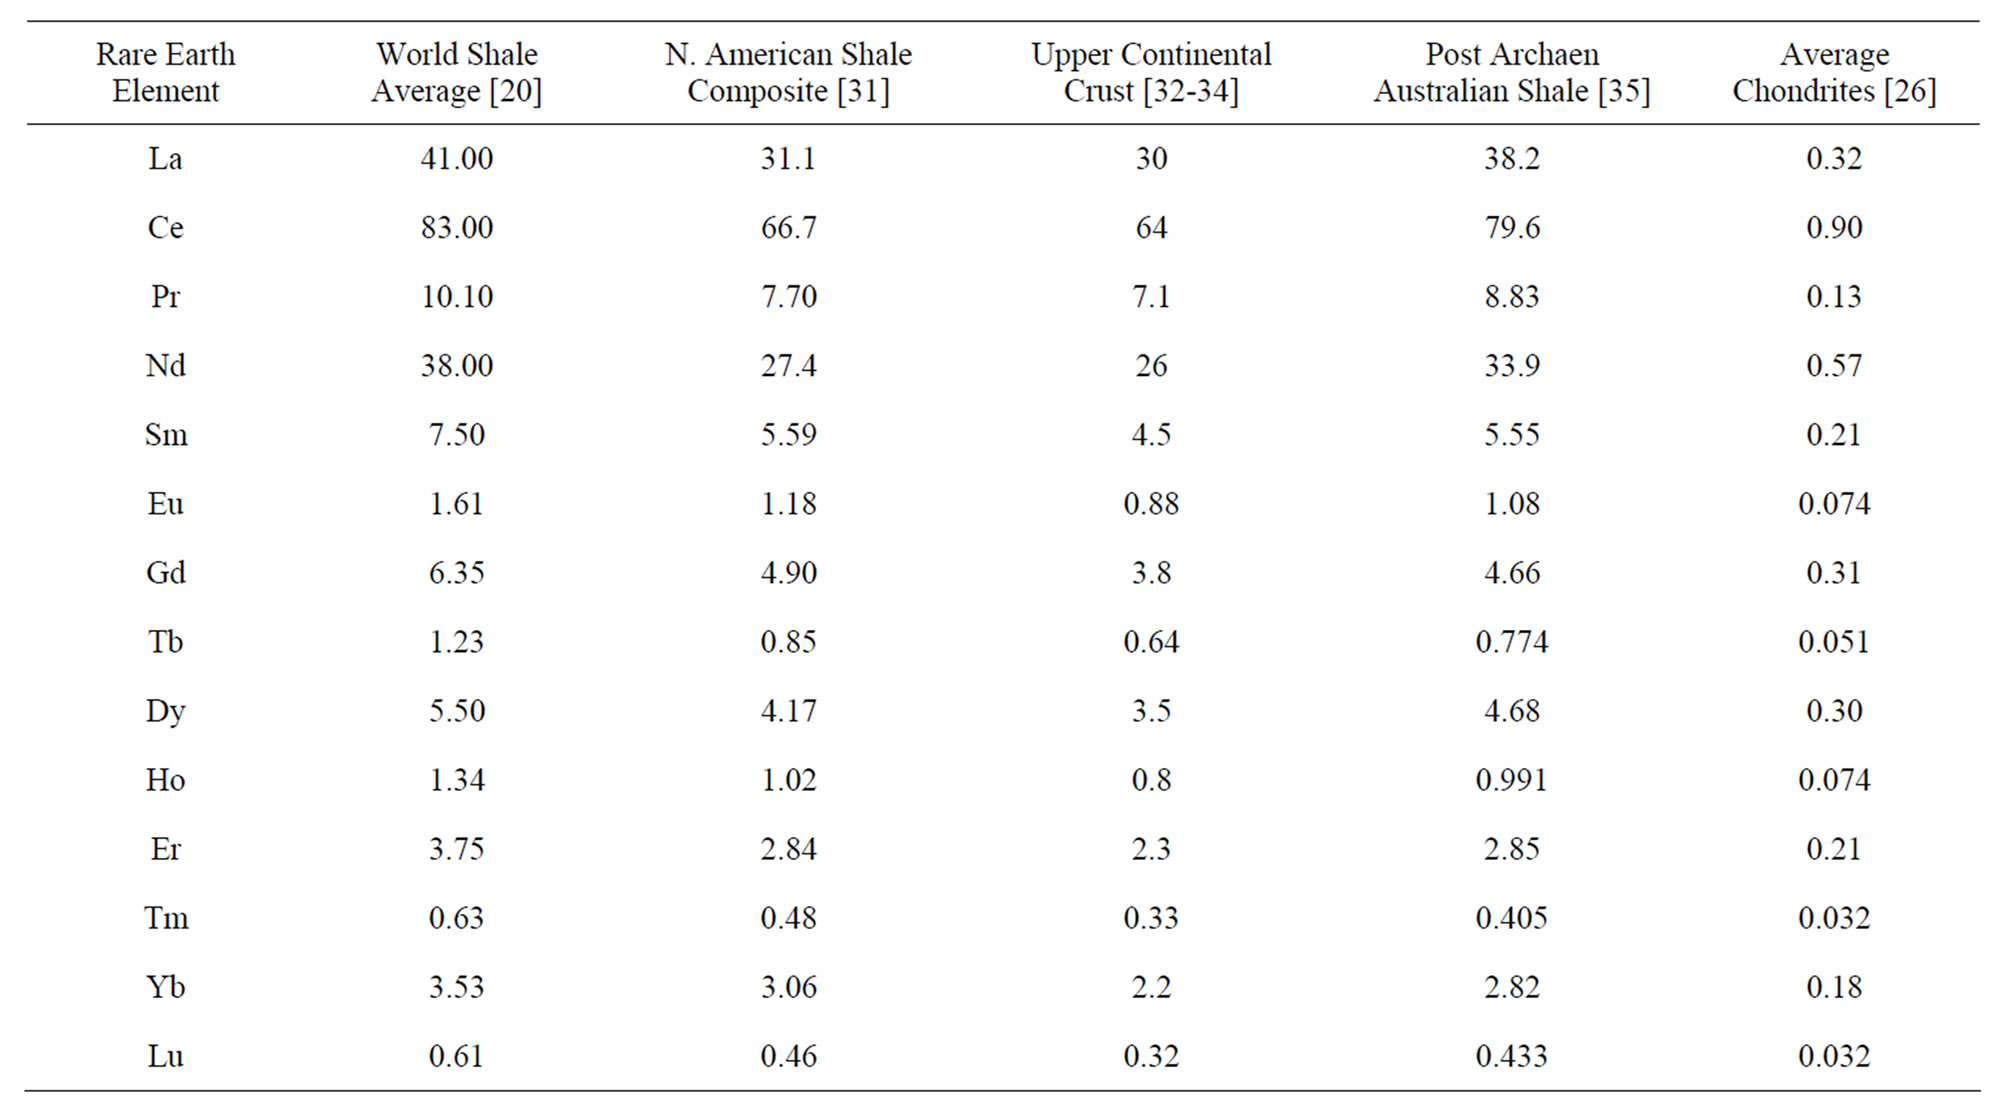
Table 1. Elemental composition of rock standards—World Shale Average (WSA), North American Shale Composite (NASC), Upper Continental Crust (UCC), Post Archean Australian Shale (PAAS), and average chondrites.
possible valence states, slightly different ionic crystal radii in the 3+ valence state, and varying propensity to form complexes in solution with various ligands.
Goldberg et al. [4], Haskin and Haskin [29], and Høgdahl [36] employed the average of several chondrites to normalize the REE in marine samples they examined, although it is perhaps more appropriately used in the study of mafic and ultramafic rocks. Piper [20] proposed that the WSA represents perhaps a more appropriate standard in the examination of marine and non-marine sediments and surface waters, owing to similar relative concentrations of the REE in the standard and their concentrations in sediments, river waters, and less so seawater. The WSA continues to be used, but the UCC and PAAS standards are perhaps now more commonly used. The chondrite standard is still used by some in their analysis of marine and non-marine sediments and surface water, although possibly more to mask analytical uncertainties than to reveal the similar behavior of the REE. Goldstein and Jacobsen [1] obtained rather different values for the NASC than Gromet et al. [31], which they attributed largely to heterogeneity of the standard. An average of a subgroup of samples being examined has also been employed to normalize individual sets of samples as it can emphasize subtle differences between samples that might otherwise escape detection. The standard one elects to use, however, is quite unimportant, as long as its interelement concentrations are similar to those in the samples being examined.
3. REE in Rivers and Seawater
3.1. Rivers
The REE in several of the world’s major rivers [37], normalized to any one of the felsic rock standards, reveal that the bulk REE concentrations exhibit a rather flat curve (Figure 3(a)). In contrast to these curves, Goldstein and Jacobsen [1], Elderfield et al. [2], and Sholkovitz [3] established that the dissolved load of rivers, although representing a minor fraction of the total REE load of rivers, is fractionated from the suspended load, which is dependent on the chemistry of the water (e.g., salinity, pH, alkalinity, and biological activity). In general, the result of the fractionation is to increase the heavy REE concentrations in the dissolved fraction, relative to the light REE concentrations (Figure 3(b)). This fractionation between the dissolved and suspended load was interpreted to contribute directly to the REE curve of the dissolved fraction of seawater, but reactions between seawater and river water within estuaries greatly complicate the contribution of river borne REE entering the ocean to the eventual composition of seawater.
The flat curve of the suspended load of rivers commonly resembles the curve of the source rocks [2] in the drainage basin (Figure 4(a)). It contrasts sharply with the curves and elevated concentrations of the bed load (Figure 4(b)) of streams [38]. The concentrations of the heavy-mineral-hosted elements—Ti and Zr—also exhibit strong enrichments within the stream bed load with their
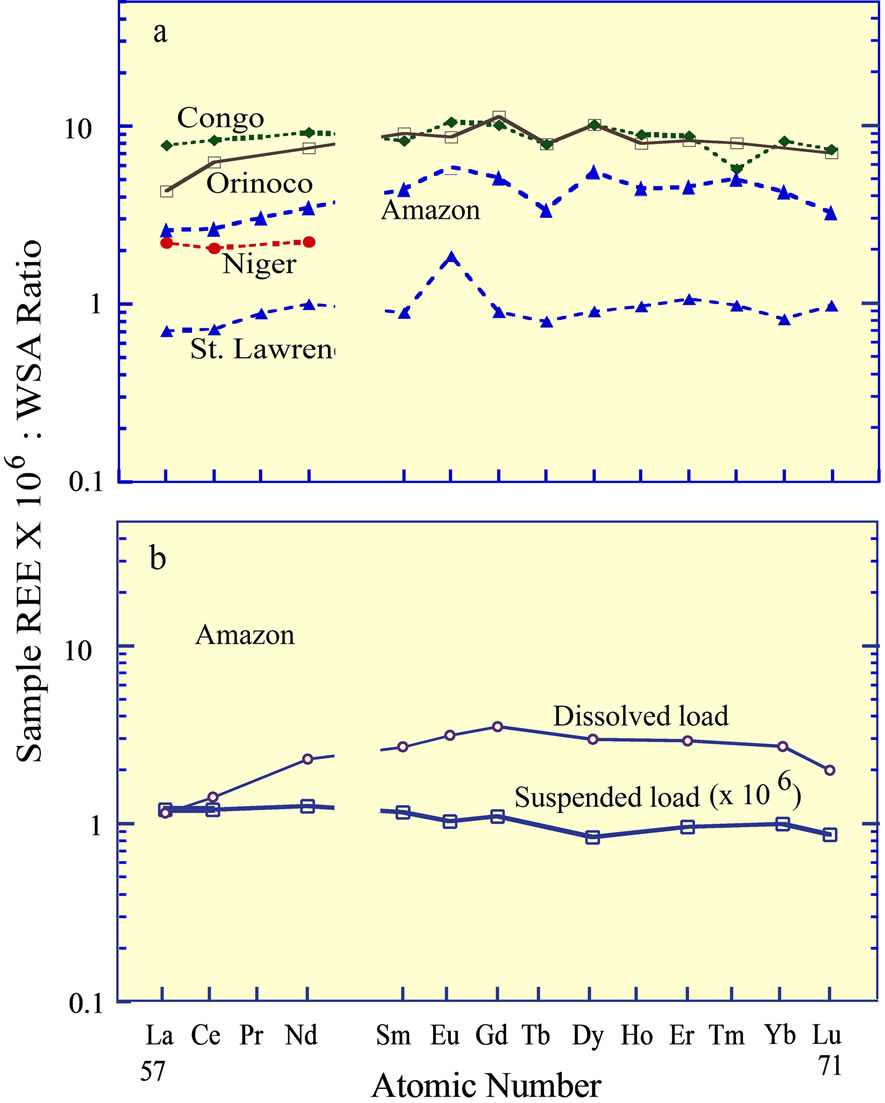
Figure 3. (a) The REE curves of several of the world’s major rivers [37]; (b) The curves of the dissolved and suspended fractions in the Amazon River, separated by filtration [3].

Figure 4. (a) The REE curves of bed sediments in the Big Black River [38], a tributary to the Mississippi River and (b) of soils within its drainage basin.
order of enrichment and that of the REE being the following:
 , (1)
, (1)
suggesting that the heavy minerals are a major host of the REE in bed sediments.
3.2. Seawater
In contrast to the partitioning of the REE largely into the suspended fraction in rivers [1], they are strongly partitioned into the dissolved fraction in seawater, i.e., into filtered seawater. The curve of seawater, in general, exhibits a negative Ce anomaly [4,5,8,9,24,39,40] and progressive enrichment of the heavy REE, relative to the light REE (Figures 5 and 6(a)). Although the curves are somewhat different between the oceans and with depth in each individual ocean, the changes in the normalized curves with depth clearly reflect the exchange reactions between suspended phases and the dissolved load that are superimposed on the history of advection of the different water masses. The water masses in the Atlantic Ocean, with increasing depth, are surface water, Antarctic Intermediate Water, North Atlantic Deep Water, and Antarctic Bottom Water [41]. The advection of Antarctic Bottom Water that has relatively low REE concentrations produces a mid-water REE concentration maximum in both the Atlantic and Pacific Ocean [8,36].
The negative Ce anomaly of seawater reflects its oxidation to the strongly insoluble 4+ valence under oxic to suboxic redox conditions in the open ocean today (Table 2), in contrast to the other REE that maintain a 3+ valence. They too are fractionated from each other by their complexation with 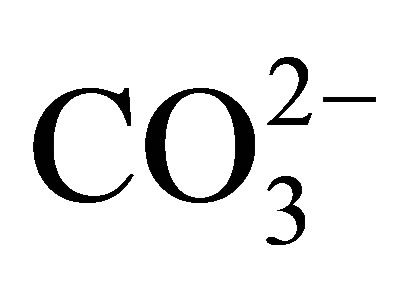 and less so with
 , and adsorption on the surfaces of suspended particles [12,13]. The complexes exhibit an increase in stability with in-
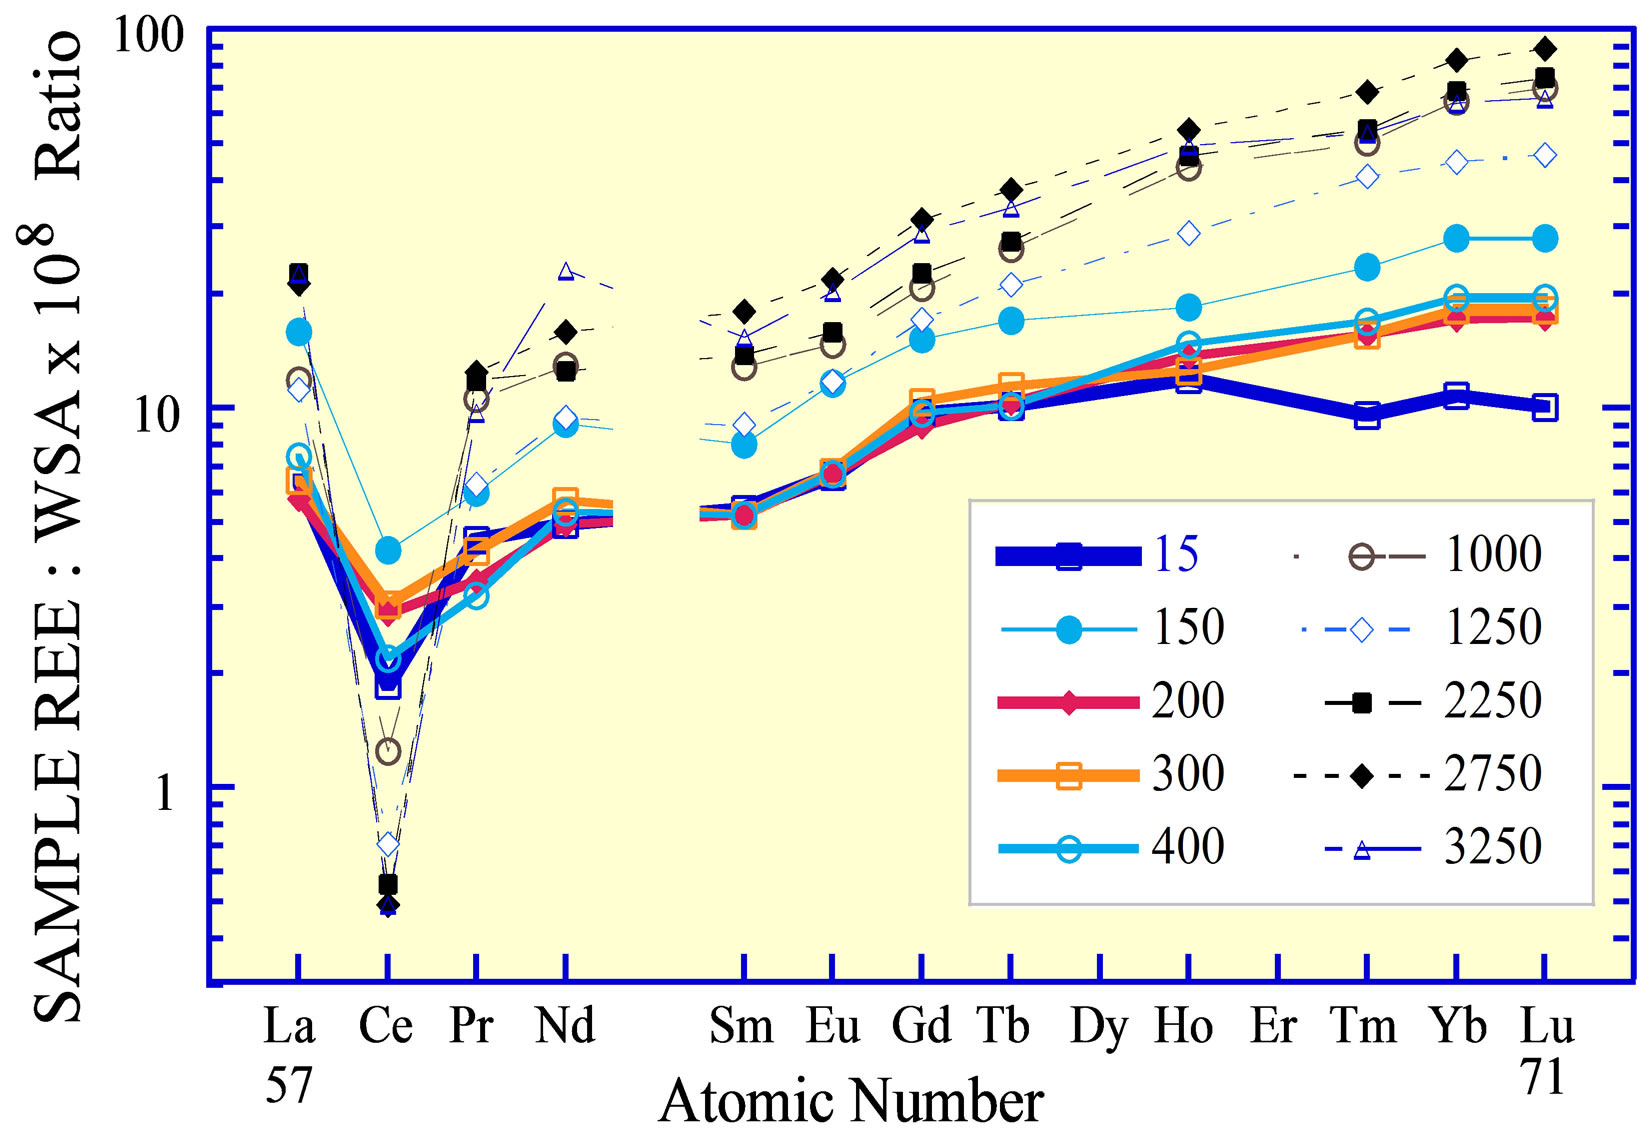
Figure 5. The REE curve of seawater from the eastern Pacific Ocean [5]. Note the REE curve of the samples from 200 to 300 m water depth, from the core of the O2 minimum layer, with a normalized Ce concentration that is less than the Ce anomaly of waters collected at both shallower and deeper depths.

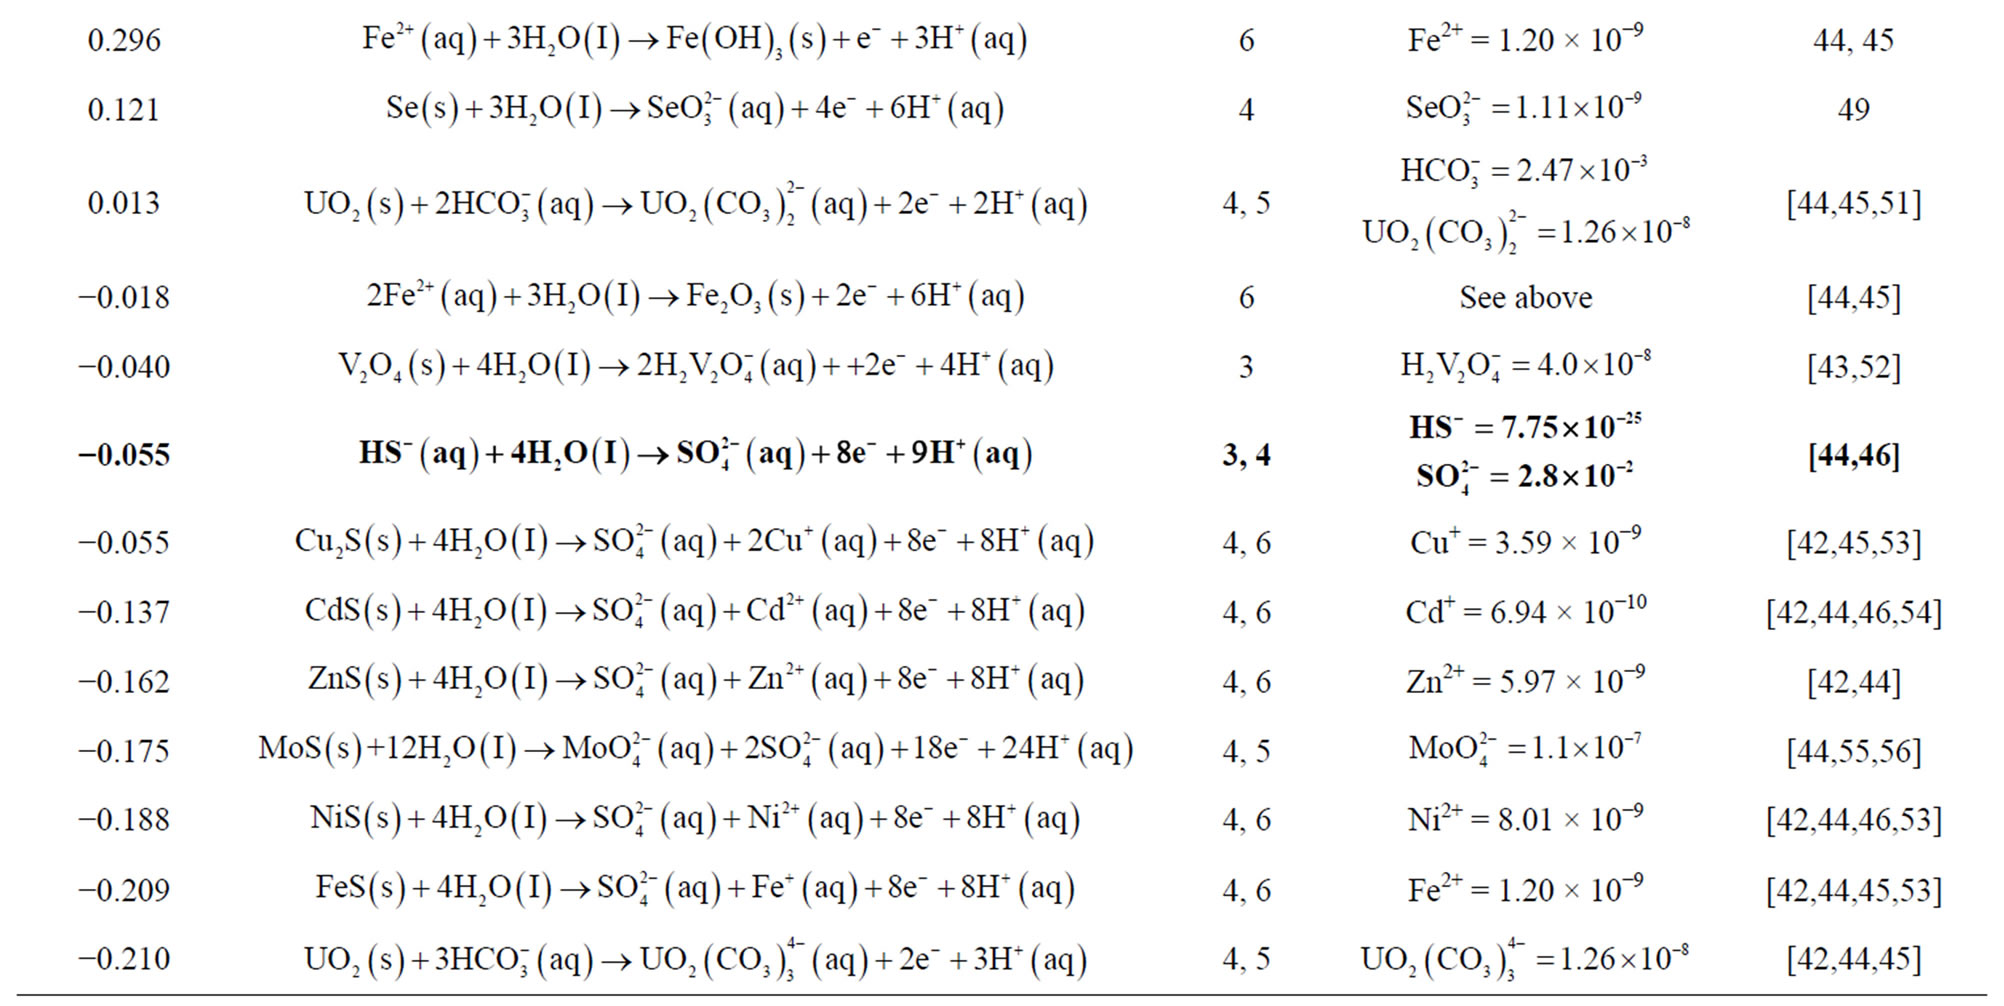
Table 2. Half-cell reactions assuming standard-state conditions and seawater concentrations for the trace elements. The master half-cell reactions for seawater are the three reactions written in bold print, owing to the elevated concentration O2,  , and
, and  above those of the trace metals. Ground waters may have these same master half-cell reactions, but concentrations will likely be quite different.
#Values of the effective ionic diameter used in the Debye-Hückel equation.
creasing REE atomic number, i.e., the heavy REE are more strongly partitioned into the complexed fraction versus the ionic state than are the light REE. As the complexed fraction of each REE is less reactive to adsorption reactions, the heavy REE are less readily removed from seawater onto suspended phases than are the light REE [3]. Thus, the REE exhibit an increase of their normalized concentrations in the seawater with increasing atomic number, as reflected by their increase in residence time in the ocean—500 yrs for La increasing to 2890 yrs for Lu [57]. Cerium, with a residence time of only 50 yrs, is an exception to this trend, owing to its oxidation to the 4+ valence (Table 2).
Separation of the suspended load of seawater, the fraction > 0.4 µ that is recovered by filtration [9], from the dissolved load reveals the partitioning of the REE within the suspended fraction largely into an Al-silicate lithogenous fraction, a Mn-oxide fraction, and likely a Fe-oxide fraction. The composition of each of the suspended fractions contrasts with the dissolved fraction (Figure 6). The Mn-oxide fraction exhibits a strongly evolving curve with ocean depth. Within the upper ca 100 m of the water column, it exhibits a negative Ce anomaly (Figure 6(b)), similar to the dissolved fraction of seawater itself (Figure 6(a)). The anomaly becomes strongly positive to ca 1000 m depth, possibly in response to the crystallization of the fully oxidized suspended Mn oxide, on which Ce4+ is adsorbed through biologically mediated redox and adsorption reactions [58]. The 3+ valence REE are also enriched in the Mn-oxide, the light REE more so than the heavy REE in accord with their partition coefficients with  complexes [11-13]. Their partitioning into both Fe and Mn fractions of ferromanganese crusts that are universally present on ocean seamounts suggests that both Mn and Fe oxides contribute to the depth curves of the REE in the suspended load [16,18]. Thus, the curves for the REE in seawater are established by their partitioning between dissolved and suspended fractions within seawater itself, that is, by their complexation mostly with
  that controls adsorption/desorption reactions onto and off of particle surfaces, redox reactions mitigated by the oxidation of organic matter, and the presence of a geochemically largely non-reactive Al-silicate fraction.
4. REE in Sediments
4.1. Terrestrial Sediment
Loess deposits may perhaps represent a reliable average composition of terrigenous sedimentary deposits. Taylor et al. [59] reported that these deposits, collected from several continents, have REE curves (Figure 7) that closely resemble the shale curve (Figure 2), with slight fractionation between light and heavy REE as a function

Figure 6. The REE curve of seawater from the Sargasso Sea in the Atlantic Ocean [7] and (b) of the suspended fraction of seawater collected on a 0.4 µm filtered and dissolved in acetic acid [9].

Figure 7. The REE curves of loess deposits. See Taylor et al. [59] for sample locations.
of grain size [60] and surface weathering [61]. Their bulk composition might, however, be represented by a single grain size, by the <4 µ fraction [62]. The REE curves of the eolian deposits, thus, are strongly reflective of the mean curve of their source rocks.
4.2. Marine Sediment Faction
Marine sediments that accumulated distant from major volcanic activity are composed of essentially two fractions, a land-derived lithogenous fraction and a seawaterderived fraction, which is sub-divided into a hydrogenous fraction and a biogenous fraction [4]. Aluminum serves as a proxy for the lithogenous fraction [63,64]. Examples of trace elements also hosted predominantly by this fraction include the alkali metals, heavy-mineral hosted trace elements, plus Nb, Ga, Sc, Ta as evidenced by their linear correlations with Al that extrapolate essentially to the origin [65]. Their relationship with Al adds support to the use of Al alone as a proxy for this sediment fraction. The lithogenous contribution of the REE can then be estimated from the REE:Al ratios of one of the rock standards whose Al-normalized metal contents, e.g., the alkali-metal:Al ratios, are closest to those of the sediments being examined.
The marine fraction of the REE is then estimated by the elevated REE:Al ratios above the ratios in the rock standard. This fraction may further include C as organic matter, Ca and Si as CaCO3 and opal tests of plankton, respectively; Cd, Cu, and Ni as trace nutrients; Cr, Fe, Mn, Mo, U, and V, plus Cd and Cu [66] as redox sensitive trace elements; and inorganically and biologically mediated surface-adsorbed elements. Along several ocean margins that exhibit relatively low accumulation rates of lithogenous sediment and suboxic conditions in the water column, i.e.,  reduction or denitrification (Table 2), a seawater-derived REE fraction can be present above the terrigenous input of sedimentary debris. Similarly, sediments from the oxic pelagic environment can also exhibit REE concentrations that are elevated above a lithogenous contribution. Sediments that accumulate under seawater anoxic sulfate-reducing conditions, for example, that typify the bottom waters of the Black Sea and Cariaco Basin, do not exhibit a seawater-derived REE fraction, as evidenced by the REE profiles in the water column of these basins [67-69] and the REE:Al ratios of the basin sediments [65].
4.2.1. Lithogenous Sediment Fraction
Marine sediments that have accumulated along ocean margins, where the lithogenous sediment fraction dominates the bulk sediment composition, commonly exhibit REE curves that represent the composition of their terrigenous source rocks [27,70-73]. Modeling and leaching analyses of Quaternary pelagic sediments from the central Pacific Ocean reveal that the siliciclastic fraction of these sediments similarly has a flat WSA-normalized curve [14].
The relationship between the REE composition of sediments and their terrigenous sources is further recorded by the sediments that are accumulating under the strongly negative redox condition of the Black Sea [65]. Two major terrigenous sources of significantly different composition were identified initially by the clay mineralogy of the surface sediments [74]. In the northern region of the basin, the fine fraction of the sediments is dominated by illite. Its distribution identifies its source as largely Eastern Europe, delivered to the basin mostly by the Danube River and rivers along the northern and western margin of the basin. In the southern region, the clay fraction is enriched in montmorillonite (smectite) that is derived largely from Anatolia. The major-element composition of the suspended phases in streams draining the two regions [74,75] further defines differences in the elemental composition of the two source regions.
The REE in surface sediments of the Black Sea [65] support the results of the mineralogy studies. Surface sediments recovered in box cores from the western basin margin have a flat REE curve that is representative of the largely felsic rocks of eastern Europe, whereas surface sediments from the southern basin margin have a light REE depletion that reflects a moderate mafic-rock contribution from the ultramafic rocks of the Pontic Mountains in northern Anatolia. Although the dominant sediment source currently is the river input from eastern Europe [74], the Anatolia source can be appreciated when it is realized that the Pontic Mountains rise sharply from a narrow 5 to 10 km wide coastal plain to an elevation of ca 3950 m. The coastal plain gives way seaward to an equally narrow basin shelf and slope, the latter traversed by numerous submarine canyons that occur along the full extent of the Anatolia slope [76]. This system of canyons likely delivers much of the sediment from the Pontic Mountains to the abyssal plain by by-passing the shelf and slope, possibly more so in the past than presently.
In support of this interpretation, the sediments that accumulated on the abyssal plain during the lacustrine phase of the Black Sea, following the Last Glacial Maximum (LGM) but prior to the invasion of Mediterranean water through the Bosporus 9.3 ka, i.e., when the Black Sea was a lake, exhibit the two different REE curves noted above. Within sediment cores recovered from the abyssal region of the basin, the curves change abruptly every few 10 s of centimeters (Figure 8), or ca 2000 to 3000 yrs [65], from the one type of curve to the other. The shift of the curves reflects a shift in the dominance of the northern and western source versus the southern and eastern source that was likely driven by regional changes of climate since the LGM [77].
4.2.2. Seawater Derived Fractions
Owing to the complexation of the 3+ REE in seawater [11,13] and the oxidation of Ce3+ to the 4+ valence [3,7,8, 78,79], the REE curves of different marine sediment fractions might be expected to reflect the alkalinity and redox potential of the seawater from which they accumulated. Although both features are strongly reflected in several individual components of modern deposits (Figure 9), e.g., phillipsite [14], biogenic carbonate [21] and opal [6], CFA [19,80],and possibly barite [22]; an exact one-to-one relationship with the seawater at the depth of accumulation is unclear. An exception is the pelletal CFA that is currently accumulating on the continental shelf of Peru. Here the apatite has a negative Ce anomaly and heavy REE enrichment that closely approach those of the seawater (Figures 5 and 9) at ca 150 to 300 m [5], the depth of accumulation of the CFA examined. The depth corresponds to the depth of the oxygen minimum zone (OMZ) of the eastern tropical Pacific [81], the lens of water at intermediate depth that is characterized by suboxic respiration, i.e., denitrification (Table 2).
Ferromanganese nodules on the abyssal sea floor (6, 14, and others) and seamount ferromanganese crusts [15- 18,82] are the major exception to this relationship between the REE composition of marine deposits and seawater (Figure 9). They have positive Ce anomalies, similar to the positive Ce anomaly of the suspended Mnoxide phase in the water column (Figure 6(b)) from greater than ca 1000 m depth [9], rather than the negative anomaly of the seawater dissolved load. The relationship of the 3+ valence REE in these deposits with their concentrations in seawater is equally complex, but it is likely determined largely by the partitioning of the REE into  complexes in the dissolved fraction of seawater [16].
5. Ce Oxidation in Ancient Oceans
Wright et al. [83] advanced the hypothesis that the REE
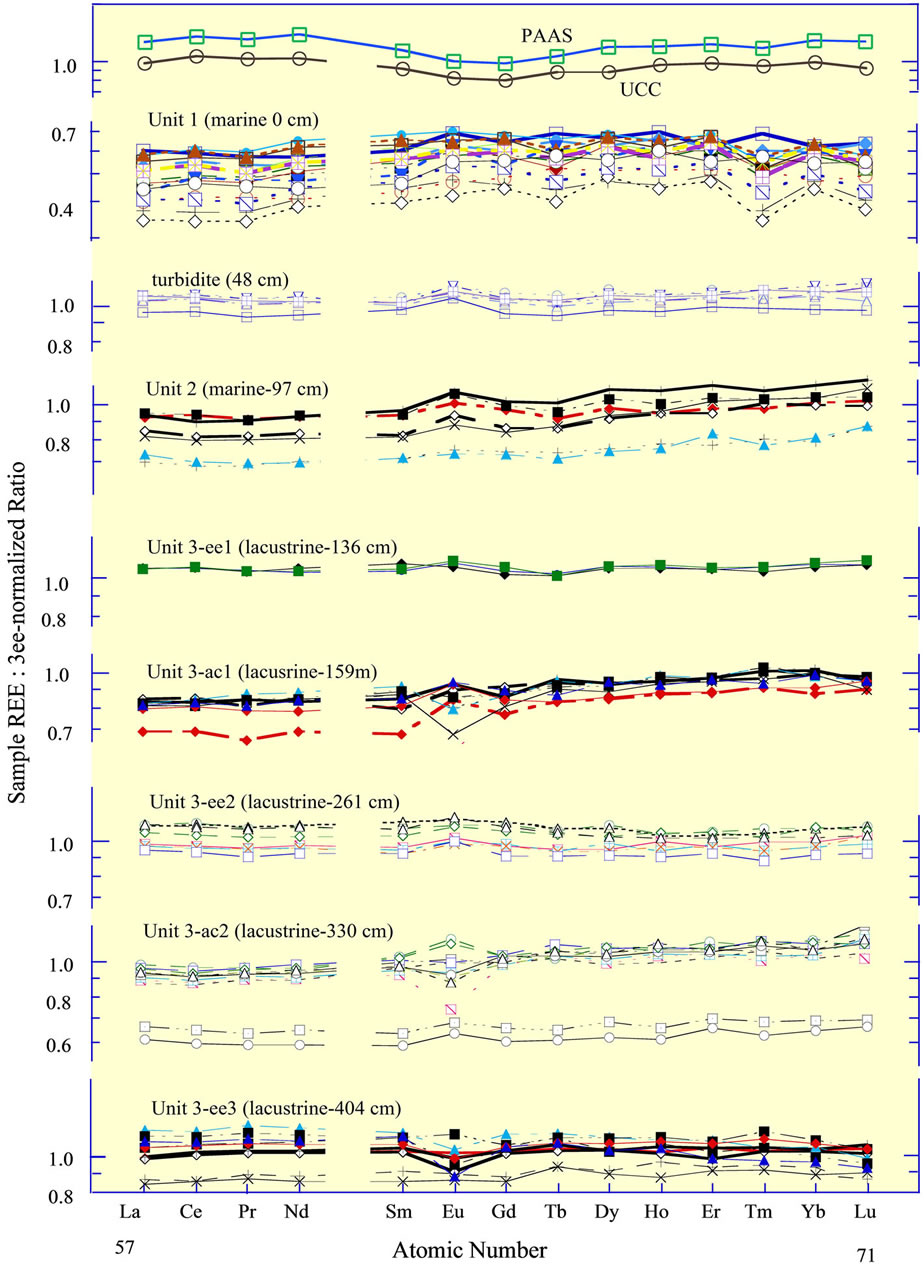
Figure 8. Rare earth elements in a sediment core from the central abyssal plain of the Black Sea [65], normalized to the average of the lacustrine sediments in the three “ee” subunits of Unit 3. The sediment core is divided into two marine units and the one lacustrine unit [76]. Subdivision of Unit 3 into 5 subunits is based on REE curves. The REE in the surface sediments of box cores from the western basin margin identify the “ee” subunits as having a dominantly eastern European source; the sediments of box cores from the southern margin identify the “ac” subunits as having an additional mafic source, the ultramafic rocks of the Pontic Mountains in northern Anatolia. The “ac” subunits exhibit a ca 15% to 20% depletion of the light REE, relative to the heavy REE. The upper boundary of each unit is given in the title; e.g., Unit 1 extends from 0 cm to 48 cm. The turbidite between Units 1 and 2 is present in many cores recovered throughout the basin. Its source was the Crimea slope [65]. The 3ee-normalized curves for the UCC and PAAS (Table 1) are included for reference.
curves of CFA in ancient phosphate deposits, specifically the negative Ce anomaly of biogenous apatite, might have recorded the redox chemistry of ancient oceans. They reasoned that the negativity of the Ce anomaly in seawater during periods of possible global anoxia (e.g., [84-87]) would be less than during times when the ocean was overwhelmingly oxic, as it is currently. Following their success, more recent work has failed to support the earlier findings [88]. Several reasons may account for this apparent failure, which may not necessarily reflect a failure of the original hypothesis. As noted earlier, the Ce anomaly of seawater becomes increasingly more negative from the surface to abyssal depths, with the major exception of its trend in the OMZ of the eastern Pacific Ocean (Figure 5). Further, the Ce anomaly within individual phosphate deposits commonly exhibits a range of values [80,89] that requires the analysis of several samples, particularly samples that are strongly enriched in CFA. Such samples may define the anomaly of CFA alone (Figure 10). And lastly, a diagenetic overprint may largely have altered the REE curve of ancient biogenic CFA following its deposition [90-93]. Thus, several factors complicate the composition of the apatite fraction of ancient deposits [94].
On the positive side, the pelletal CFA fraction of sedimentary deposits may largely retain its REE signature of deposition, similar to the retention of its C and O isotopic signatures [95,96]. Tens of samples of the pelletal CFAenriched units from the Phosphoria Formation of Permian age in southeast Idaho [80] and from the Lisburne Group of Carboniferous age in northern Alaska [97] exhibit Ce anomalies that are significantly more negative (Figures 10 and 11(a)) than the Ce anomalies of the Peru Shelf deposit (Figure 9). They average ca −0.9 in samples from these deposits with greater than 25% apatite. Analyses by us (DZP) of the pelletal CFA-deposit from the Tertiary Miocene Pungo River deposit in the eastern United States [98] and from the Oligocene deposit of Baja California [99] exhibit Ce anomalies that are similar to the Peru Shelf deposit. The anomaly for the Cretaceous deposit in the Paris Basin [89] has a slightly more negative anomaly. All of these deposits likely derived their REE from the seawater at the time of their accumulation.
According to the hypothesis of Wright et al. [83], the Ce anomaly of the Phosphoria Formation and Lisburne Group (Figure 11(a)) recorded an elevated ocean oxic
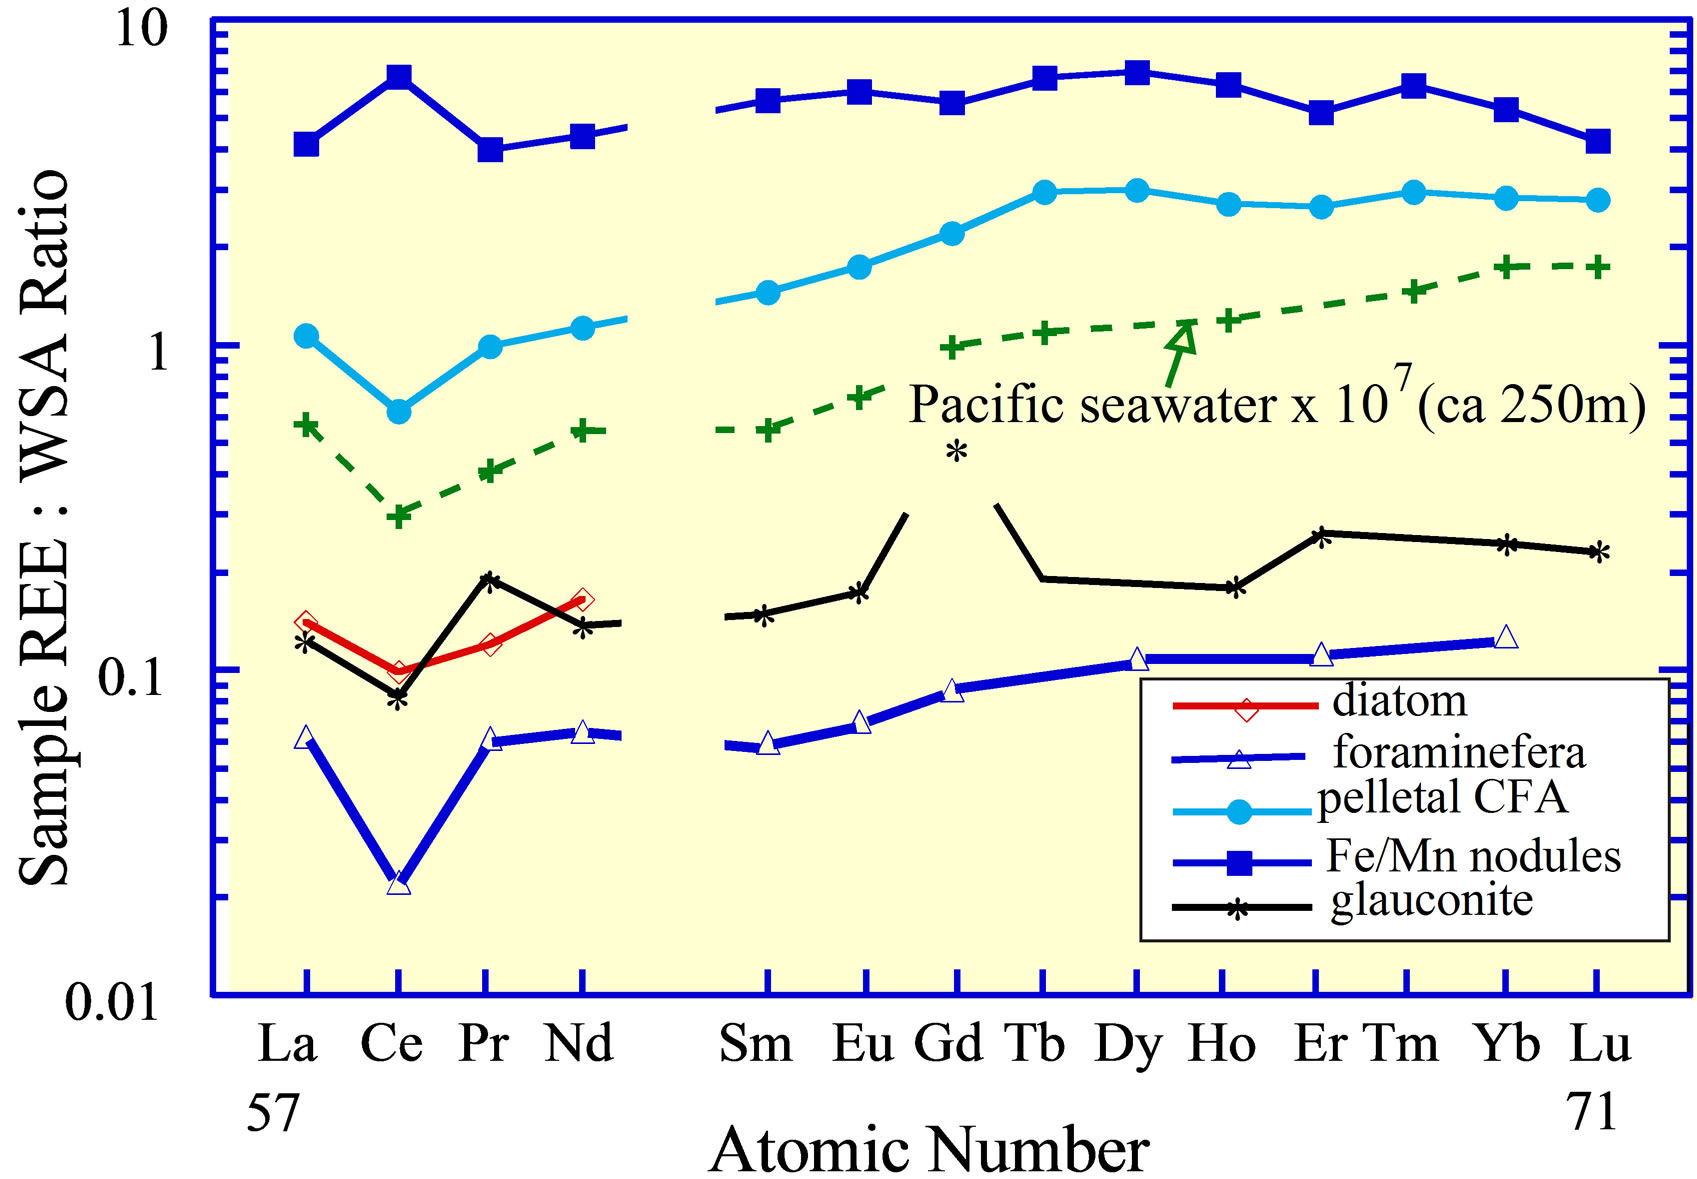
Figure 9. The REE curves of Pacific Ocean abyssal ferromanganese nodules [6,14]; foraminifera [21] and diatoms from the open ocean [6]; pelletal CFA and glauconite from 300 m depth on the Peru Shelf [19], the depth of the core of the OMZ in the eastern Pacific Ocean; and seawater from the OMZ [5]. The Gd value in glauconite may reflect analytical error.

Figure 10. The REE curves of the phosphate deposit at the Enoch Valley Phosphate Mine in southeast Idaho [80]. The curves are separated into four sediment lithologies listed at the far right. Phosphorite has greater than 25% carbonatefluorapatite (CFA); phosphatic shale has 5% to 25% CFA; shale has greater than approximately 60% siliciclastic debris; limestone/chert has greater than 75% calcite + dolomite + chert.
event in the late Paleozoic era. Indeed, Berner [100] advanced an O2 model for the atmosphere during the Phanerozoic eon (Figure 11(b)) that identified a significantly elevated O2 concentration in the late Paleozoic, owing possibly to the evolution of large vascular land plants. In his model, O2 decreased sharply at the end of the Paleozoic and then gradually increased to reach its present value approximately 5.0 × 10⁷ yrs ago. The Ce anomaly of pelletal CFA deposits during the late Paleozoic, Cretaceous, and Tertiary times conforms reasonably well to the O2 atmospheric model. The deposit in the Fernie Formation, Canada, of Jurassic Age [101] clearly does not fit the atmospheric O2 trend. Unfortunately, the texture for this deposit is poorly documented. Although the relationship between the Ce anomaly of the few Phanerozoic pelletal CFA deposits that have been examined in detail and the level of atmospheric O2 during this geologic inteval is promising, confirmation of this relationship must await the analysis of additional carefully documented pelletal CFA deposits throughout Phanerozoic time.
6. REE in Wine
Bentlin et al. [25] analyzed four varietal wines of South America, each of which has a unique REE curve (Figure 12). Each curve possibly represents the curve of the soil on which the grapes were grown and the source rock of

Figure 11. (a) The Ce anomaly of pelletal phosphate deposits versus geologic age (see text for references). The anomaly is defined as , for which the nsub-script is the WSA-normalized value; (b) Atmospheric O2 concentration during the Phanerozoic [100]. The symbols along the x-axis of each frame identify the geologic periods (e.g., C = Carboniferous).
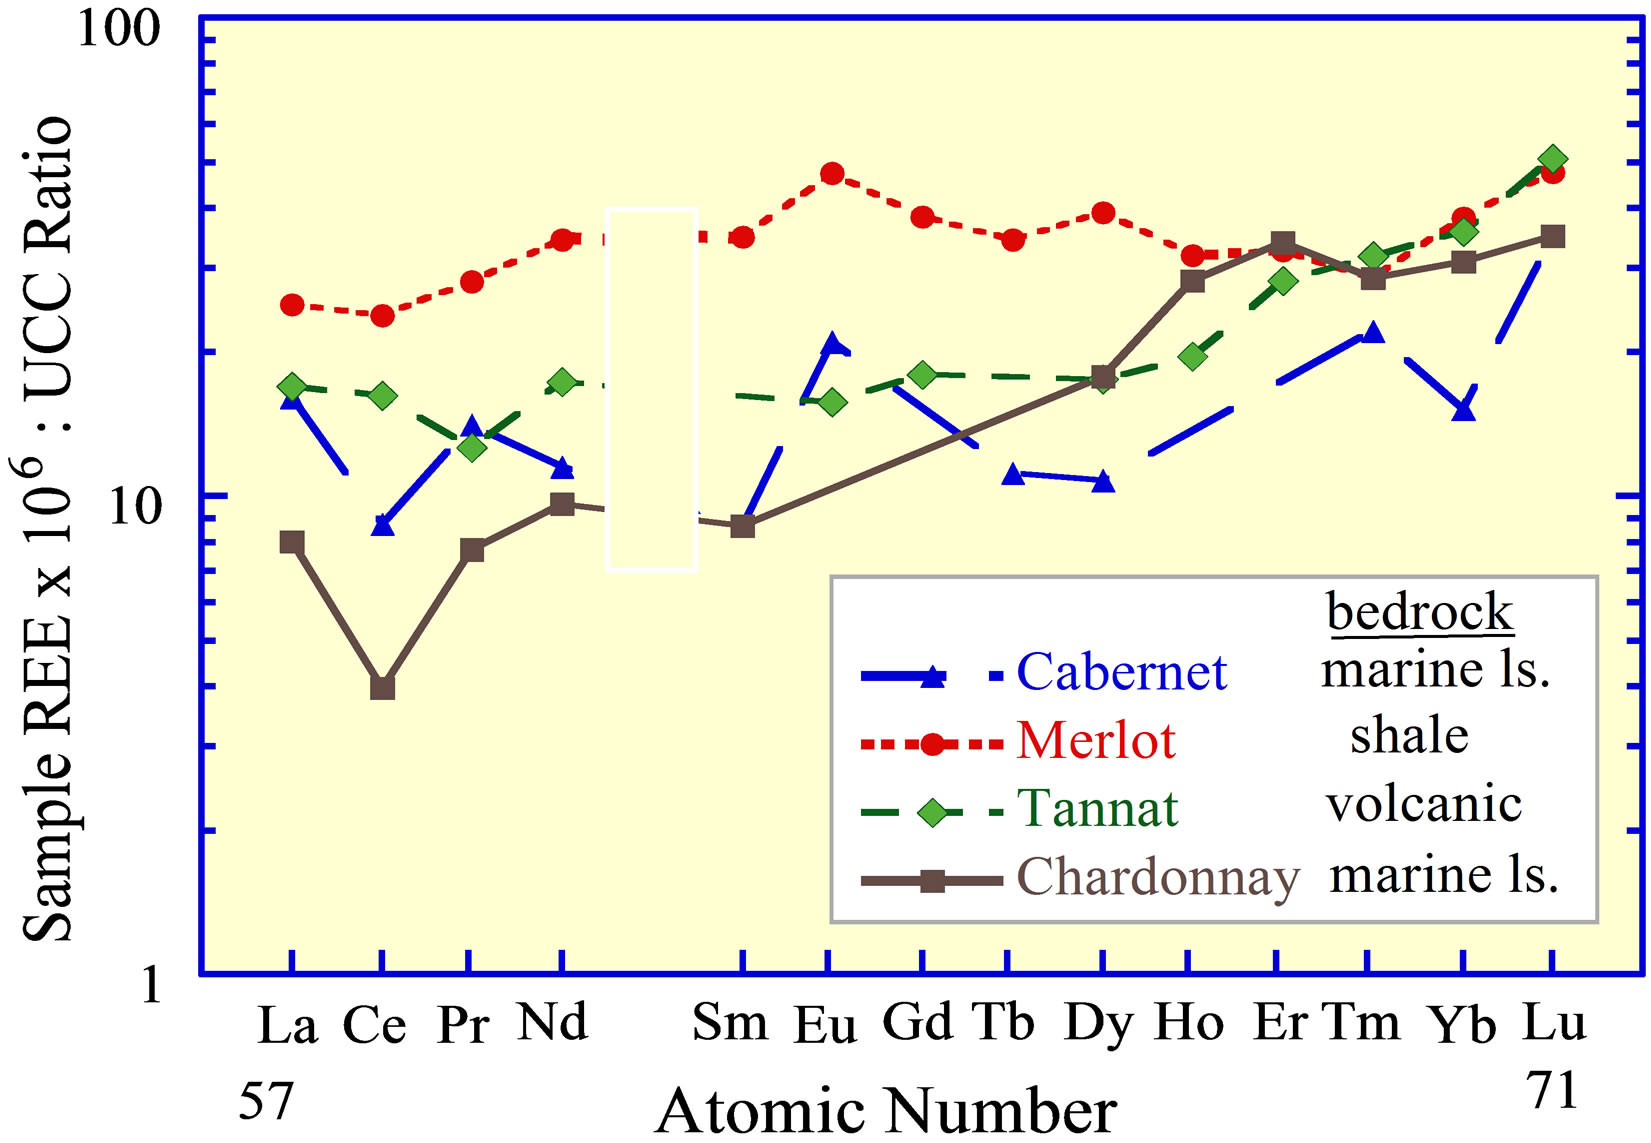
Figure 12. The REE curves of wine from South America [25]. The designation of the curves is based on the similatity to known REE curves of rock lithologies, not on the curves of the soils and bedrocks on which the grapes may actually have been grown.
that soil. The curves suggest that any chemical weathering that contributed to soil formation fractionated insignificantly Ce from the 3+ valence REE, i.e., between rock, ground water and soil. This would support the interpretation of limited fractionation of the REE within terrigenous siliciclastic debris, as suggested by its composition in the suspended fraction of the world’s major rivers, but is at odds with the composition of the dissolved load of rivers.
As a possible alternative, the REE may have been acquired during the filtration and storage of the wines [102]. Which of these sources might determine the REE content of a wine should be easily determined by analyzing the soil and ground water on which the grapes were grown versus the various materials used in the production of the wine and possible changes to its composition during storage. If these curves do indeed reflect those of the soils, then an analysis of them should provide added evidence of the usefulness of the REE in identifying provenance.
7. Conclusions
1) The REE are a strongly coherent group of elements, whose concentrations in rocks, soils, surface waters, and sedimentary deposits conform to the Oddo-Harkins Rule, whereby even-numbered elements are more abundant than their immediate odd-numbered neighbors. The herringbone curve of their measured concentrations, when plotted against their atomic number, is converted to a smooth curve by normalizing the REE on an element-byelement basis to one of several rock standards. The standard used is unimportant except that its interelement REE concentrations should be similar to those of the samples being examined.
2) The REE in the suspended phases of seawater are partitioned into 1) a siliciclastic fraction of terrigenous origin that has a normalized REE curve similar to the curve of the average of the continental curst and 2) a seawater-derived metal oxide fraction. The REE curve of the metal-oxide fraction exhibits a negative anomaly in the surface water that becomes positive below a few meters depth. The dissolved REE fraction of seawater, in general, exhibits a negative anomaly in surface seawater that increases in its negativity with ocean depth. The dissolved fraction also exhibits an enrichment of the heavy REE relative to the light REE. It too increases with depth.
3) The REE that accumulate on the seafloor are partitioned into spatially varying amounts of a terrestrialderived lithogenous fraction, a biogenous fraction composed largely of the tests of plankton, carbonate-fluorapatite (CFA), montmorillonite (smectite), the zeolite phillipsite, glauconite, and an amorphous Fe and Mn oxihydride fraction. The lithgenous fraction has a REE curve similar to that of the terrigenous-derived fraction in the suspended load of seawater, whereas the seawaterderived fractions have one of two curves. The curve of ferromanganese oxides, in the form of abyssal nodules and seamount crusts, is characterized by a strongly positive Ce anomaly that is similar to the curve of the aceticacid-soluble suspended phase of the water column at depths greater than several meters. By contrast, the curves for pelletal CFA and glauconite, whose accumulation is limited largely to the continental shelf and slope under seawater conditions of suboxic bacterial respiration, duplicate the curve of the immediately overlying seawater. The biogenous fraction also exhibits a negative Ce.
4) The strongly similar REE curve of the pelletal CFA that is currently accumulating on the Peru Shelf and the curve of the overlying seawater suggests that the curve of ancient pelletal CFA deposits may parallel the curve of seawater at their time and location of accumulation. As the carbon and oxygen isotopic signals of these deposits are largely retained during burial, so might also their REE curve. In support of this interpretation, pelletal CFA deposits that accumulated in Late Paleozoic time, during an interval of earth’s history of elevated atmospheric O2, have the strongest negative Ce anomaly of deposits analyzed. Pelletal CFA deposits of Tertiary age from several parts of the world exhibit REE curves that closely resemble the curve of the Peru Shelf deposit. They accumulated when the atmospheric O2 concentration was similar to its current concentration. Thus, the REE curves of pelletal CFA deposits from the other geologic periods may also have recorded the redox conditions of ancient atmospheres and oceans.
5) Several varietal wines from South America have REE curves that parallel those of different rock lithologies. It is possible that the relative concentrations of the REE are inherited from the soil and/or ground water whose REE curves are determined by the bedrock on which the vines are grown. These similarities are another example that demonstrates the contribution REE can make in unraveling the geochemistry of both terrestrial and marine environments.
REFERENCES
- J. S. Goldstein and S. B. Jacobsen, “Rare Earth Elements in Rivers,” Earth and Planetary Science Letters, Vol. 89, No. 1, 1988, pp. 35-47. http://dx.doi.org/10.1016/0012-821X(88)90031-3
- H. Elderfield, R. Upstill-Goddard and E. R. Sholkovitz, “The Rare Earth Elements in Rivers, Estuaries, and Coastal Seas and Their Significance to the Composition of Ocean Waters,” Geochimica et Cosmochimica Acta, Vol. 54, No. 4, 1990, pp. 971-991. http://dx.doi.org/10.1016/0016-7037(90)90432-K
- E. R. Sholkovitz, “The Aquatic Chemistry of Rare Earth Elements in Rivers and Estuaries,” Aquatic Chemistry, Vol. 1, No. 1, 1995, pp. 1-34.
- E. D. Goldberg, “Mineralogy and Chemistry of Marine Sedimentation,” In: F. P. Shepard, Ed., Marine Geology, Harper and Row, New York, 1963, pp. 436-466.
- D. J. W. DeBaar, M. P. Bacon, P. G. Brewer and K. W. Bruland, “Rare Earth Elements in the Pacific and Atlantic Oceans,” Geochimica et Cosmochimica Acta, Vol. 49, No. 9, 1985, pp. 1943-1959. http://dx.doi.org/10.1016/0016-7037(85)90089-4
- H. Elderfield, C. J. Hawkesworth, M. J. Greaves and S. E. Calvert, “Rare Earth Element Geochemistry of Oceanic Ferromanganese Nodules and Associated Sediments,” Geochimica et Cosmochimica Acta, Vol. 45, No. 4, 1981, pp. 513-528. http://dx.doi.org/10.1016/0016-7037(81)90184-8
- E. R. Sholkovitz and D. L. Schneider, “Cerium Redox Cycles and Rare Earth Elements in the Sargasso Sea,” Geochimica et Cosmochimica Acta, Vol. 55, No. 10, 1991, pp. 2737-2743. http://dx.doi.org/10.1016/0016-7037(91)90440-G
- D. J. Piepgras and S. B. Jacobsen, “The Behavior of Rare Earth Elements in Seawater: Precise Determination of Variations in the North Pacific Water Column,” Geochimica et Cosmochimica Acta, Vol. 56, No. 5, 1992, pp. 1851-1862.
- S. R. Sholkovitz, W. M. Landing and B. L. Lewis, “Ocean Particle Chemistry: The Fractionation of Rare Earth Elements between Suspended Particles and Seawater,” Geochimica et Cosmochimica Acta, Vol. 58, No. 6, 1994, pp. 1567-1580. http://dx.doi.org/10.1016/0016-7037(94)90559-2
- J. H. Lee and R. H. Byrne, “Complexation of Trivalent Rare Earth Elements (Ce, Eu, Gd, Tb, Yb) by Carbonate,” Geochimica et Cosmochimica Acta, Vol. 57, No. 2, 1993, pp. 295-302.
- R. H. Byrne, “Inorganic Speciation of Dissolved Elements in Seawater,” Geochemical Transactions, Vol. 3, No. 2, 2002, pp. 11-16. http://dx.doi.org/10.1186/1467-4866-3-11
- Y. R. Luo and R. H. Byrne, “Carbonate Complexation of Yttrium and the Rare Earth Elements in Natural Waters,” Geochimica et Cosmochimica Acta, Vol. 68, No. 4, 2004, pp. 691-699. http://dx.doi.org/10.1016/S0016-7037(03)00495-2
- R. H. Byrne and K. H. Kim, “Rare-Earth Element Scavenging in Seawater,” Geochimica et Cosmochimica Acta, Vol. 54, No. 10, 1990, pp. 2645-2656. http://dx.doi.org/10.1016/0016-7037(90)90002-3
- D. Z. Piper, “The Metal Oxide Fraction of Pelagic Sediment in the Equatorial North Pacific Ocean: A Source of Metals in Ferromanganese Nodules,” Geochimica et Cosmochimica Acta, Vol. 52, No. 8, 1988, pp. 2127-2145. http://dx.doi.org/10.1016/0016-7037(88)90193-7
- P. Halbach and D. Puteanus, “The Influence of the Carbonate Dissolution Rate on the Growth and Composition of Co-Rich Ferromanganese Crusts from Central Pacific Seamount Areas,” Earth and Planetary Science Letters, Vol. 68, No. 1, 1984, pp. 73-87. http://dx.doi.org/10.1016/0012-821X(84)90141-9
- M. Bau, A. Koschinsky, P. Dulski and J. R. Hein, “Comparison of the Partitioning Behaviors of Yttrium, RareEarth Elements, and Titanium between Hydrogenetic Marine Ferromanganese Crusts and Seawater,” Geochimica et Cosmochimica Acta, Vol. 60, No. 10, 1996, pp. 1709- 1725. http://dx.doi.org/10.1016/0016-7037(96)00063-4
- J. R. Hein, A. Koschinsky, P. Halbach, F. T. Manheim, M. Bau, J. K. Kang and N. Lubick, “Iron and Manganese Oxide Mineralizations in the Pacific,” Geological Society, London, Special Publication, Vol. 119, No. 1, 1997, pp. 123-138.
- M. Bau and A. Koschinsky, “Hafnium and Neodymium Isotopes in Seawater and Ferromanganese Crusts: The Element Perspective,” Earth and Planetary Science Letters, Vol. 241, No. 3-4, 2006, pp. 952-961. http://dx.doi.org/10.1016/j.epsl.2005.09.067
- D. Z. Piper, P. A. Baedecker, J. G. Crock, W. C. Burnett and B. L. Loebner, “Rare Earth Elements in the Phosphatic-Enriched Sediments of the Peru Shelf,” Marine Geology, Vol. 80, No. 3-4, 1988, pp. 269-285. http://dx.doi.org/10.1016/0025-3227(88)90093-X
- D. Z. Piper, “Rare-Earth Elements in the Sedimentary Cycle: A Summary,” Chemical Geology, Vol. 14, No. 4, 1974, pp. 285-304. http://dx.doi.org/10.1016/0009-2541(74)90066-7
- P. A. Palmer, “Rare Earth Elements in Foraminifera Tests,” Earth and Planetary Science Letters, Vol. 73, No. 2-4, 1985, pp. 285-298.
- F. Guichard, T. M. Church, M. Treull and H. Jaffrezic, “Rare Earth Elements in Barites: Distribution and Effects on Aqueous Partitioning,” Geochimica et Cosmochimica Acta, Vol. 43, No. 7, 1979, pp. 983-997. http://dx.doi.org/10.1016/0016-7037(79)90088-7
- L. Haskin and M. A. Gehl, “The Rare-Earth Distribution in Sediments,” Journal of Geophysical Research, Vol. 67, No. 6, 1962, pp. 2537-2541. http://dx.doi.org/10.1029/JZ067i006p02537
- Ø. Y. Høgdahl, B. T. Bowen and S. Melson, “Neutron Activation Analysis of Lanthanide Elements in Seawater,” Advances in Chemistry Series, Vol. 73, 1968, pp. 308-325. http://dx.doi.org/10.1021/ba-1968-0073.ch019
- F. R. S. Bentlin, C. M. M. dos Santos, E. M. M. Flores and D. Pozebon, “Lanthanides Determination in Red Wine Using Ultrasound Assisted Extraction, Flow Injection, Aerosol Disolvation and ICP-MS,” Analytica Chimica Acta, Vol. 710, 2012, pp. 33-39. http://dx.doi.org/10.1016/j.aca.2011.10.039
- R. A. Schmidt, R. H. Smith, J. E. Lasch, A. W. Mosen, D. A. Olehy and J. Vasilevshis, “Abundances of Fourteen Rare-Earth Elements, Scandium, and Yttrium in Meteoritic and Terrigenous Matter,” Geochimica et Cosmochimica Acta, Vol. 27, No. 6, 1963, pp. 577-622. http://dx.doi.org/10.1016/0016-7037(63)90014-0
- T. R. Wildman and L. Haskin, “Rare-Earth Elements in Ocean Sediments,” Journal of Geophysical Research, Vol. 70, No. 12, 1965, pp. 2905-2911. http://dx.doi.org/10.1029/JZ070i012p02905
- B. Mason, “Principals of Geochemistry,” John Wiley and Sons, New York, 1966.
- M. A. Haskin and L. Haskin, “Rare Earth Elements in European Shales, a Redetermination,” Science, Vol. 154, No. 3748, 1964, pp. 507-509.
- W. E. Wedepohl, “The Composition of the Continental Crust,” Geochimica et Cosmochimica Acta, Vol. 59, No. 7, 1995, pp. 1217-1232. http://dx.doi.org/10.1016/0016-7037(95)00038-2
- P. L. Gromet, P. F. Dymek, L. A. Haskin and R. L. Korotev, “The North American Shale Composite: Its Composition, Major and Minor Element Characteristics,” Geochimica et Cosmochimica Acta, Vol. 48, No. 12, 1984, pp. 2469-2482. http://dx.doi.org/10.1016/0016-7037(84)90298-9
- K. H. Wedepohl, “Handbook of Geochemistry, Volume I-IV,” Springer-Verlag, Berlin, 1969-1978.
- R. L. Rudnick and S. Gao, “Composition of the Continental Crust,” In: H. D. Holland and K. K. Turekian, Eds., Treatise on Geochemistry, Elsevier, New York, 2003, pp. 1-64. http://dx.doi.org/10.1016/B0-08-043751-6/03016-4
- S. M. McLennan, “Rare Earth Elements in Sedimentary Rocks: Influence of Provenance and Sedimentary Processes,” Reviews in Mineralogy and Geochemistry, Vol. 21, No. 1, 1989, pp. 169-200.
- S. M. McLennan, “Relationships between the Trace Element Composition of Sedimentary Rocks and Upper Continental Crust,” Geochemistry Geophysics Geosystems, Vol. 2, No. 4, 2001, pp. 1-24. http://dx.doi.org/10.1029/2000GC000109
- Ø. Høgdahl, “Distribution of Rare Earth Elements in Seawater,” NATO Research Grant 203, Semiannual, Progress Report No. 2-6, 1965-1967.
- J. Gaillardet, J. Viers and B. Dupré, “Trace Elements in River Waters,” In: J. I. Drever, Ed., Treatise on Geochemistry, Surface and Groundwater, Weathering and Soils, Elsevier, Amsterdam, 2003, pp. 225-272.
- D. Z. Piper, S. Ludington, D. S. Duval and H. E. Taylor, “Geochemistry of Bed and Suspended Sediment in the Mississippi River System: Provenance Versus Weathering and Winnowing,” Science of the Total Environment, Vol. 362, No. 1-3, 2005, pp. 179-204. http://dx.doi.org/10.1016/j.scitotenv.2005.05.041
- C. R. German and H. Elderfield, “Rare Earth Elements in the NW Indian Ocean,” Geochimica et Cosmochimica Acta, Vol. 54, No. 7, 1990, pp. 1029-1040.
- H. Elderfield and M. J. Greaves, “The Rare Earth Elements in Seawater,” Nature, Vol. 296, No. 5854, 1982, pp. 214-219. http://dx.doi.org/10.1038/296214a0
- H. U. Sverdrup, M. W. Johnson and R. H. Fleming, “The Oceans—Their Physics, Chemistry, and General Biology,” Prentice-Hall, Upper Saddle River, 1942.
- K. W. Bruland, “Trace Elements in Seawater,” In: J. P. Riley and R. Chester, Eds., Chemical Oceanography, Academic Press, London, 1983, pp. 158-220.
- W. M. Latimer, “Oxidation Potentials,” Prentice Hall, New York, 1953.
- D. D. Wagman, W. H. Evans, V. B. Parker, R. H. Schumm, I. Halow, S. M. Bailey, K. L. Churney and R. L. Nutall, “The NBS Tables of Chemical Thermodynamic Properties: Reference Data,” Journal of Physical Chemistry, Vol. 11, Supplement 2, 1982.
- W. M. Landing and K. W. Bruland, “The Biochemistry of Iron and Manganese in the Pacific Ocean,” Geochimica et Cosmochimica Acta, Vol. 51, No. 1, 1987, pp. 29-43. http://dx.doi.org/10.1016/0016-7037(87)90004-4
- W. S. Broecker and T. H. Peng, “Tracers in the Sea,” Eldigio Press, Palisades, New York, 1982.
- J. W. Murray, B. Spell and B. Paul, “The Contrasting Geochemistry of Manganese and Chromium in the Eastern Tropical Pacific Ocean,” In: C. S. Wong, E. Boyle, K. W. Bruland, J. D. Burton and E. D. Goldberg, Eds., Trace Metals in Seawater, Plenum, New York, 1983, pp. 643- 669. http://dx.doi.org/10.1007/978-1-4757-6864-0_37
- H. Elderfield, “Chromium Speciation in Seawater,” Earth and Planetary Science Letters, Vol. 9, No. 1, 1970, pp. 10-16. http://dx.doi.org/10.1016/0012-821X(70)90017-8
- C. I. Measures, R. E. McDuff and J. M. Edmond, “Selenium Redox Chemistry at GEOSECS I Reoccupation,” Earth and Planetary Science Letters, Vol. 49, No. 1, 1980, pp. 102-108.
- G. A. Cutter and K. W. Bruland, “The Marine Biogeochemistry of Se: A Reevaluation,” Limnology and Oceanography, Vol. 29, No. 6, 1984, pp. 1179-1192. http://dx.doi.org/10.4319/lo.1984.29.6.1179
- D. Langmuir, “Uranium Solution-Mineral Equilibria at Low Temperatures with Applications to Sedimentary Ore Deposits,” Geochimica et Cosmochimica Acta, Vol. 42, No. 6, 1978, pp. 547-569. http://dx.doi.org/10.1016/0016-7037(78)90001-7
- R. W. Collier, “Particulate and Dissolved Vanadium in the North Pacific Ocean,” Nature, Vol. 309, No. 5967, 1984, pp. 441-444. http://dx.doi.org/10.1038/309441a0
- L. Jacobs, S. R. Emerson and J. Skei, “Partitioning and Transport of Metals across the O2/H2S Interface in a Permanently Anoxic Basin, Framvaren Fjord, Norway,” Geochimica et Cosmochimica Acta, Vol. 49, No. 6, 1985, pp. 1433-1444. http://dx.doi.org/10.1016/0016-7037(85)90293-5
- E. A. Boyle, F. R. Sclater and J. M. Edmond, “On the Marine Geochemistry of Cadmium,” Nature, Vol. 263, No. 5572, 1976, pp. 42-44. http://dx.doi.org/10.1038/263042a0
- R. W. Collier, “Molybdenum in the Northeast Pacific Ocean,” Limnology and Oceanography, Vol. 30, No. 6, 1985, pp. 1351-1354. http://dx.doi.org/10.4319/lo.1985.30.6.1351
- S. R. Emerson and S. S. Huested, “Ocean Anoxia and the Concentrations of Molybdenum and Vanadium in Seawater,” Marine Chemistry, Vol. 34, No. 3-4, 1991, pp. 177-196. http://dx.doi.org/10.1016/0304-4203(91)90002-E
- Y. Nozaki, “Rare Earth Elements and Their Isotopes in the Ocean,” Encyclopedia of Ocean Science, Academic Press, 2001, pp. 2354-2366. http://dx.doi.org/10.1006/rwos.2001.0284
- J. W. Moffett, “Micobially Mediated Cerium Oxidation in Seawater,” Nature, Vol. 345, No. 6274, 1990, pp. 421- 423. http://dx.doi.org/10.1038/345421a0
- S. R. Taylor, S. M. McLennan and M. T. McCulloch, “Geochemistry of Loess, Continental Crustal Composition and Crustal Model Ages,” Geochimica et Cosmochimica Acta, Vol. 47, No. 11, 1983, pp. 1897-1905. http://dx.doi.org/10.1016/0016-7037(83)90206-5
- [61] L. L. Feng, Z. G. Hu, J. T. Ju and L. P. Zhu, “Variations in Trace Elements (Including Rare Earth Elements) Concentrations with Grain Sizes in Loess and Their Implications for Tracing the Provenance of Eolian Deposits,” Quaternary International, Vol. 236, No. 1-2, 2011, pp. 116-126. http://dx.doi.org/10.1016/j.quaint.2010.04.024
- [62] L. Moa, D. Mo, M. Li, K. Zhou, J. Yang and W. Guo, “The Rare Earth Element Composition of Sediments from the Loess Tableland in the Liyang Plain, Southern China: Implications for Provenance and Weathering Intensity,” Environmental Earth Science, Vol. 62, No. 8, 2011, pp. 1609-1617. http://dx.doi.org/10.1007/s12665-010-0644-x
- [63] M. Ferrat, D. J. Weiss, et al., “Improved Provenance Tracing of Asian Dust Sources Using Rare Earth Elements and Selected Trace Elements for Palaeomonsoon Studies on the Eastern Tibetan Plateau,” Geochimica et Cosmochimica Acta, Vol. 75, No. 21, 2011, pp. 6374- 6399. http://dx.doi.org/10.1016/j.gca.2011.08.025
- [64] V. M. Goldschmidt, “Geochemistry,” Oxford University Press, Oxford, 1954.
- [65] S. E. Calvert and T. F. Pedersen, “Elemental Proxies for Palaeoclimatic and Palaeoceanographic Variability in Marine Sediments: Interpretation and Application,” In: C. Hillaire-Marcel and A. de Vernal, Eds., Paleoceanography of the Late Cenozoic, Part 1, Methods, Elsevier, New York, 2007, pp. 567-644. http://dx.doi.org/10.1016/S1572-5480(07)01019-6
- [66] D. Z. Piper and S. E. Calvert, “Holocene and Late Glacial Palaeoceanography and Palaeolimnology of the Black Sea: Changing Provenance and Basin Hydrography over the Past 25,000 Years,” Geochimica et Cosmochimica Acta, Vol. 75, No. 19, 2011, pp. 5597-5624. http://dx.doi.org/10.1016/j.gca.2011.07.016
- [67] W. M. Landing and B. L. Lewis, “Thermodynamic Modeling of Trace Metal Speciation in the Black Sea,” In: J. W. Murray and E. Izdar, Eds., Black Sea Oceanography, Kluwer, Dordrecht, 1991, pp. 125-160.
- [68] H. J. W. DeBaar, C. R. German, H. Elderfield and P. van Gaans, “Rare Earth Element Distributions in Anoxic Waters of the Cariaco Trench,” Geochimica et Cosmochimica Acta, Vol. 52, No. 5, 1988, pp. 1203-1219. http://dx.doi.org/10.1016/0016-7037(88)90275-X
- [69] J. Schijf, H. J. W. DeBaar, J. R. Wijbrands and W. M. Landing, “Dissolved Rare Earth Elements in the Black Sea,” Deep-Sea Research, Vol. 38, Supplement 2, 1991, pp. S805-S823.
- [70] C. R. German, B. P. Holliday and H. Elderfield, “Redox Cycling of Rare Earth Elements in the Suboxic Zone of the Black Sea,” Geochimica et Cosmochimica Acta, Vol. 55, No. 12, 1991, pp. 3553-3558. http://dx.doi.org/10.1016/0016-7037(91)90055-A
- [71] R. L. Cullers, “The Chemical Signature of Source Rocks in Size Fractions of Holocene Stream Sediment Derived from Metamorphic Rocks in the Wet Mountains Region, USA,” Chemical Geology, Vol. 113, No. 3-4, 1988, pp. 327-343. http://dx.doi.org/10.1016/0009-2541(94)90074-4
- [72] R. L. Cullers and V. N. Podkovyrov, “Geochemistry of the Mesoproterozoic Lakhanda Shales in Southeastern Yakutia, Russia: Implications for Mineralogical and Provenance Control Recycling,” Pre-Cambrian Research, Vol. 104, No. 1-2, 2000, pp. 77-93. http://dx.doi.org/10.1016/S0301-9268(00)00090-5
- [73] B. Yan, W. Yan, L. Miao, L. Huang and Z. Chen, “Geochemical Characteristics and Provenance Implications of Rare Earth Elements in Surface Sediments from Bays along Guangdong Coast, Southeast China,” Environmental Earth Science, Vol. 65, 2010, pp. 2195-2205.
- [74] F. Xu, A. Li, T. Li, K. Xu, S. Chen, L. Qiu and Y. Cao, “Rare Earth Element Geochemistry in the Inner Shelf of the East China Sea and Its Implication for Sediment Provenances,” Journal of the Rare Earths, Vol. 29, No. 7, 2011, pp. 702-709. http://dx.doi.org/10.1016/S1002-0721(10)60526-1
- [75] G. Müller and P. Stoffers, “Mineralogy and Petrology of Black Sea Basin Sediments,” In: E. T. Degens and R. A. Ross, Eds., The Black Sea—Geology, Chemistry and Biology, American Association of Petroleum Geologists: Memoir, American Association of Petroleum Geologists, Tulsa, 1974, pp. 200-248.
- [76] O. Yigiterhan and J. W. Murray, “Trace Metal Composition of Particulate Matter of the Danube River and Turkish Rivers Draining into the Black Sea,” Marine Chemistry, Vol. 111, No. 1-2, 2008, pp. 63-76. http://dx.doi.org/10.1016/j.marchem.2007.06.019
- [77] E. T. Degens and D. A. Ross, “The Black Sea—Geology, Chemistry and Biology,” In: E. T. Degens and D. A. Ross, Eds., American Association of Petroleum Geologists: Memoir, American Association of Petroleum Geologists, Tulsa, 1974, 633 p.
- [78] O. Kwiecien, H. W. Arz, F. Lamy, B. Plessen, A. Bahr and G. H. Haug, “North Atlantic Control on Precipitation Curves in the Eastern Mediterranean/Black Sea Region during the Last Glacial,” Quaternary Research, Vol. 71, No. 3, 2009, pp. 375-384. http://dx.doi.org/10.1016/j.yqres.2008.12.004
- [79] E. D. Goldberg, M. Koide, R. A. Schmitt and R. M. Smith, “Rare Earth Distributions in the Marine Environment,” Journal of Geophysical Research, Vol. 68, No. 14, 1963, pp. 4209-4217. http://dx.doi.org/10.1029/JZ068i014p04209
- [80] H. Elderfield, “The Oceanic Chemistry of the Rare-Earth Elements,” Philosophical Transaction of the Royal Society of London, A, Vol. 325, No. 1583, 1988, pp. 105-126. http://dx.doi.org/10.1098/rsta.1988.0046
- [81] D. Z. Piper, “Marine Chemistry of the Permian Phosphoria Formation and Basin, Southeast Idaho,” Economic Geology, Vol. 96, No. 3, 2001, pp. 599-620. http://dx.doi.org/10.2113/gsecongeo.96.3.599
- [82] F. A. Richards, “Coastal Upwelling,” In: F. A. Richards, Ed., Coastal Estuarine Science, American Geophysical Union, Washington DC, Vol. 1, 1981. http://dx.doi.org/10.1029/CO001
- [83] J. R. Hein, C. L. Fleishman, L. A. Morgenson, S. H. Bloomer and R. A. Stern, “Submarine Ferromanganese Deposits from the Mariana and Volcano Volcanic Arcs, West Pacific,” US Geological Survey Open File Report 87-281, 1987.
- [84] J. Wright, H. Schrader and W. T. Holser, “Paleoredox and Variations in Ancient Oceans Recorded by Rare Earth Elements in Fossil Apatite,” Geochimica et Cosmochimica Acta, Vol. 51, No. 3, 1987, pp. 631-644. http://dx.doi.org/10.1016/0016-7037(87)90075-5
- [85] G. J. Demaison and G. T. Moore, “Anoxic Environments and Oil Source Bed Genesis,” American Association of Petroleum Geologists Bulletin, Vol. 64, No. 8, 1980, pp. 1179-1209.
- [86] T. Hallam, “Catastrophes and Lesser Calamities: The Causes of Mass Extinctions,” Oxford University Press, Oxford, 2004.
- [87] K. M. Meyer and L. R. Kump, “Oceanic Euxinia in Earth History: Causes and Consequences,” Annual Reviews of Earth and Planetary Science Letters, Vol. 36, No. 1, 2008, pp. 251-288. http://dx.doi.org/10.1146/annurev.earth.36.031207.124256
- [88] H. Jenkyns, “Geochemistry of Ocean Anoxic Events,” Geochemistry Geophysics Geosystems, Vol. 11, No. 3, 2010, pp. 1-30. http://dx.doi.org/10.1029/2009GC002788
- [89] W. T. Holser, “Evaluation of the Application of RareEarth Elements to Paleoceanography,” Paleoceanography, Vol. 132, 1997, pp. 309-323.
- [90] I. Jarvis, “Rare Earth Element Geochemistry of Late Cretaceous Chalks and Phosphorites from Northern France,” Geological Survey of India Special Publication, Vol. 17, 1984, pp. 179-190.
- [91] H. Elderfield and R. Pagett, “Rare Earth Elements in Ichthyoliths: Variations with Redox Conditions and Depositional Environments,” Science of the Total Environment, Vol. 49, 1986, pp. 175-197. http://dx.doi.org/10.1016/0048-9697(86)90239-1
- [92] P. Grandjean-Lécuyer, R. Feist and F. Albaréde, “Rare Earth Elements in Old Biogenic Apatite,” Geochimica et Cosmochimica Acta, Vol. 57, No. 11, 1993, pp. 2507- 2514. http://dx.doi.org/10.1016/0016-7037(93)90413-Q
- [93] G. Shields and P. Webb, “Diagenetic Constraints on the Use of Cerium Anomalies as Palaeoseawater Redox Proxies: An Isotopic and REE Study of Cambrian Phosphorites,” Chemical Geology, Vol. 175, No. 1-2, 2001, pp. 29-48. http://dx.doi.org/10.1016/S0009-2541(00)00362-4
- [94] L. Kocsis, C. N. Treuman and M. R. Palmer, “Protracted Diagenetic Alteration of REE Contents in Fossil Bioapatites: Direct Evidence from Lu-Hf Isotope Systematics,” Geochimica et Cosmochimica Acta, Vol. 74, No. 21, 2010, pp. 6077-6092. http://dx.doi.org/10.1016/j.gca.2010.08.007
- [95] C. R. German and H. Elderfield, “Application of the Ce Anomaly as a PaleoredoxIndicatior: The Ground Rules,” Paleoceanography, Vol. 5, No. 5, 1990, pp. 823-833. http://dx.doi.org/10.1029/PA005i005p00823
- [96] A. Shemesh, Y. Kolodny and B. Luz, “Isotope Geochemistry of Oxygen and Carbon in Phosphate and Carbonate of Phosphorite Francolite,” Geochimica et Cosmochimica Acta, Vol. 52, No. 11, 1988, pp. 2565-2572. http://dx.doi.org/10.1016/0016-7037(88)90027-0
- [97] Y. Kolodny and B. Luz, “Phosphate Deposits, Formation and Diagenetic History,” In: N. Clauer and S. Chaudhuri, Eds., Isotopic Signatures and Sedimentary Records, Springer Verlag, New York/Heidelberg, 1984, pp. 69- 122.
- [98] J. A. Dumoulin, J. F. Slack, M. T. Whalen and A. G. Harris, “Depositional Setting and Geochemistry of Phosphorites and Metalliferous Black Shales in the Carboniferous-Permian Lisburne Group, Northern Alaska,” US Geological Survey Professional Paper 1776, 2011.
- [99] S. Riggs, S. W. Snyder, D. Ames and P. Stille, “Chronostratigraphy of Upper Cenozoic Phosphorites on the North Carolina Continental Margin and the Oceanographic Implications for Phosphogenesis,” Society of Economic Paleontologists and Mineralogists Special Publication, Vol. 66, 2000, pp. 369-385.
- [100] D. Z. Piper, “Geochemistry of a Tertiary Sedimentary Phosphate Deposit: Baja California Sur,” Chemical Geology, Vol. 92, No. 4, 1991, pp. 283-316. http://dx.doi.org/10.1016/0009-2541(91)90075-3
- [101] R. A. Berner, “GEOCARBSULF: A Model for Phanerozoic Atmospheric O2 and CO2,” Geochimica et Cosmochimica Acta, Vol. 70, No. 23, 2006, pp. 5653-5664. http://dx.doi.org/10.1016/j.gca.2005.11.032
- [102] D. E. MacDonald, “Geology and Resource Potential of Phosphates in Alberta and Portions of Southwest British Columbia,” M.Sc. Thesis, University of British Columbia, Vancouver, 1985.
- [103] N. Jakubowski, R. Brandt, D. Stuewer, H. R. Eschnauer and S. Görtges, “Analysis of Wines by ICP-MS: Is the Curve of Rare Earth Elements a Reliable Fingerprint for the Provenance,” Fresenius Journal of Analytical Chemistry, Vol. 364, No. 5, 1999, pp. 424-428. http://dx.doi.org/10.1007/s002160051361

