American Journal of Analytical Chemistry
Vol. 3 No. 8 (2012) , Article ID: 21905 , 4 pages DOI:10.4236/ajac.2012.38074
Simultaneous Determination of Atorvastatin and Glimepiride by LC-MS/MS in Human Plasma and Its Application to a Pharmacokinetic Study
Bioanalytical Department, Integrated Product Development, Dr. Reddy’s Laboratories Ltd., Hyderabad, India
Email: *vijayabd@drreddys.com
Received May 10, 2012; revised June 4, 2012; accepted June 28, 2012
Keywords: Atorvastatin; Glimepiride; LC-MS/MS; Method Validation; Human Plasma and Pharmacokinetic Studies
ABSTRACT
The aim of the proposed research work was to develop and validate a simple, selective, high sensitive and high-throughput assay for the simultaneous estimation of Atorvastatin and Glimepiride in human plasma using liquid chromatography tandem mass spectrometry (LC-MS/MS). Atorvastatin-Glimepiride combines a competitive inhibitor of HMG-CoA reductase and a sulfonylurea anti-diabetic drug. The purpose of this study was to develop single method for Atorvastatin and Glimepiride in plasma by liquid chromatography-tandem mass spectrometry (LC-MS/MS) that would result into a simultaneous estimation of Atorvastatin and Glimepiride avoiding acid-lactone inter conversions right from sample collections to analysis on the LC-MS/MS. Sample collection procedure optimized for Atorvastatin holds good for Glimepiride, hence resulting into a simultaneous estimation of Atorvastatin and Glimepiride. Liquid-liquid extraction and liquid chromatography coupled to positive ion mode tandem mass spectrometry was used to develop the method and was validated according to US FDA guidelines. The calibration curves for two analytes were linear (R2 ≥ 0.9950, n = 4) over the concentration range of 0.2 - 30 ng/mL for Atorvastatin and 1 - 250 ng/mL for Glimepiride. Mean extraction recoveries 80.34 ± 9.43 for Atorvastatin and 88.19 ± 7.13 for Glimepiride. Intraand inter-run mean percent accuracy was between 85% - 115% and percent imprecision was ≤15%. Stability studies revealed that Atorvastatin and Glimepiride were stable in plasma during bench top (10.5 h at room temperature), in Injector (47.5 h), at the end of three successive freeze and thaw cycles and long term at −65˚C ± 15˚C for 114 days. The method was successfully applied to the study of pharmacokinetics of Atorvastatin and Glimepiride in healthy volunteers. Simultaneous estimation of Atorvastatin and Glimepiride is cost effective, reduces analysis cycle time, enables effective utilization of resources and reduces bleeding burden on human volunteers.
1. Introduction
Atorvastatin (ATV) is (3R,5R)-7-[2-(4-fluorophenyl)-3- phenyl-4-(phenylcarbamoyl)-5-(propan-2-yl)-1H-pyrrol1-yl]-3,5-dihydroxyheptanoic acid [CAS no: 134523-03- 8] (Figure 1). It is a HMG-CoA (3-hydroxy-3-methylglutaryl-coenzymeA) reductase inhibitor. This enzyme is involved in cholesterol biosynthesis by catalyzing the conversion reaction of HMG-CoA to mevalonate. The function of lowering the amount of cholesterol results in clearing the LDP (low-density lipoprotein) cholesterol in the blood by increased LDL receptors. Absorbed ATV is extensively metabolized in both the gut and liver by oxidation, lactonisation and glucuronidation, and the metabolites are eliminated by biliary secretion and direct secretion from blood to the intestine [1,2]. GLI (CAS no: 93479-97-1; Figure 1) is a medium-to-long acting sulfonylurea anti-diabetic drug. Like all sulfonylureas, GLI acts as a secretagogue [3]. It lowers blood sugar by stimulating the release of insulin by pancreatic beta cells and by inducing increased activity of intracellular insulin receptors. Two strengths in combination with metformin are available in market. Atorvastatin (ATV)-Glimepiride (GLI) combines a competitive inhibitor of HMGCoA reductase and a sulfonylurea anti-diabetic drug GLI. In the references few bioanalytical methods were reported for the determination of ATV and GLI separately and in combination with another products [4-21]. Two methods have been reported for the simultaneous determination of ATV and GLI [22,23]. Harshini et al. (2011) reported a method for simultaneous determination
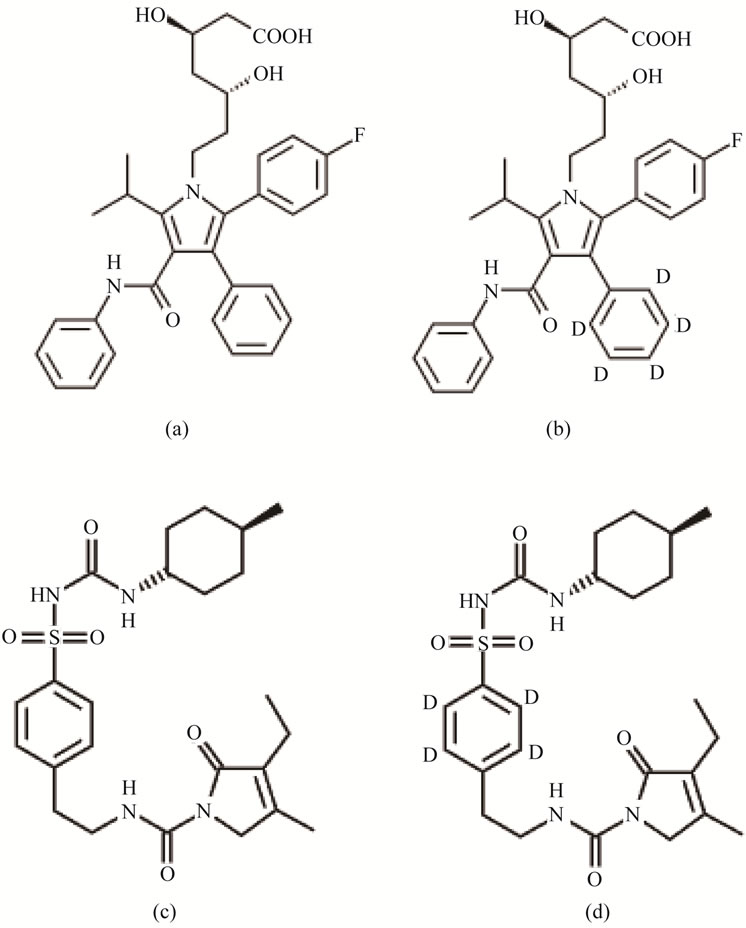
Figure 1. Structural representation of (a) ATV (Atorvastatin); (b) ATV-IS (Atorvastatin-d5); (c) GLI (glimepiride) and (d) GLI-IS (Glimepiride-d4).
of ATV and GLI by HPLC [23]. Galani et al. reported a in vitro and in vivo effect of GLI with rosuvastatin and ATV [4]. The objective of the present manuscript is to develop single, rapid and sensitive method for ATV and GLI that were reliably measure the analytes in the human plasma samples. In this manuscript for the first time we are presenting a simultaneous estimation of ATV and GLI on LC-MS/MS by crossing all the stability issues pertaining to metabolites of ATV, lactone conversion issue of ATV by arresting at sample collection procedure.
The following are the advantages of the proposed method when compared to the reported methods. In our knowledge the proposed method is the first bioanalytical method for simultaneous estimation of ATV and GLI by LC-MS/MS in human plasma. A single-step liquid-liquid extraction procedure was developed which reduces time and simplifies the sample preparation procedure. The method uses less volume of plasma (0.100 mL), which reduces bleeding burden on human volunteers. Another advantage is rapid sample analysis turnaround time of 3.00 minutes. The chromatographic conditions were optimized and the results of validation in terms of specificity, linearity, precision, accuracy, extraction efficiency and stabilities were established. The method was successfully applied to pharmacokinetic study characterizing ATV and GLI in healthy volunteers. Typical PK parameters including Cmax (the maximum plasma concentration), AUC0→t (Area under plasma concentration-time curve) and AUC0→∞, (Area under the concentration timecurves from time zero to infinity) were comparable with the literature values.
2. Experimental
2.1. Chemicals & Materials
ATV and GLI were obtained from Dr Reddys Laboratories Limited, Hyderabad, India. Atorvastatin D5 (ATVIS), Glimepiride D4 (GLI-IS) were obtained from Clearsynth Labs Limited, Mumbai, India. HPLC Grade Methanol, HPLC Grade Acetonitrile, analytical grade formic acid and HPLC grade diethyl ether purchased from Merck specialties (Mumbai, India). HPLC grade was purchased from (RFCL Chemicals New Delhi, India). Analytical-grade sodium hydrogen phosphate was purchased from sdfine chemicals (Mumbai, India.), K2EDTA human plasma was obtained from a registered blood Bank, Secunderabad, India and stored at –20˚C prior to use.
2.2. Instrumentation: Liquid Chromatography-Mass Spectrometry
A Shimadzu HT (Shimadzu, Japan) LC system equipped with degasser (DGU-20A5), binary pump (LC-20AD) along with auto-sampler (SIL-HTC) was used to inject 10 µl aliquots of the processed samples on a ACE5C18 (50 × 4.6 mm, ACE, Scotland) which was maintained at 40˚C ± 2˚C in column oven (CTO-10AS). The isocratic mobile phase, a mixture of 0.1% formic acid: acetonitrile (30:70, v/v) was filtered through a 0.45 µm membrane filter (XI5522050) (Millipore, USA or equivalent) and then degassed ultrasonically for 5 min was delivered at a flow rate of 0.5 ml/min into the mass spectrometer electro spray ionization chamber.
Quantitation was achieved by MS/MS detection in positive ion mode for analytes and IS using a MDS Sciex (Foster City, CA, USA) API-4000 mass spectrometer, equipped with a Turboionsprayä interface at 400˚C. The common parameters viz., curtain gas, nebulizer gas (GS1), auxillary gas (GS2) and collision gas (CAD) were set at 25, 30, 40 and 5 psi, respectively. The compounds parameters viz., declustering potential (DP), collision energy (CE), collision exit potential (CXP) and entrance potential (EP) for ATV, GLI, ATV-IS and GLI-IS were 70, 27, 12, 10 V; 50, 19, 10, 10 V and 70, 27, 12, 10 V and 50, 19, 10, 10 V respectively. Detection of the ions was performed in the multiple reaction monitoring (MRM) mode, monitoring the transition of the m/z 559.4 precursor ion to the m/z 440.1 product ion for ATV, m/z 491.3 precursor ion to the m/z 352.4 product ion for GLI, m/z 564.1 precursor ion to the m/z 445.1 product ion for ATV-IS and m/z 495.0 precursor ion to the m/z 356.3 product ion for GLI-IS. Quadrupole Q1 and Q3 were set on unit resolution. The dwell time was 200 msec. The analytical data were processed by Analyst software (version 1.5.1).
2.3. Preparation of Stock and Standard Solutions
Primary stock solutions of ATV and GLI for preparation of standard and quality control (QC) samples were prepared from separate weighing. The primary stock solutions (1000 µg/ml) of ATV and GLI were prepared in methanol separately. The ATV-IS and GLI-IS stock solution of 1000 µg/ml were prepared in methanol. The stock solutions of ATV and GLI, ATV-IS and GLI-IS were stored at –65˚C ± 15˚C, which were found to be stable for one month (data not shown) and successively diluted with 50% methanol to prepare working stock dilutions. Calibration standards and quality control (QC) samples were prepared by spiking (1% total volume of blank plasma) blank plasma with working stock dilutions of analytes. Working stock solutions were stored approximately at –65˚C ± 15˚C for a week (data not shown). Samples for the determination of precision and accuracy were prepared by spiking into interference free control plasma containing in bulk with ATV and GLI at appropriate concentrations [for ATV: 0.21 (LLOQ), 0.62 (LQC), 13.44 (MQC) and 24.79 (HQC) ng/ml; for GLI: 1.03 (LLOQ), 3.06 (LQC), 113.30 (MQC) and 211.38 (HQC) ng/ml] and 100 µL aliquots were distributed into different tubes. To these tubes 5 µL of 1 M sodium phosphate buffer was added to prevent the lactone conversion of ATV based on the established conditions of ATV stability in plasma with and without addition of 1 M sodium phosphate buffer to monitor the the acid to lactones inter conversions. All the samples were stored at –65˚C ± 15˚C.
2.4. Sample Preparation
To an aliquot of 100 µL human plasma sample, IS solution (50 µL) then 50 µL of 1% (V/V) orthophosporic acid in HPLC grade water were added and vortex mixed for 30 sec on a cyclomixer (Remi Instruments, Mumbai, India). The addition of phosphoric acid denatures the proteins that were present in the plasma from the analyte which helps in the best possible recovery in the liquid liquid extraction. To this sample mixture add 2 mL of diethyl ether and the mixture was vortexed for 5 mins followed by centrifugation for 5 mins at 4500 rpm on multifuge 3SR (Heraus, Germany). The organic layer (1.8 mL) was separated and evaporated to dryness at 40˚C using gentle stream of nitrogen (turbo vap®, Zymark®, Kopkinton, MA, USA). The residue was reconstituted in 500 µL of mobile phase and 10 µL was directly injected onto LC-MS/MS system.
2.5. Validation Procedures
The method was validated to meet the acceptance criteria of industrial guidance for the bioanalytical method validation [24-27].
2.5.1. Matrix Effect, Specificity and Sensitivity
The effect of human plasma constituents over the ionization of ATV, GLI, ATV-IS and GLI-IS was determined by comparing the responses of the post extracted plasma QC samples (n = 6) with the response of analytes from neat standard samples (10 µL in 90 µL) prepared by using aqueous recovery dilutions at equivalent concentrations. Matrix effect was determined at low and high concentrations viz., ATV; 0.62 and 24.79 ng/mL, GLI; 3.06 and 211.38 ng/mL, whereas the matrix effect for ATV-IS and GLI-IS was determined at a single concentration of 50 ng/mL.
The specificity of the ATV was determined by screening six different batches of human blank plasma spiked with GLI -ULOQ. The sensitivity is determined by injection of six LLOQ samples from six different lots of human plasma by spiking the concentration of GLI-ULOQ. The specificity of the GLI was determined by screening six different batches of human blank plasma spiked with ATV-ULOQ. The sensitivity is determined by injection of six LLOQ samples from six different lots of human plasma by spiking the concentration of ATV-ULOQ [28-32].
2.5.2. Recovery
The recovery of ATV, GLI, ATV-IS and GLI-IS was determined by comparing the responses of the post extracted plasma standard QC samples (n = 6) with the response of analytes from neat samples at equivalent concentrations [24,25].
Recoveries was determined at low, medium and high quality control concentrations, whereas the recovery of the ATV-IS and GLI-IS was determined at a single concentration of 50 ng/mL IS was determined at a single concentration of The effect of plasma constituents over the ionization of analytes and IS was determined by comparing the responses of the post extracted plasma standard QC samples (n = 6) with the response of analytes from neat samples at equivalent concentrations [24,25].
2.5.3. Calibration Curve
The nine point calibration curve (0.20, 0.41, 1.02, 1.50, 4.53, 15.11, 22.55, 27 and 30 ng/mL for ATV and 1, 1.99, 4.98, 12.46, 37.76, 125.87, 187.87, 224.99 and 249.99 ng/mL for GLI) was constructed by plotting the peak area ratio of each analyte: IS against the nominal concentration of calibration standards. Following the evaluation of different weighing factors, the results were fitted to linear regression analysis with the use of 1/X2 (X: concentration) weighting factor. The calibration curve had to have a correlation coefficient (r) of 0.99 or better. The acceptance criteria for each back-calculated standard concentration were ±15% deviation from the nominal value except at LLOQ, which was set at ±20% [24-27].
2.5.4. Precision and Accuracy
The intra-assay precision and accuracy were estimated by analyzing six replicates containing ATV and GLI at four different QC levels [for ATV: 0.21 (LLOQ), 0.60 (LQC), 13.44 (MQC) and 24.88 (HQC) ng/mL; for GLI: 1.03 (LLOQ), 3.06 (LQC), 113.30 (MQC) and 211.38 (HQC) ng/mL] in plasma. The inter-assay precision was determined by analyzing the four levels QC samples on four different runs. The criteria for acceptability of the data included accuracy within ±15% deviation (SD) from the nominal values and a precision of within ±15% relative standard deviation (RSD) except for LLOQ, where it should not exceed ±20% of SD [26,27].
2.5.5. Stability Experiments
The stability of analytes and IS in the injection solvent was determined periodically by injecting replicate preparations of processed samples up to 47.50 hr (in autosampler) after the initial injection. The peak-areas of the analytes and IS obtained at initial cycle were used as the reference to determine the relative stability of the analytes at subsequent points. Stability of analytes in the biomatrix after 10.50 h exposure (bench top) was determined at two concentrations in six replicates. Freezer stability of the analytes in biomatrix was assessed by analyzing the QC samples stored at –65˚C ± 15˚C for at least 114 days. The stability of analytes in biomatrix following repeated three freeze-thaw cycles (stored at –65˚C ± 15˚C between cycles) was assessed using QC samples spiked with analytes. Samples were processed as described under section 2.4. Samples were considered to be stable if assay values were within the acceptable limits of accuracy (i.e., ±15% S.D) and precision (i.e., 15% R.S.D) [24-27]. Stability data for both ATV and GLI are presented in Table 1.
2.5.6. ATV Stability in Plasma
Statin molecules are known to be susceptible to inter conversion of the lactone and acidic forms, so it is necessary to consider this phenomenon during method development and validation. There are several categories of drugs that could undergo inter conversion. HMG-CoA reductase inhibitors are typical examples of such a class, where the interconversion occurs between lactone and open ring hydroxy acid. Atorvastatin administered as the open-ring hydroxyl acid, but the post dose sample contain both acid and lactonized forms [33-37]. For the samples of hydroxyl acid chemical structure and the corresponding lactone forms, it is important to maintain pH between 4 and 5 in order to minimize inter conversion [33]. This was confirmed by performing bench top stability experiment at LQC and HQC levels of ATV with and without addition of the 1 M sodium phosphate buffer. 1 M sodium phosphate buffers maintains the pH in between 4 - 5 in the plasma so that the inter conversion can be arrested. Results shown 130% higher accuracies (131.2 - 137.8) with a precision (% CV) ranged from 3.78 - 5.69 at LQC and HQC levels for ATV in neutral plasma (with out addition of 1M buffer) indicates that the inter conversion in neutral plasma. LQC and HQC samples spiked with 1M sodium phosphate buffer are precise and accurate. ATV was within 96.41 - 108.9, while the
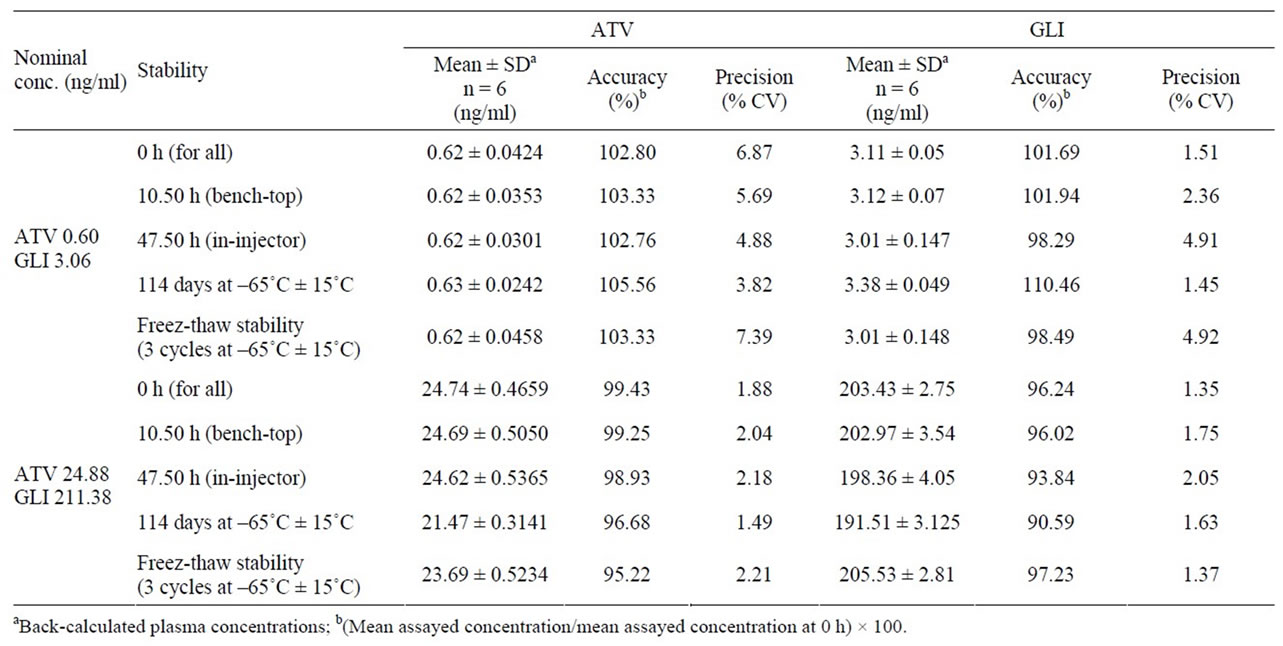
Table 1. Stability data of ATV and GLI quality controls in human plasma.
precision (% CV) values ranged from 2.62 - 6.78 for ATV.
2.6. Pharmacokinetic Study
A pharmacokinetic study was performed in healthy male subjects. The ethics committee approved the protocol and the volunteers provided with informed written consent. Blood samples were obtained following oral administration of 20/1 mg of ATV /GLI tablet into polypropylene tubes containing K2 EDTA solution as anti-coagulant which contains at pre-dose 0.25,0.5, 0.75,1.0, 1.25, 1.5, 1.75, 2, 2.33, 2.67, 3, 3.5, 4, 4.5, 5, 5.5, 6, 7, 8, 10, 12, 16, 24, 36, 48 and 72 h. Plasma was harvested by centrifuging the blood using Biofuge (Hereaus, Germany) at 1760 g for 5 min, transferred 1 mL of plasma to vials containing 50 µL of 1 M sodium phosphate buffer and stored frozen at –65˚C ± 15˚C until analysis.
An aliquot of 100 µL of thawed plasma samples were spiked with IS and processed as mentioned in sample preparation section. Along with study samples, QC samples at low, medium and high concentration were assayed in duplicate and were distributed among unknown samples in the analytical run. The criteria for acceptance of the analytical runs encompassed the following: 1) not more than 33% of the QC samples were greater than ± 15% of the nominal concentration 2) not less than 50% at each QC concentration level must meet the acceptance criteria. Plasma concentration-time data of ATV and GLI was analyzed by non-compartmental method using WinNonlin Version 5.1 (Pharsight Corporation, Mountain View, CA).
3. Results & Discussion
3.1. Liquid Chromatography and Mass Spectroscopy
Feasibility of various mixture(s) of solvents such as acetonitrile and methanol using different buffers such as ammonium acetate, ammonium formate and formic acid along with altered flow-rates (in the range of 0.1 - 0.6 ml/min) were tested for complete chromatographic resolution of analytes and IS (data not shown). The resolution of peaks was achieved with 0.1% Formic acid:Acetinitrile (30:70, v/v) with a flow rate of 0.5 ml/min, on a ACE C18 (50 × 4.6 mm, ACE, Scotland) which was maintained at 40˚C ± 2˚C was found to be suitable for the determination of electrospray response for ATV, GLI, ATV-IS and GLI-IS.
In order to optimize ESI conditions for ATV, GLI, ATV-IS and GLI-IS, mass spectrometry detection was carried out in positive electro spray ionization mode, with multiple reaction monitoring scan. During a direct infusion experiment, the mass spectra for ATV, GLI, ATV-IS and GLI-IS revealed peaks at m/z 559.3, 491.2, 564.2 and 356.3, respectively as protonated molecular ions, [M + H]+. Following detailed optimization of mass spectrometry conditions (provided in Instrumentation and chromatographic conditions section) m/z 559.3 precursor ion to the m/z 440.4 was used for quantification of ATV and m/z 491.2 precursor ion to the m/z 352.3 was used for quantification of GLI. Similarly, for ATV-IS m/z 564.2 precursor ion to the m/z 445.4and m/z 495.2 precursor ion to the m/z 356.3 was used for quantification of GLI-IS was used for quantification purpose.
We believe that with combination of ACE column usage (for chromatographic separation) and positive ion mode for quantification of ATV and GLI on mass spectrometry, we could achieve simultaneous estimation of both analytes with low LLOQ and shorter run time compared with the earlier reported independent methods for each analytes, run time and LLOQ values.
3.2. Matrix Effect, Specificity and Sensitivity
No potential interference at the retention time of the ATV was observed in six different human blanks that were spiked along with the GLI ULOQ for ATV blanks. The sensitivity of the ATV LLOQ’s in presence of GLIULOQ was precise and accurate with % RSD of 3.2. No potential interference at the retention time of the GLI was observed in six different human blanks that was spiked along with the ATV ULOQ for GLI blanks.
The sensitivity of the GLI-LLOQ’s in presence of ATV-ULOQ was precise and accurate with % RSD of 2.6.
Average matrix factor values (matrix factor = response of post spiked concentrations/response of neat concentrations) obtained were –0.09 (CV: 2.57%, n = 6) and –0.07 (CV: 4.83%, n = 6) for ATV and +0.25 (CV: 8.88%, n = 6) and +0.16 (CV: 7.02%, n = 6) for GLI at QC low and QC high concentrations, respectively. No significant peak area differences were observed. Matrix effect on ATV-IS was found to be –0.07 (CV: 3.40%, n = 12) and GLI-IS was found to be +0.21 (CV: 7.72%, n = 12) at tested concentration of 500 ng/mL. Overall it was found that the plasma extract has a small impact on the ionization of analyte and IS.
A typical chromatogram for the control human plasma (free of analyte and IS) and human plasma spiked with ATV, GLI, ATV-IS, GLI-IS at LLOQ along with in vivo sample chromatograms are shown in the Figure 2 to Figure 7 respectively. No interfering peaks from endogenous compounds are observed at the retention times of analytes and IS. The retention time of ATV and ATV-IS was 1.91 min and GLI and GLI-IS was 2.28 mins respectively. The total chromatographic run time was 3.0 min.
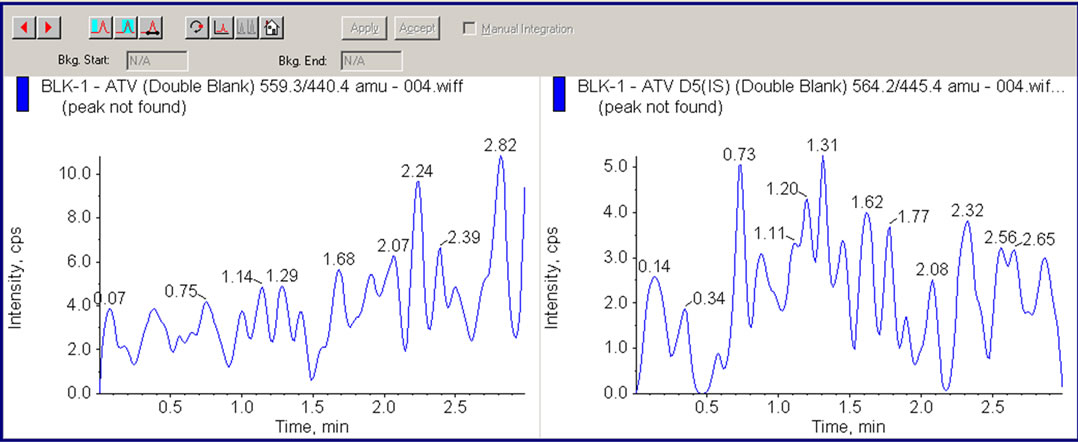
Figure 2. LC/MS/MS chromatogram showing human plasma Chromato-gram for ATV and Internal Standard (ATV-IS).
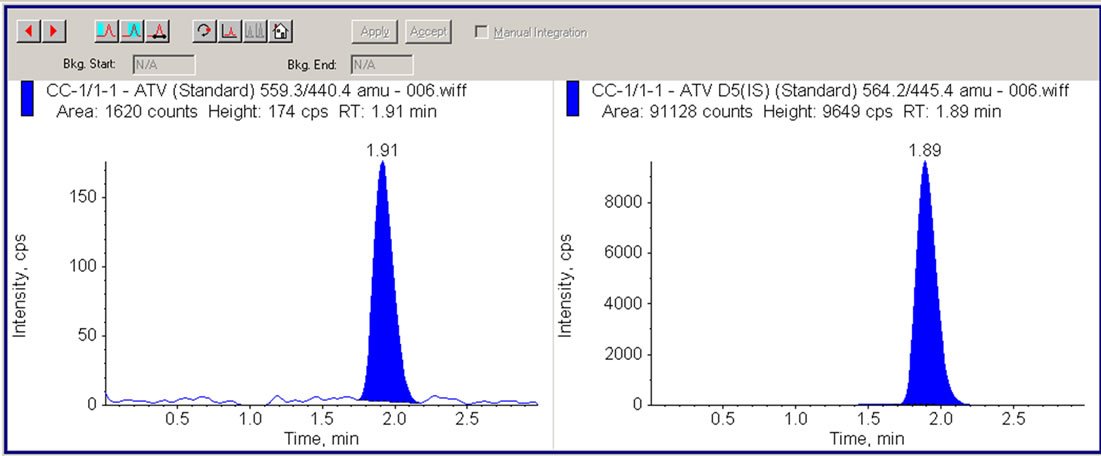
Figure 3. LC/MS/MS chromatogram showing human plasma containing 0.2 ng/mL ATV (LLOQ) and 50 ng/mL internal standard (ATV-IS).
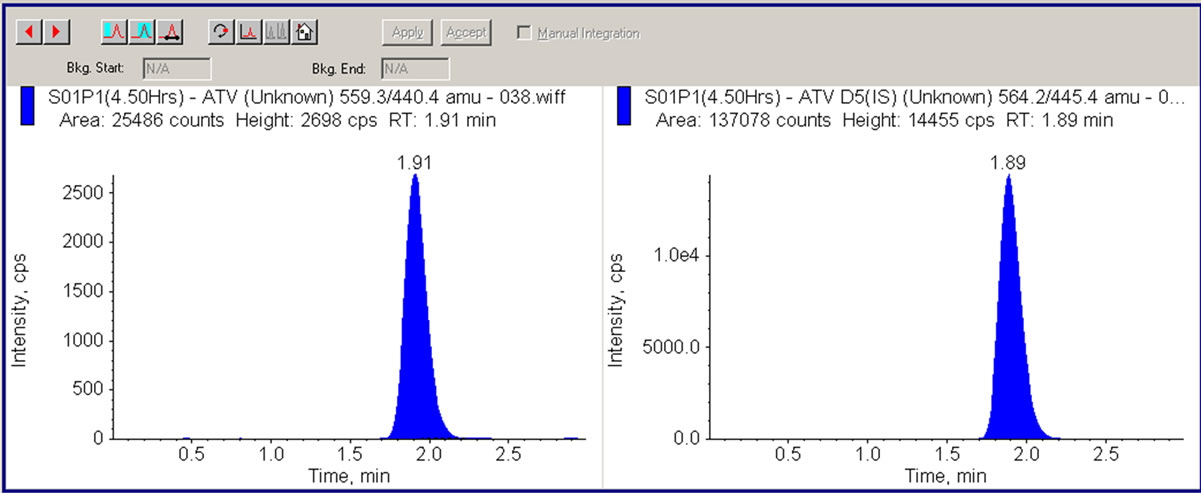
Figure 4. LC/MS/MS chromatogram showing human plasma sample (4.50 hrs) containing 5.6 ng/mL ATV and 50 ng/mL internal standard (ATV-IS).
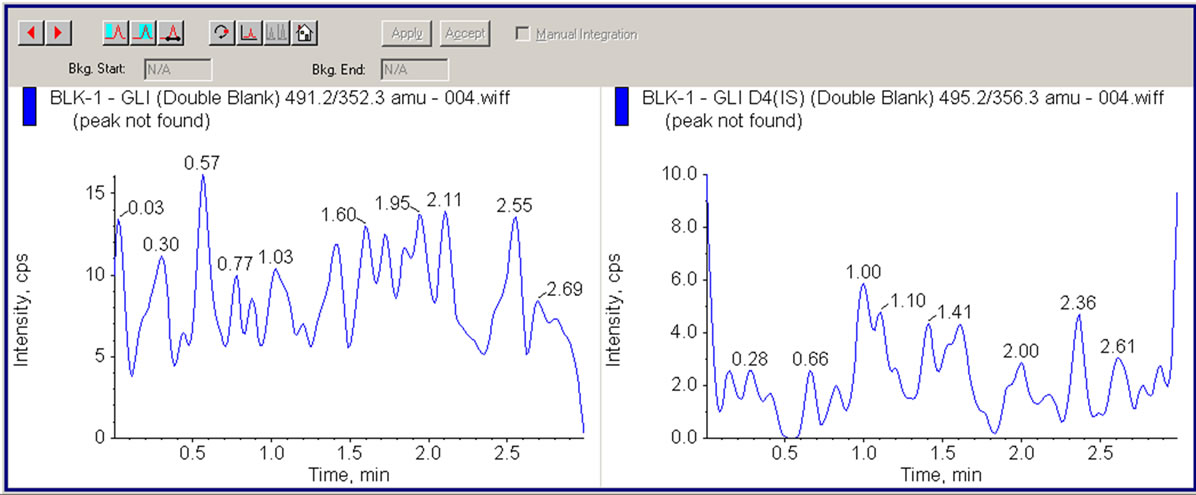
Figure 5. LC/MS/MS chromatogram showing human plasma Chromato-gram for ATV and Internal Standard (ATV-IS).
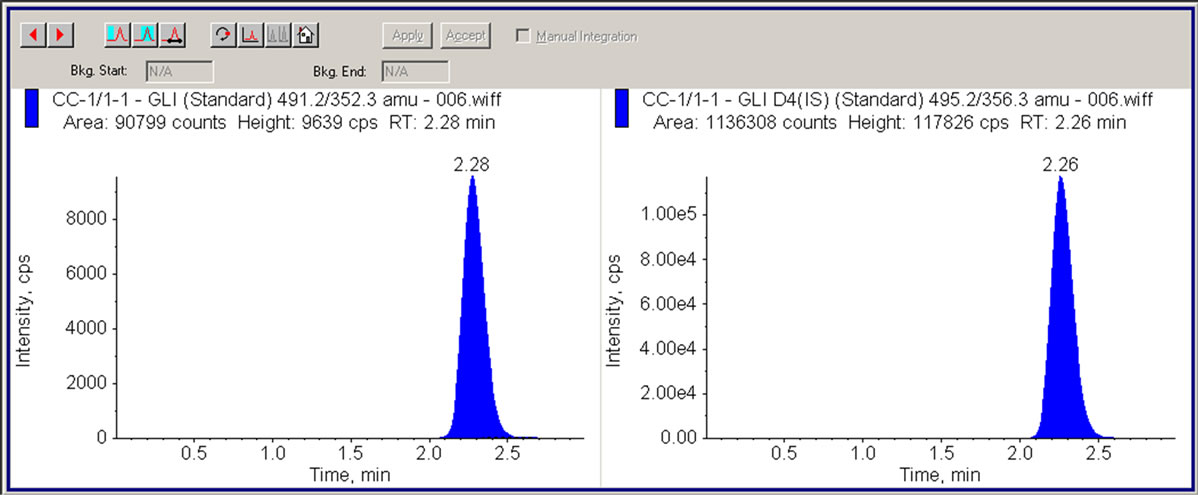
Figure 6. LC/MS/MS chromatogram showing human plasma containing 1 ng/mL GLI (LLOQ) and 50 ng/mL internal standard (GLI-IS).
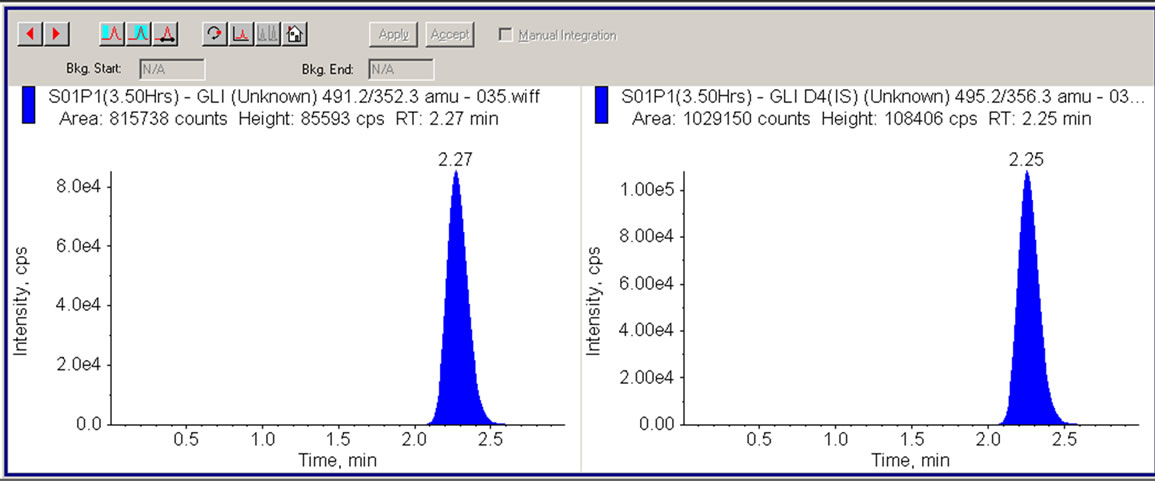
Figure 7. LC/MS/MS chromatogram showing human plasma sample (3.50 hrs) containing 72.67 ng/mL GLI and 50 ng/mL internal standard (GLI-IS).
3.3. Recovery
Recovery was assessed for each analyte at high QC concentration and peak area response was used for the calculations. Recovery was found to be to be 80.34% ± 9.43% and 88.19% ± 7.13% for ATV and GLI respectively. The absolute recovery of ATV-IS and GLI-IS was 76.49% ± 5.70% and 91.87% ± 0.53%.
3.4. Calibration Curve
The calibration standard curve had a reliable reproducibility over the standard concentrations across the calibration range. Calibration curve was prepared by determining the best fit of peak-area ratios (peak area analyte/ peak area IS) versus concentration, and fitted to the y = mx + c using weighing factor (1/X2). The average regression (n = 4) was found to be >0.995. The lowest concentration with the RSD < 20% was taken as LLOQ and was found to be 0.21 and 1.03 ng/ml for ATV and GLI respectively. The % accuracy observed for the mean of back-calculated concentrations for four calibration curves for ATV and GLI was within 92.41 - 103.9 and 88.7- 98.54, respectively; while the precision (% CV) values ranged from 0.62 - 7.78 and 1.49 - 3.42 for ATV and GLI, respectively.
3.5. Accuracy and Precision
Accuracy and precision data for intraand inter-day plasma samples for ATV and GLI are presented in Table 2. The assay values on both the occasions (intraand inter-day) were found to be within the accepted variable limits.
3.6. Stability
The predicted concentrations for ATV and GLI at LQC and HQC deviated within ±15% of the nominal concentrations in a battery of stability tests viz., in-injector (47.50 h), bench-top (10.5 h) and freezer stability at –65˚C ± 15˚C for at least for 114 days (Table 1).
3.7. Pharmacokinetic Study
The present method was applied to the analysis of plasma samples obtained from 20 healthy human volunteers following oral administration of 20/1 mg of ATV/GLI tablets as a part of pharmacokinetic study. The sensitivity and specificity of the assay were found to be sufficient for accurately characterizing the plasma pharmacokinetics of ATV/GLI in humans. Figure 8 depicts the mean plasma concentration vs. time profile of ATV and GLI in these volunteers under fasted conditions.
Following the oral administration of 20/1 mg of ATV/ GLI tablets to volunteers under fasting conditions, the mean maximum plasma concentrations (Cmax), 5.61 ng/mL, were attained at ~4.50 h (Tmax), while the AUC(0-α) was 60.91 ng·h/mL for ATV and the mean maximum plasma concentrations (Cmax), 72.67 ng/mL, were attained at ~5.57 h (Tmax), while the AUC(0-α) was 515.21 ng·h/mL for GLI, respectively were matched with PK parameters in the literature [38-43].
4. Conclusion
In summary, we have developed and validated a highly sensitive, specific, reproducible and high-throughput LCMS/MS bioanalytical method to quantify ATV and GLI simultaneously. This method has appropriate sample collection procedure which avoids inter conversion issues of ATV by addition of sodium hydrogen phosphate buffer during sample collection. This method has been successfully used to characterize the concentrations of ATV and GLI in pharmacokinetic studies. We believe

Table 2. Intra and inter-day precision determination of ATV and GLI quality controls in plasma.
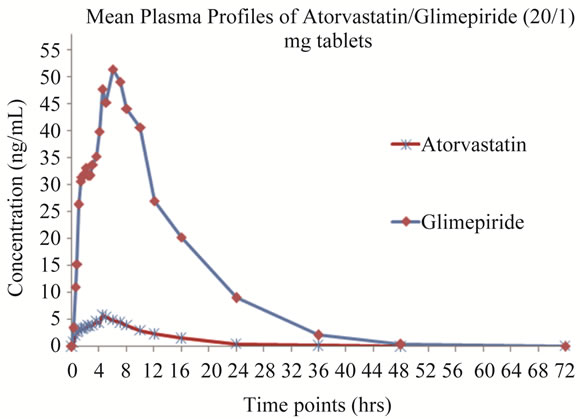
Figure 8. Mean plasma concentration-time profile of ATV and GLI in human plasma following oral dosing of 20/1 mg of ATV/GLI tablets.
that the LC-MS/MS method presented by us has lot of merits over the earlier reported methods. Advantages of the current method is less sample volume, utilizes simple extraction method and enables simultaneous estimation of combination drugs; hence we believe that the future bioanalytical methods will utilize this method for estimation of ATV and GLI in various biological matrices with little or no modification.
REFERENCES
- H. Lennernäs, “Clinical Pharmacokinetics of Atorvastatin,” Clinical Pharmacokinetics, Vol. 42, No. 13, 2003, pp. 1141-1160. doi:10.2165/00003088-200342130-00005
- R. L. Lins, K. E. Matthys, et al., “Pharmacokinetics of Atorvastatin and Its Metabolites After Single and Multiple Dosing in Hypercholesterolaemic Haemodialysis Patients,” Nephrology Dialysis Transplantation, Vol. 18, No. 5, 2003, pp. 967-976. doi:10.1093/ndt/gfg048
- S. N. Davis, “The Role of Glimepiride in the Effective Management of Type 2 Diabetes,” Journal of Diabetes and its Complications, Vol. 18, No. 6, 2004, pp. 367-376. doi:10.1016/j.jdiacomp.2004.07.001
- V. J. Galani and M. Vyas, “In Vivo and in Vitro Drug Interactions Study of Glimepiride with Atorvastatin and Rosuvastatin,” Journal of Young Pharmacists, Vol. 2, No. 2, 2010, pp. 196-200. doi:10.4103/0975-1483.63169
- D. Liu, J. Jiang, H. Zhou and P. Hu, “Quantitative Determination of Atorvastatin and Para-Hydroxy Atorvastatin in Human Plasma by LC-MS-MS,” Journal of Chromatographic Science, Vol. 46, No. 10, 2008, pp. 862-866.
- M. A. Khan, S. Sinha, S. Vartak, A. Bhartiya and S. Kumar, “LC Determination of Glimepiride and Its Related Impurities,” Journal of Pharmaceutical and Biomedical Analysis, Vol. 39, No. 4, 2005, pp. 928-943. doi:10.1016/j.jpba.2005.06.007
- A. Karthik, G. Subramanian, C. Mallikarjuna Rao, K. Bhat, A. R. Kumar, P. Musmade, M. Surulivelrajan, K. Karthikeyan and N. Udupa, “Simultaneous Determination of Pioglitazone and Glimepiride in Bulk Drug and Pharmaceutical Dosage form by RP-HPLC Method,” Pakistan Journal of Pharmaceutical Sciences, Vol. 21, No. 4, 2008, pp. 421-425.
- B. X. He, L. Shi, J. Qiu, X. H. Zeng, L. Tao, R. Li, C. J. Hong, X. L. Gu, F. Y. Dong, L. Yang and S. J. Zhao, “Quantitative Determination of Atorvastatin and OrthoHydroxy Atorvastatin in Human Plasma by Liquid Chromatography Tandem Mass Spectrometry and Pharmacokinetic Evaluation,” Methods and Findings Experimental and Clinical Pharmacology, Vol. 32, No. 7, 2010, pp. 481-487. doi:10.1358/mf.2010.32.7.1487086
- R. V. S. Nirogi, V. N. Kandikere, et al., “Simultaneous Quantification of Atorvastatin and Active Metabolites in Human Plasma by Liquid Chromatography-Tandem Mass Spectrometry Using Rosuvastatin as Internal Standard,” Biomedical Chromatography, Vol. 20, No. 9, 2006, pp. 924-936. doi:10.1002/bmc.622
- Md. K. Pasha, S. Muzeeb, S. J. S. Basha, D. Shashikumar, R. Mullangi and N. R. Srinivas, “Analysis of Five HMGCoA Reductase Inhibitors—Atorvastatin, Lovastatin, Pravastatin, Rosuvastatin and Simvastatin: Pharmacological, Pharmacokinetic and Analytical Overview and Development of a New Method for Use in Pharmaceutical Formulations Analysis and in Vitro Metabolism Studies,” Biomedical Chromatography, Vol. 20, No. 3, 2006, pp. 282-293. doi:10.1002/bmc.561
- N. R. Pilli, J. K. Inamadugu, R. Mullangi, V. K. Karra, J. R. Vaidya and J. V. Rao, “Simultaneous Determination of Atorvastatin, Amlodipine, Ramipril and Benazepril in Human Plasma by LC-MS/MS and Its Application to a Human Pharmacokinetic Study,” Biomedical Chromatography, Vol. 25, No. 4, 2011, pp. 439-449. doi:10.1002/bmc.1462
- J. S. Macwan, I. A. Ionita, M. Dostalek and F. Akhlaghi, “Development and Validation of a Sensitive, Simple, and Rapid Method for Simultaneous Quantitation of Atorvastatin and Its Acid and Lactone. Metabolites by Liquid Chromatography-Tandem Mass Spectrometry (LC-MS/ MS),” Analytical and Bioanalytical Chemistry, Vol. 400, No. 2, 2011, pp. 423-433. doi:10.1007/s00216-011-4804-y
- R. Bonfilio, M. B. de Araújo and H. R. N. Salgado, “Review of Analytical Techniques for Determination of Glimepiride: Present and Perspectives,” Therapeutic Drug Monitoring, Vol. 32, No. 5, 2010, pp. 550-559. doi:10.1097/FTD.0b013e3181eea55a
- H. Kim, K. Y. Chang, C. H. Park and M. S. Jang, “Determination of Glimepiride in Human Plasma by LC-MSMS and Comparison of Sample Preparation Methods for Glimepiride,” Chromatographia, Vol. 60, No. 1, 2004, pp. 93-98. doi:10.1365/s10337-004-0351-4
- N. Yüzüak, T. Özden, S. Eren and S. Özilhan, “Determination of Glimepiride in Human Plasma by LC-MS-MS,” Chromatographia, Vol. 66, No. 1, 2007, pp. 165-168.
- S. Samala, S. R. Tatipamula and C. Veeresham, “Determination of Glimepiride in Rat Serum by Rp-Hplc Method,” American Journal of Analytical Chemistry, Vol. 2, No. 2, 2011, pp. 152-157. doi:10.4236/ajac.2011.22017
- Y. Dotsikas, C. Kousoulos, G. Tsatsou and Y. L. Loukas, “Development of a Rapid Method for the Determination of Glimepiride in Human Plasma Using Liquid-Liquid Extraction Based on 96-Well Format Micro-Tubes and Liquid Chromatography/Tandem Mass Spectrometry,” Rapid Communications in Mass Spectrometry, Vol. 19, No. 1, 2005, pp. 2055-2061. doi:10.1002/rcm.2028
- P. Sengupta, U. Bhaumik, A. Ghosh, A. K. Sarkar, B. Chatterjee, A. Bose and T. K. Pal, “LC-MS-MS Development and Validation for Simultaneous Quantitation of Metformin, Glimepiride and Pioglitazone in Human Plasma and Its Application to a Bioequivalence Study,” Chromatographia, Vol. 69, No. 1, 2009, pp. 1243-1250. doi:10.1365/s10337-009-1056-5
- L. Chakradhar, R. Kallem, A. Karthik, B. T. Sundari, S. Ramesh, R. Mullangi and N. R. Srinivas, “Rapid and Highly Sensitive Method for the Determination of Glimepiride in Human Plasma by Liquid ChromatographyElectrospray Ionization Tandem Mass Spectrometry: Application to a Pre-Clinical Pharmacokinetic Study,” Biomedical Chromatography, Vol. 22, No. 1, 2008, pp. 58- 63. doi:10.1002/bmc.896
- I. I. Salem, J. Idrees and J. I. Tamimi, “Determination of Glimepiride in Human Plasma by Liquid Chromatography-Electrospray Ionization Tandem Mass Spectrometry,” Journal of Chromatography B, Vol. 799, No. 1, 2004, pp. 103-109. doi:10.1016/j.jchromb.2003.10.024
- J. Deepti, J. Surendra, J. Deepak and A. Maulik, “Simultaneous Estimation of Metformin Hydrochloride, Pioglitazone Hydrochloride, and Glimepiride by RP-HPLC in Tablet Formulation,” Journal of Chroamtographi Science, Vol. 46, No. 6, 2008, pp. 501-504.
- S. R. Dhaneshwar, J. V. Salunkhe and V. K. Bhusari, “Validated HPTLC Method for Simultaneous Estimation of Metformin Hydrochloride, Atorvastatin and Glimepiride in Bulk Drug and Formulation,” Journal of Analytical and Bioanalytical Techniques, Vol. 109, No. 1, 2010, pp. 1-5. doi:10.4172/2155-9872.1000109
- H. Kotagiri, R. Gannu, C. R. Palem, S. K. Yamsani, V. V. Yamsani and M. R. Yamsani, “Simultaneous Determination of Glimepiride and Atorvastatin in Human Serum by High Performance Liquid Chromatography: Application to Pharmacokinetic Study,” Journal of Liquid Chromatography and Related Technologies, Vol. 34, No. 19, 2011, pp. 2420-2432. doi:10.1080/10826076.2011.591023
- US Food and Drug Administration, “Guidance for Industry: Bioanalytical Method Validation,” US Department of Health and Human Services, US FDA, Center for Drug Evaluation and Research, 2001.
- US Food and Drug Administration, “Guidance for Industry: Safety Testing of Drug Metabolites,” US Department of Health and Human Services, US FDA, Center for Drug Evaluation and Research, 2008.
- C. T. Viswanathan, S. Bansal and B. Booth, “Quantitative Bioanalytical Methods Validation and Implementation: Best Practices for Chromatographic and Ligand Binding Assays. Workshop/Conference Report,” The AAPS Journal, Vol. 9, No. 1, 2007, pp. E30-E42. doi:10.1208/aapsj0901004
- D. M. Fast, M. Kelley and C. T. Viswanathan, “AAPS Workshop on Current Topics in GLP Bioanalysis: Assay Reproducibility for Incurred Samples—Implications of Crystal City Recommendations Workshop Report and Follow-Up,” The AAPS Journal, Vol. 11, No. 2, 2009, pp. 238-241. doi:10.1208/s12248-009-9100-9
- G. Liu, Q. C. Ji and M. E. Arnold, “Identifying, Evaluating and Controlling Bioanalytical Risks Resulting from Non Uniform Matrix Ion Suppression/Enhancement and Nonlinear Liquid Chromatography-Mass Spectrometry Assay Response,” Analytical Chemistry, Vol. 82, No. 23, 2010, pp. 9671-9677. doi:10.1021/ac1013018
- E. Chambers, D. M. Wagrowski-Diehl, Z. Lu and J. R. Mazzeoe, “Systematic and Comprehensive Strategies for Reducing Matrix Effects in LC-MS/MS Analyses,” Journal of Chromatography B, Analytical Technologies in the Biomedical Life Sciences, Vol. 852, No. 1, 2007, pp. 22-34. doi:10.1016/j.jchromb.2006.12.030
- Y. Xia, M. Jemal, “Phospholipids in Liquid Chromatography-Mass Spectrometry Bioanalysis: Comparison of Three Tandem Mass Spectrometric Techniques for Monitoring Plasma Phospholipids, the Effect of Mobile-Phase Composition on Phospholipids Elution and the Association of Phospholipids with Matrix Effects,” Rapid Communication in Mass spectrometry, Vol. 23, No. 14, 2009, pp. 2125-2138.
- J. L. Little, M. F. Wempe and C. M. Buchanan , “Liquid Chromatography-Mass Spectrometry/Mass Spectrometry Method Development for Drug Metabolism Studies: Examining Lipid Matrix Ionization Effects in Plasma,” Journal of Chromatography B, Analytical Technologies in the Biomedical life Sciences, Vol. 833, 2006, pp. 219- 230. doi:10.1016/j.jchromb.2006.02.011
- C. Côté, A. Bergeron, J. N. Mess, M. Furtado and F. Garofolo, “Matrix Effect Elimination during LC-MS/MS Bioanalytical Method Development,” Bioanalysis, Vol. 1, No. 7, 2009, pp. 1243-1257.
- L. Nováková, , D. Šatínský and P. Solich, “HPLC Methods for the Determination of Simvastatin and Atorvastatin,” Trends in Analytical Chemistry, Vol. 27, No. 4, 2008, pp. 352-367. doi:10.1016/j.trac.2008.01.013
- M. Jemal and Y. Q. Xia, “Bioanalytical Method Validation Design for the Simultaneous Quantitation of Analytes That May Undergo Interconversion during Analysis,” Journal of Pharmaceutical and Biomedical Analysis, Vol. 22, No. 5, 2000, pp. 813-827. doi:10.1016/S0731-7085(00)00245-4
- M. Jemal, Z. Ouyang, B. Chen and D. Teitz, “Quantitation of the Acid and Lactone Forms of Atorvastatin and Its Biotransformation Products in Human Serum by High-Performance Liquid Chromatography with Electrospray Tandem Mass Spectrometry,” Rapid Communications in Mass Spectrometry, Vol. 13, No. 11, 1999, pp. 1003-1015. doi:10.1002/(SICI)1097-0231(19990615)13:11<1003::AID-RCM597>3.0.CO;2-L
- M. J. Morris, J. D. Gilbert, J. Y. Hsieh, B. K. Matuszewski, H. G. Ramjit and W. F. D. Bayne, “Determination of the HMG-CoA Reductase Inhibitors Simvastatin, Lovastatin, and Pravastatin in Plasma by Gas Chromatography/Chemical Ionization Mass Spectrometry,” Biological Mass Spectrometry, Vol. 22, No. 1, 1993, pp. 1-8. doi:10.1002/bms.1200220102
- W. Jacobsen, B. Kuhn, A. Soldner, G. Kirchner, K.-F. Sewing, P. A. Kollman, L. Z. Benet and U. Christians, “Lactonization Is The Critical First Step In The Disposition of the 3-Hydroxy-3-Methylglutaryl-Coa Reductase Inhibitor Atorvastatin,” Drug Metabolism and Disposition, Vol. 28, No. 11, 2000, pp. 1369-1378.
- L. R. Lins, E. Katelijne, A. Matthys, G. Verpooten, C. P. Peeters, M Dratwa, J.-C. Stolear and H. Norbert, “Pharmacokinetics of Atorvastatin and Its Metabolites after Single and Multiple Dosing in Hypercholesterolaemic Haemodialysis Patient,” Nephrology Dialysis Transplantation, Vol. 18, No. 5, 2003, pp. 967-976. doi:10.1093/ndt/gfg048
- K. Gandelman, B. Malhotra, R. Robert, L. Crownover and T. Bergstrom, “Analytes of Interest and Choice of Dose: Two Important Considerations in the Design of Bioequivalence Studies with Atorvastatin,” Bioequivalence & Bioavailability, Vol. 3, No. 4, 2011, pp. 062-068.
- T. Ahmed, S. Kollipara, A. Gautam, R. Gigras, M. Kothari, N. Saha, V. Batra and J. Paliwal, “Bioavailability and Interaction Potential of Atorvastatin and Losartan on Co-administration in Healthy Human Subjects,” Journal of Bioequivalence & Bioavailability, Vol. 1, No. 1, 2009, pp. 018-027.
- Anonym, “AMARYL®(Glimepiride Tablets) 1, 2, and 4 mg,” 2009. http://www.accessdata.fda.gov/drugsatfda_docs/label/2009/020496s021lbl.pdf
- Anonym, “Product Monograph-Pr AMARYL® Glimepiride Tablets 1, 2 and 4 mg,” Manufacturer’s Standard, 2009. http://products.sanofi.ca/en/amaryl.pdf
- Anonym, “Product Monograph-PRLIPITOR®(Atorvastatin Calcium Tablets) 10 mg, 20 mg, 40 mg and 80 mg Atorvastatin Lipid Metabolism Regulator,” 2011.
NOTES
*Corresponding author.