Journal of Signal and Information Processing
Vol.4 No.2(2013), Article ID:30997,5 pages DOI:10.4236/jsip.2013.42020
Heart Murmur Recognition Based on Hidden Markov Model
![]()
Department of Biomedical Engineering, Luzhou Medical College, Luzhou, China.
Email: *hzwnet@126.com
Copyright © 2013 Lisha Zhong et al. This is an open access article distributed under the Creative Commons Attribution License, which permits unrestricted use, distribution, and reproduction in any medium, provided the original work is properly cited.
Received January 11th, 2013; revised February 13th, 2013; accepted February 22nd, 2013
Keywords: Heart Murmur; Wavelet Threshold De-Noising; Mel Frequency Cepstrum; Hidden Markov Model
ABSTRACT
Heart murmur recognition and classification play an important role in the auscultative diagnosis. The method based on hidden markov model (HMM) was presented to recognize the heart murmur. The murmur was isolated on basis of the principle of wavelet analysis considering the time-frequency characteristics of the heart murmur. This method uses Mel frequency cepstral coefficient (MFCC) to extract representative features and develops hidden Markov model (HMM) for signal classification. The result shows that this method is able to recognize the murmur efficiently and superior to BP neural network (94.2% vs 82.8%). And the findings suggest that the method may have the potential to be used to assist doctors for a more objective diagnosis.
1. Introduction
The heart sound signal contains much useful information which may help the clinician in diagnoses and the researcher in learning more of the heart’s function [1]. Heart sound auscultation is an important way to check the integrity of cardiac function, and the patients with heart diseases can be probably diagnosed by means of the stethoscope. Heart murmurs are auscultatory sounds produced by turbulent blood flow in and around the heart. These sounds usually signify an underlying cardiac pathology, which may include diseased valves or an abnormal passage of blood flow. Heart murmurs are classified based on their occurrence in different parts of the heart cycle [2]. The systolic murmurs occur during contraction of ventricles while the diastolic murmurs occur during their relaxation. Murmurs are noise-like events, which can appear either during systole or diastole representing different cardiac pathologies. Therefore, those murmurs have important clinical and prognostic implications in heart disease and would be regarded as one of the crucial indicators to make a definite diagnosis on a certain type of disease.
Many heart disorders can be effectively diagnosed using auscultation techniques. Most of lethal heart diseases, such as heart valve dysfunction or even in heart failureheart sound auscultation is one of the most reliable and successful tools for early diagnosis. However, in the telemonitoring heart sound system, auscultation is not feasible for its requirement of well-trained doctors. In order to facilitate the work of doctor and be suitable for long time monitoring, a computer-aided automatic heart murmurs recognition method was needed to assist doctors for a more objective diagnosis.
In this paper, we proposed a new method of heart murmur recognition based on HMM and MFCC, and did comparative study with BP neural network approach. The method includes wavelet threshold de-noising which was used to isolate murmurs by considering the frequency characteristics of the heart murmur. In order to keep the pathological information integrity, heart sound analysis is on the basis of each cardiac cycle. And the heart murmur is classified according to the type of various heart diseases.
2. Method
We use heart sound detection instrument to acquire heart sound signals. The sounds were recorded with 16-bit accuracy and 11,025 Hz sampling frequency and stored as wav form in computer. The recorded signals were first preprocessed before performing envelope extraction and segmentation. Heart sound signals were normalized according to (1) as shown below:
 (1)
(1)
where x(t) is the original signal. The square operation aims to make peak signal more prominent while weaken the noise. Here we do not apply any digital filter because the frequency of original signals has been confined in 10 to 400 by the hardware. The procedure of the heart sound recognition is shown in Figure 1.
2.1. Murmurs Separation
After various wavelets comparing experiment, we selected the coiflets 3 wavelet which got better results in murmurs separation to function based on the reconstructed factor. 5 points frequency sampling and threelevel wavelet transform is applied. The frequency bands of the details and approximations are:
1th-level details (d1): 551 Hz - 1102 Hz 2th-level details (d2): 276 Hz - 551 Hz 3th-level details (d3): 138 Hz - 276 Hz 3th-level approximations (a3): 0 Hz - 138 Hz The murmurs distribute mainly in high-frequency section, d2(276 Hz - 551 Hz)while the normal component of heart sound such as S1 and S2 distribute in low-frequency section (a3: 0 Hz - 138 Hz). The murmur and the normal component of heart sound would be separated by reconstruction because of the differences between them in the frequency. The result is shown in Figure 2.
2.2. Segmentaion of Heart Sound
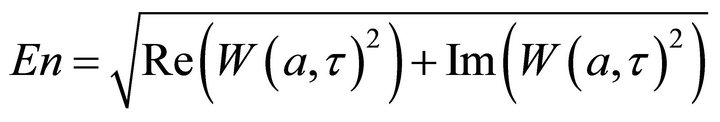
1) Envelope extraction method using Morlet wavelet Wavelet function can be regard as a band-pass filter from signal analysis perspective. Morlet wavelet is a complex wavelet and therefore the corresponding filter is a complex one. From Equation (4), the real part and the imaginary part is equivalent to a zero phase shift filter and a 90-degree phase shift filter respectively. So the real part and the imaginary part wavelet coefficients have a phase difference of 90-degree after using Morlet wavelet transformation. According to the envelope detection principle, if two signals which are in the same amplitude and their phase difference is 90-degree, the envelope can be extracted by demodulation method. The envelope amplitude can be obtained by the follow equation:
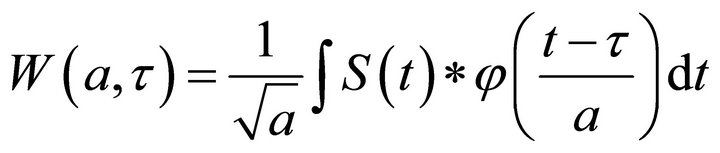 (2)
(2)
 (3)
(3)
2) Detection and classification of S1 and S2 sounds The heart sounds S1 and S2 are identified and classified through the following steps: First, set the amplitude threshold and remove the peaks whose amplitude is less than the set one. Second, calculate the first order difference of the above envelope signal and determine differential threshold. Third, find positive and negative difference pairs. Fourth, tag all of S1 and S2 locations. Fifth, S1 and S2 differentiation. Last, find the starting and ending point of S1 and S2. This method to identify the S1 and S2 has been fully explained in our earlier study [3]. Through the two procedures that mentioned above, S1 and S2 can be identified. The segmentation result is shown in Figure 3.
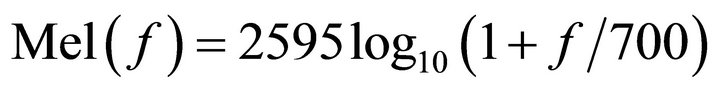
2.3. MFCC Features Extraction
The Flowchart of MFCC extraction is shown in Figure 4. MFCC coefficients were obtained by taking a discrete cosine transform (DCT) of the logarithmic spectrum scale after it was warped to the Mel scale [4] by using Equation (4). The MFCC coefficients of one heart sound cycle with mitral regurgitation are shown in Figure 5.
 (4)
(4)
2.4. Hidden Markov Model
Following feature extraction, an automatic classification process was performed by using HMM. HMM can be recorded as  and characterized by the following four parameters [5]:
1) M, the number of distinct observation symbols per state. M is the number of Gaussian mixtures denoted as .
.
2) , the initial state distribution.
3)  the state transition probability distribution.
4) B, the observation symbol probability distribution.
The typical left-to-right and four states HMM model was selected to represent heart sound signals since they were one-dimension time-varying series , and is shown in Figure 6. In order to apply this modeling technique, the heart sound cycle sequence was analyzed as the observation sequence of a hidden Markov process
 . HMM model uses Baum-Welch re-estimation to produce new parameter estimates that have equal or greater likelihood of having generated the training data, uses Viterbi algorithm to uncover the best

Figure 1. Flowchart of the heart sound recognition
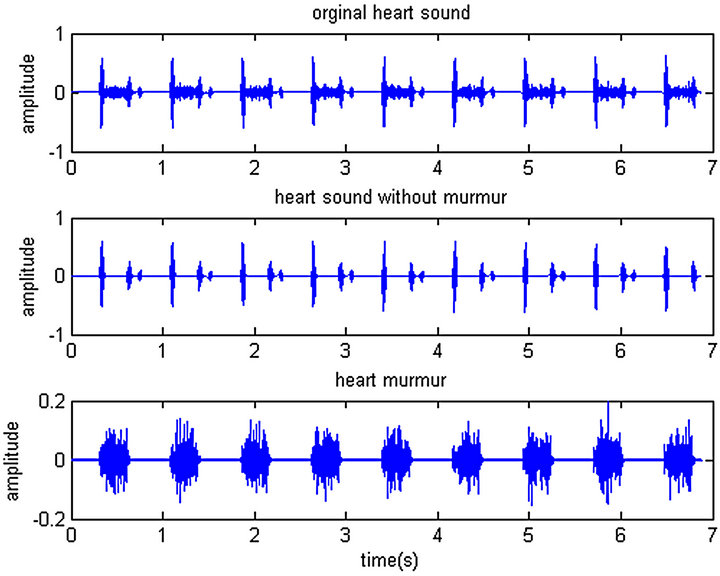
Figure 2. Separation of heart murmurs.
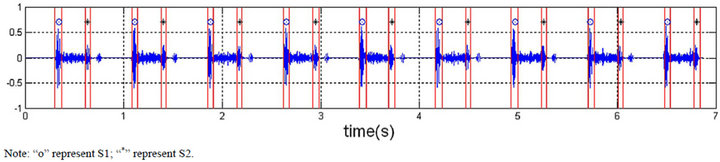
Figure 3. Segmentation of heart sound.

Figure 4. Flowchart of MFCC extraction.
state sequence that maximizes the probaility of generation of the observation sequence O, and uses forwardbackward procedure to calculate the probability .
.
3. Results and Discussions
The heart sound data set in this research contained 600 different heartbeats covering 5 types of murmurs (including mitral regurgitation, mitral stenosis, aortic regurgitation, aortic stenosis and pulmonary stenosis) and normal heart sound signals. Therefore four HMM models were trained to represent the corresponding six types of heart sounds with its component characteristic. 300 heartbeats were used to train the HMMs while 300 are left for testing, and the recognition results are shown in Table 1. And using then did comparative study with BP neural network [6] in order to prove the superiority of this method. The results and summarized are shown in Table 2.
HMM model got good performance in heart sound signals recognition, and the correct recognition rate (CCR) varies from 91.9% to 100% with the mean of 96.3% from Table 1. Furthermore, it provided much better results compared to BP neural network, an excellent CCR of 94.5% in murmurs recognition was obtained using the HMM while the CCR is only 82.5% by using BP neural network. This method was confirmed to be available for recognizing the murmur efficiently and superior to BP neural network in our study.
4. Conclusions
A new method based on hidden markov model was presented to recognize the heart murmur was presented in this paper. This method used wavelet theory to separate murmurs and normal signals, used a robust envelope extraction algorithm to heart sound segmentation and detection, extracted MFCC features and developed HMM
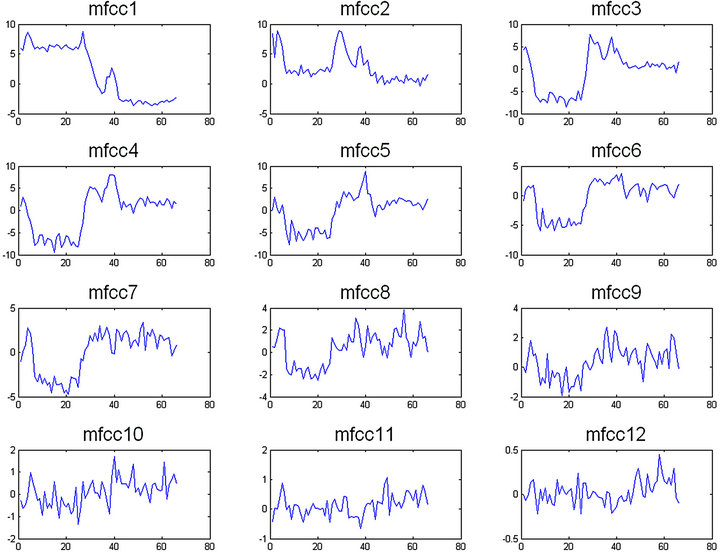
Figure 5. MFCC of one heart sound cycle with mitral regurgitation.

Figure 6. HMM of left to right type with 4 states.
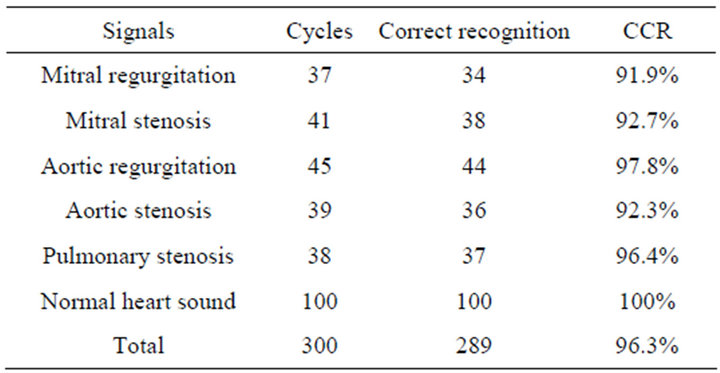
Table 1. Recognition results of heart murmur signal.
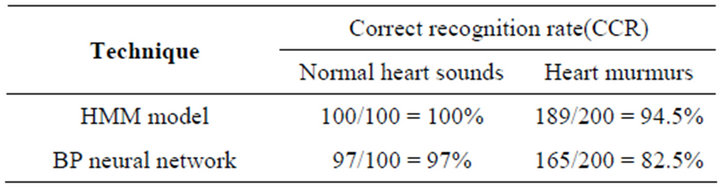
Table 2. Comparison of identification results for HMM and BP neural network.
for signal classification.
From the results obtained, this method recognized the murmur efficiently and superior to BP neural network (94.2% vs 82.8%). And it can be used in heart murmurs recognition and may have the potential to be used to assist doctors for a more objective diagnosis.
REFERENCES
- C. Jian, G. Xingming and X. Shouzhong, “Study on the Signification and Method of Heart Sound Recognition,” Foreign Medical Biomedical Engineering Fascicle, Vol. 27, No. 2, 2004, pp. 87-89.
- P. Norton and R. O’Rourke, “Approach to the Patient with a Heart Murmur,” In: G. L. Braunwald, Ed., Primary Cardiology, Elsevier, 2003, pp. 308-428.
- Z. Lisha, G. Xingming and D. Xiaorong, “A Robust Envelope Extraction Algorithm for Cardiac Sound Signal Segmentation,” Conference of the IEEE, 2010, pp. 1-5.
- S. Molau, M. Pitz, R. Schluter and H. Ney, “Computing Mel-Frequency Cepstral Coefficients on the Power Spectrum,” IEEE International Conference on Acoustics, Speech, and Signal Processing, Utah, 7-11 May 2001, pp. 73-76.
- L. R. Rabiner, “A Tutorial on Hidden Markov Models and Selected Applications in Speech Recognition,” Proceedings of the IEEE, 1989, pp. 257-286.
- T. Olmez and Z. Dokur, “Classification of Heart Sounds Using an Artificial Neural Network,” Pattern Recognition Letters, Vol. 24, No. 1, 2003, pp. 617-629.
NOTES
*Corresponding author.