Natural Resources
Vol. 3 No. 3 (2012) , Article ID: 23279 , 8 pages DOI:10.4236/nr.2012.33020
Risk and Reliability Analysis of Deepwater Reel-Lay Installation: A Scenario Study of Pipeline during the Process of Tensioning
![]()
1Offshore Oil and Gas Research Center, School of Mechanical and Transportation Engineering, China University of Petroleum, Beijing, China; 2Offshore Oil Engineering Co. Ltd., Tianjin, China.
Email: *xwhu24@gmail.com
Received June 13th, 2012; revised July 16th, 2012; accepted July 24th, 2012
Keywords: Reel-Lay Installation; Risk Analysis; Reliability Analysis; Monte Carlo Simulation; Ergonomics
ABSTRACT
In terms of reel-lay installation in deep water, studies on the pipeline during the process of tensioning have been completed based on theories of risk and reliability analysis and Ergonomics. Qualitative risk results, including minimum cut sets, structural importance and probability expression of system failure, are obtained from fault tree analysis. Also, quantitative risk results, mainly consisting of failure probability and reliability index of pipeline plastic deformation, are worked out through Monte Carlo simulation. Simultaneously, scientific suggestions based on Ergonomics are provided. Conclusions drawn from this paper can, to some extent, provide certain references for reel-lay installation in deep water.
1. Introduction
Reel-lay installation, emerging in the 20th century, is a new pipe-laying method in deep water. Recently water depth of reel-lay has reached to 2500 m and laying speed, 12 km per day. Pipeline is welded together before reeling in a specified reel. And reel shipment of pipeline is conducted later. Installation is controlled through the coworking of reel and tensioner. In the beginning, pipeline is reeled off from reel, after which it is guided to straightener through the leading of aligner. Thereafter, curved pipeline passes through straightener, which is of great help to residual curvature reduction. Finally, the pipeline enters into the sea after passing through tensioner. The above mentioned process is completed on pipe laying boats, for example, Apache. Figure 1 is a photo of Apache and Figure 2 is its schematic diagram.
However, safety and reliability problems of reel-lay installation have bothered engineers for a long time. Researches in this field are in a small quantity throughout the world. Professor Y. Bai and Q. Bai [1] have introduced integrity management into subsea system, includeing fault tree analysis and reliability analysis. But it doesn’t conduct risk analysis of reel-lay installation in detail. Limit states [2] and fatigue life assessment [3,4] of reeled risers are studied. However, they did not combine these analyses in a systematic way. In addition, reel-lay installation is relatively risky in submarine pipeline. Accordingly, studies on risk and reliability analysis of pipelines are of high necessity for the development of reel-lay installation in deep water. Based on the theory of Fault Tree Analysis, Monte Carlo Simulation and Ergonomics, risk and reliability analysis have been conducted in detail. Finally, safety suggestions to reel-lay installation were given.
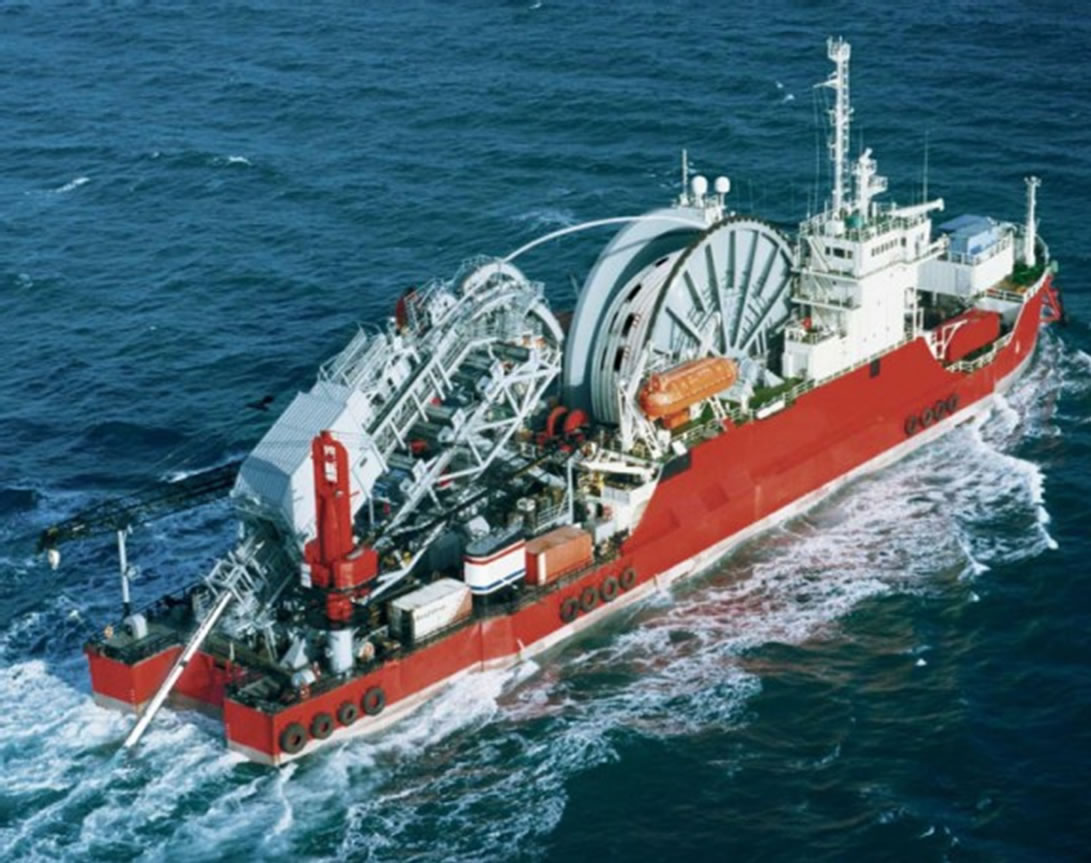
Figure 1. Apache.
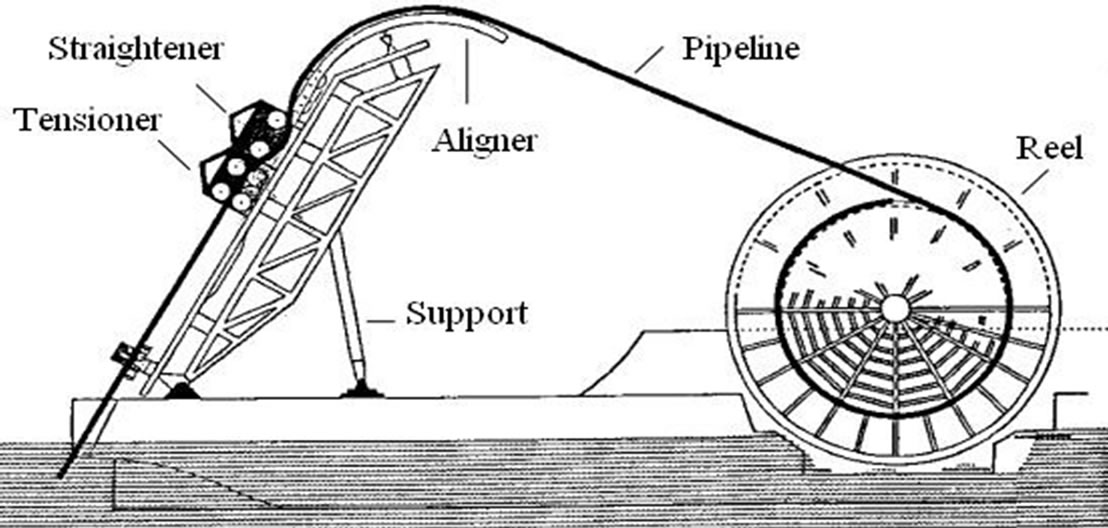
Figure 2. Sketch of reel-lay installation.
2. Risk Analysis of Reel-Lay Installation
As we all know, a variety of risky factors may lead to the failure of reel-lay installation. In order to avoid disastrous results, fault tree analysis is employed to identify risks, judge risk degrees and figure out expression of failure probability.
2.1. Basic Principle of Fault Tree Theory
Fault tree analysis is commonly used in the field of risk and reliability, adapting to complex dynamic systems [5, 6]. It can not only discover basic reasons through logical deduction, but also conduct both qualitative and quantitative risk analysis. Some terminologies and logical gates are introduced in brief.
1) Minimum Cut Set (MCS): A collection of basic events which could result in the occurrence of top undesired event. If any basic event is removed from the set, the remaining events collectively can no longer lead to top undesired event.
2) Structural Importance: Importance degree of basic event to top events is calculated in the aspect of tree structure. In this paper, structural importance is based on MCS.
3) Failure Probability of Top Event: A logic summarization of probability of basic events which could lead to top undesired event.
4) Logic AND Gate: The output event occurs if all the input events, namely E1, E2, E3, … , En, occur, shown in Figure 3.
5) Logic OR Gate: The output event occurs if at least one input event occurs, shown in Figure 4.
2.2. Fault Tree Analysis of Reel-Lay Installation
1) Establishment of Fault Tree Model Based on knowledge and experiences of reel-lay installation, fault tree model is constructed. Supposing pipeline failure during tensioning in reel-lay installation is the top undesired event, fault tree analysis is conducted from Figures 5-8. There are 30 middle events and 48 basic events, shown in Tables 1 and 2 separately.
2) Analysis of Fault Tree Model
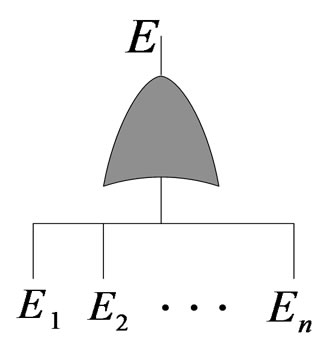
Figure 3. AND gate.
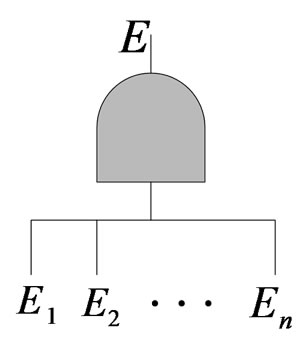
Figure 4.OR gate..
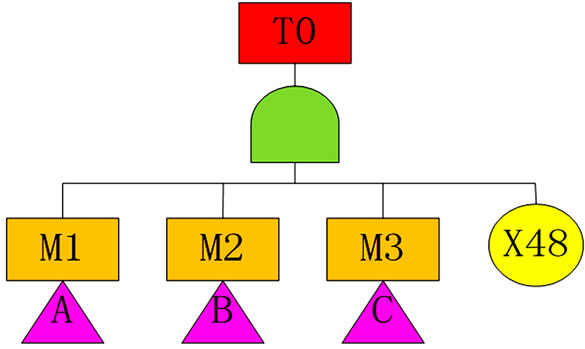
Figure 5. Fault tree of pipeline failure during tensioning.
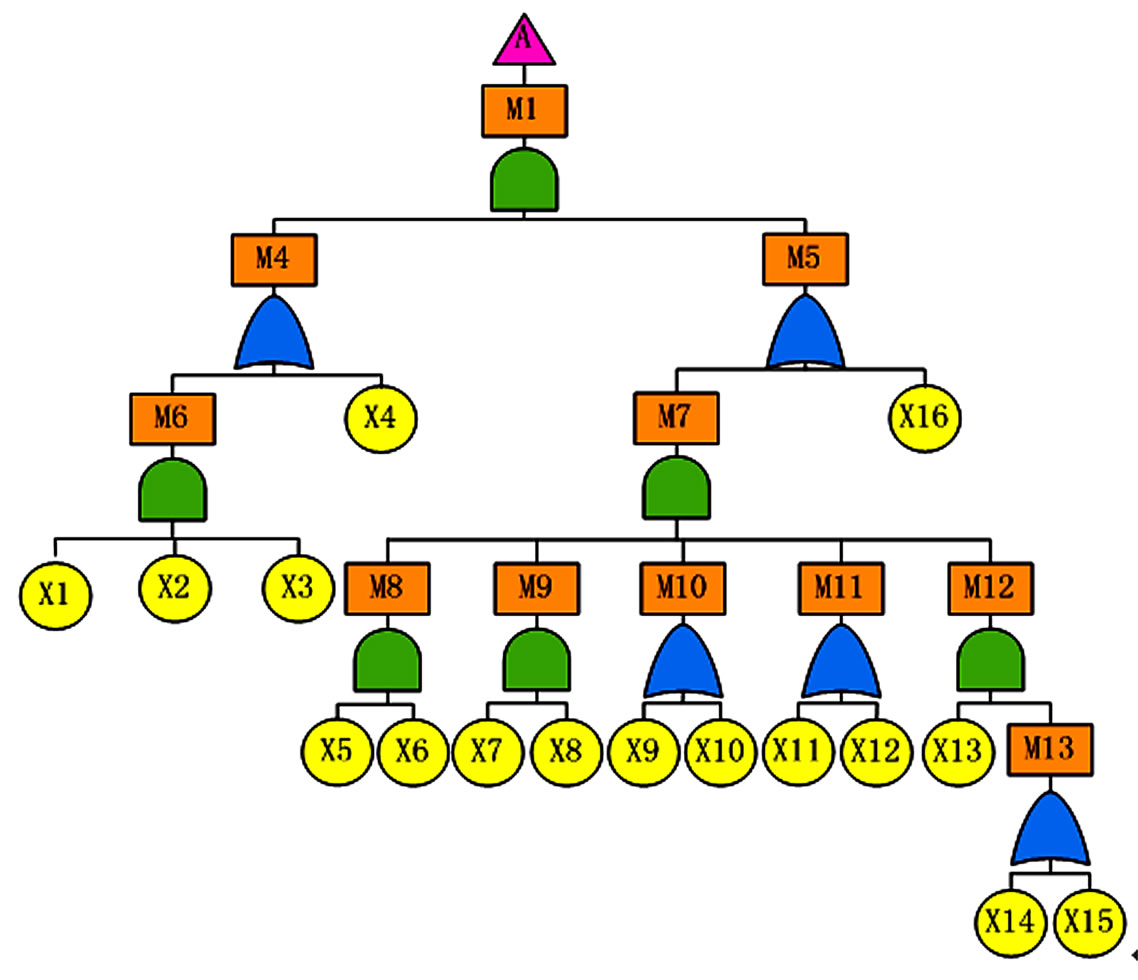
Figure 6. Sub-fault tree of overloading.
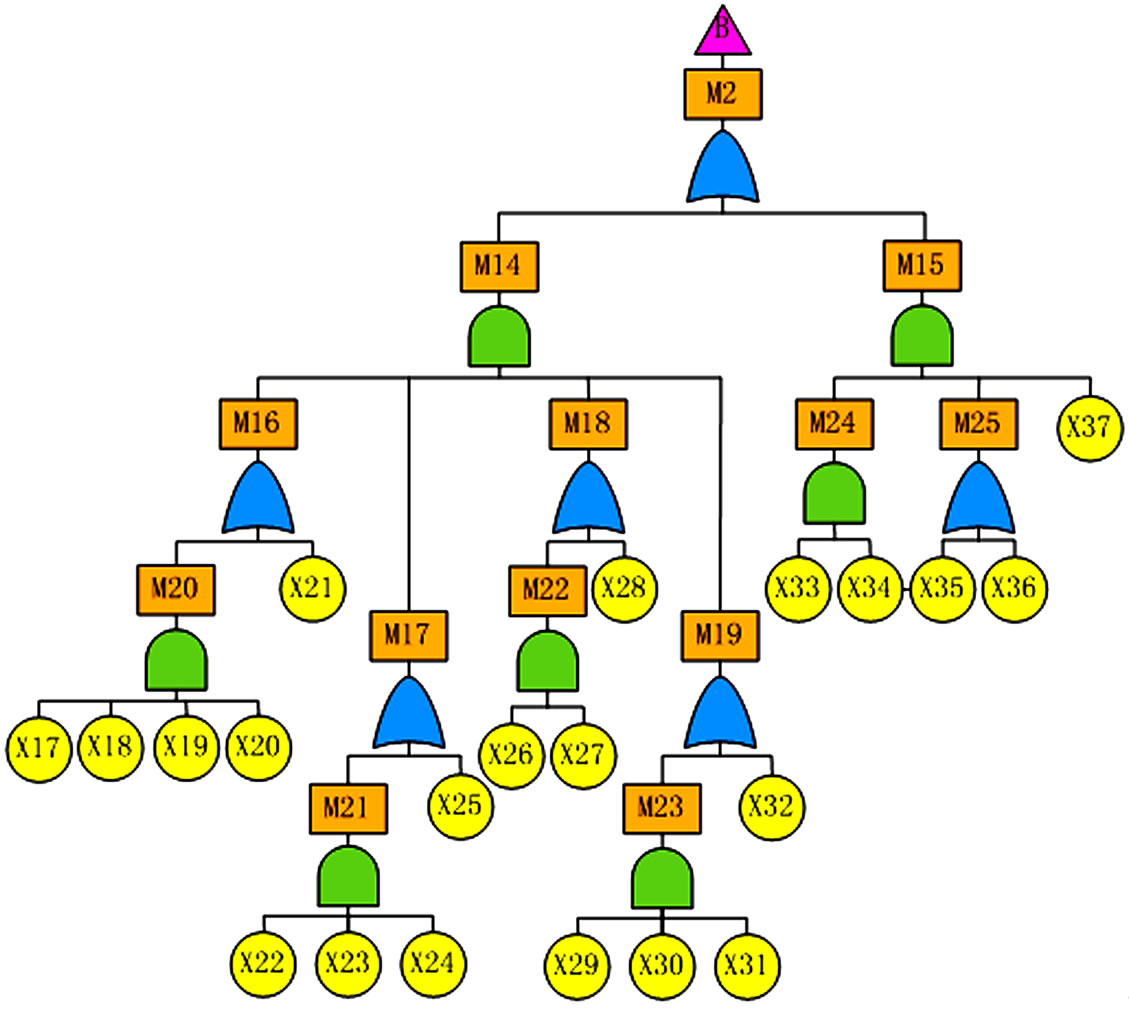
Figure 7. Sub-fault tree of management failure.
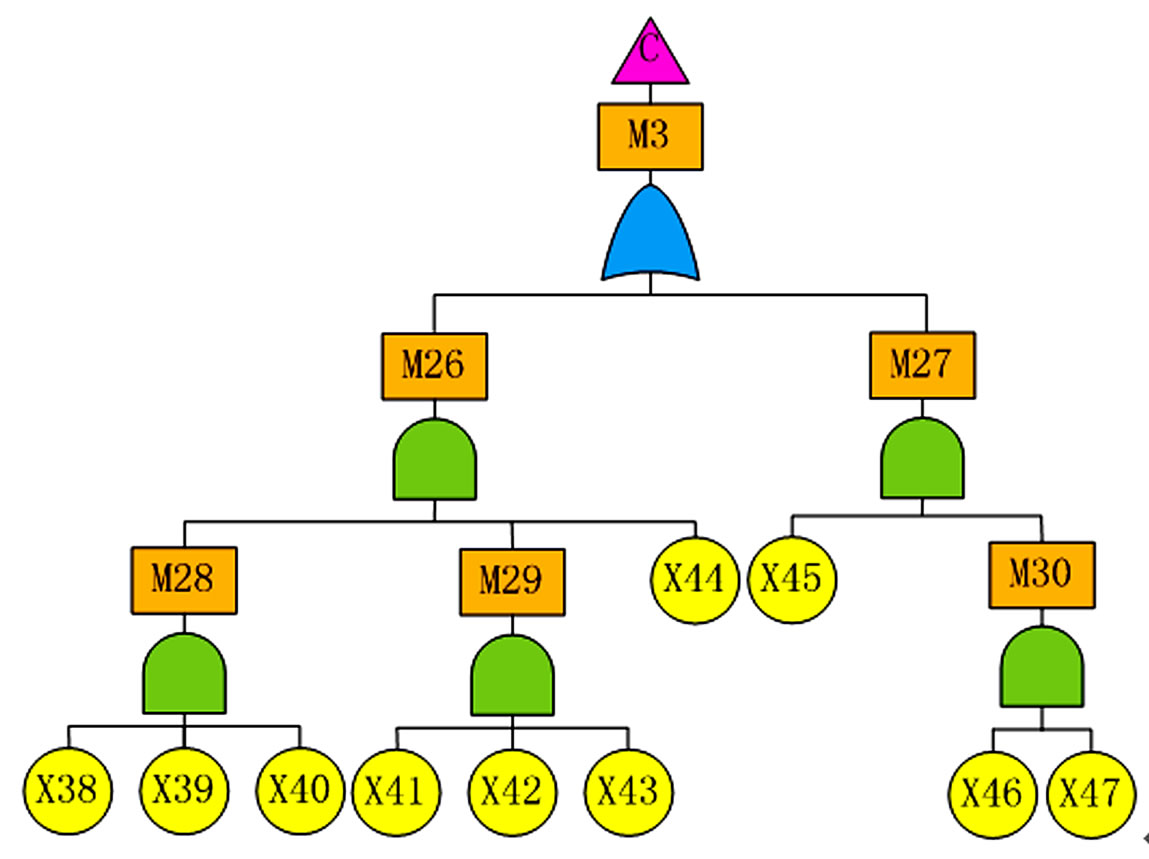
Figure 8. Sub-fault tree of the third party damage.
Table 1. Middle events of fault tree model.
Table 2. Basic events of fault tree model.
The purpose of fault tree analysis is to get the most risky basic events and value of structural importance. MCSs are obtained in the first place, on base of which, structural importance of every basic event is worked out. Also expression of failure probability is worked out through fault tree analysis.
● Minimum Cut Set Top undesired event can be simplified through rowcolumn method, shown in Equation (1).
(1)
Accordingly, MCSs are obtained, illustrated in Equation (2).
(2)
Based on the definition of MSC, the lower the order is, the more risky the MSC will be. Accordingly, the one order MSC, {X48}, is most likely to result in the failure of pipeline during tensioning. That is to say, pipeline plastic deformation failure is ought to be urgently avoided.
● Structural Importance Based on the above MCSs, structural importance can be worked out through Equation (3) and its value of every basic event can be ranked in Equation (4).
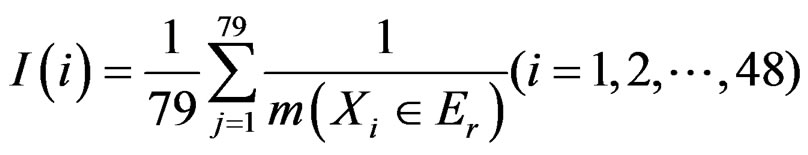 (3)
(3)
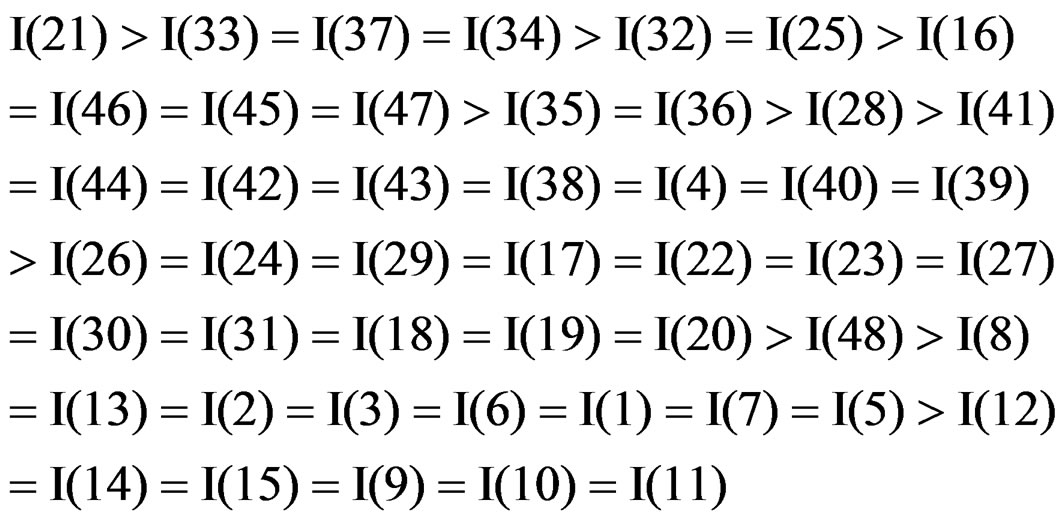 (4)
(4)
Basic events with a higher structural importance are needed to be emphasized in order to ensure the safety of pipeline during tensioning. Accordingly, we need to pay more attention to low pipeline design requirements, pipeline protection shortage, untimely detection and control of pipeline defect, etc.
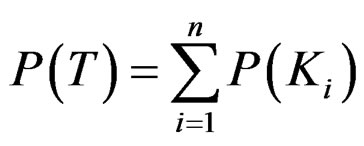
● Pipeline Failure Probability Expression of pipeline failure probability is deduced based on MCSs. Supposing K1, K2, K3, … , Kn, are MCSs, n equals 79. If probability of basic event Xi is expressed with qi = P(Xi), i = 1,2, ···,48, failure probability expression can be worked out, shown in Equation (5).
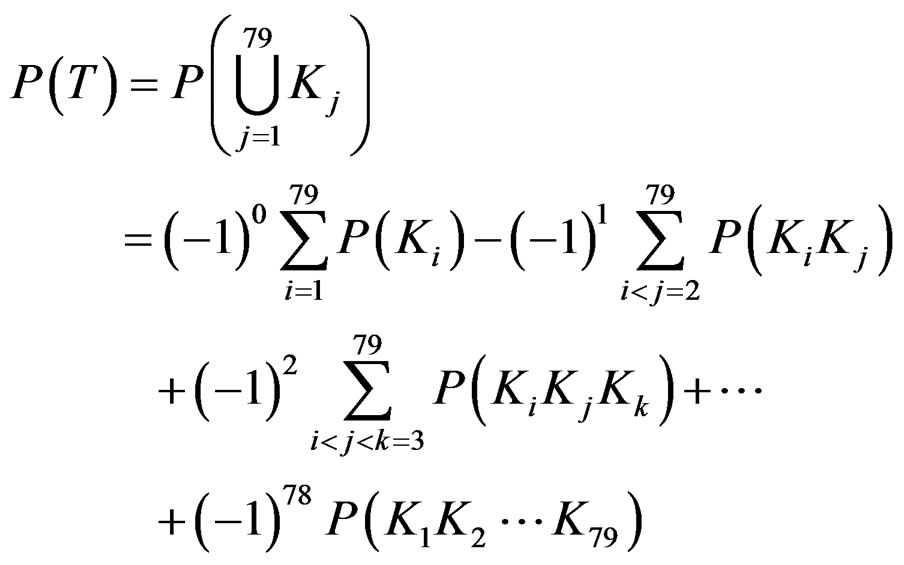
where,
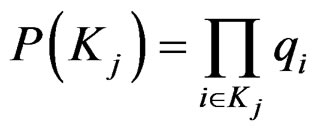 (5)
(5)
Moreover, because of low basic event probability, failure probability can be approximately calculated through Equation (6).
 (6)
(6)
3. Reliability Analysis of Pipeline Plastic Deformation Failure
The above-mentioned fault tree analysis shows that a great many reasons may cause the pipeline failure during tensioning. In particular, pipeline plastic deformation failure is regarded as the crucial one [7]. However, the limit state function of pipeline plastic deformation failure is highly nonlinear, and it is not accurate enough to calculate reliability by derivation. Therefore, Monte Carlo method based on Matlab is employed to calculate the probability of pipeline plastic deformation failure. This method is free from the restriction of nonlinearity of limit state equation and non-normality of stochastic variables, and is of high calculating precision and simplicity.
3.1. Monte Carlo Method
Monte Carlo method [8], also known as random sampling method, is a kind of approximate numerical method to calculate structure reliability through stochastic simulation and statistics. It is based on the Law of Large Numbers. Supposing X1 X2, and ... Xn are random variables coming from the same matrix, they are distributed both independently and identically. Among independent trials, total trial times are n while happening times are m. And probability is represented by P(A). When n is large enough,  is converged in μ based on probability, and frequency is converged to probability-P(A). Monte Carlo simulation is realized through Matlab below.
3.2. Calculation of Pipeline Plastic Deformation Failure Probability and Reliability Index
Plastic deformation failure is a kind of failure caused by infinite increase of deformation which turns out to be geometrically alterable after pipeline reaches some critical plastic state. The limit state function based on strengthstress model of pipeline during the process of reel-lay installation is shown in Equation (7).
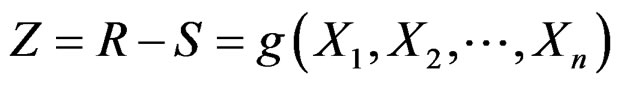 (7)
(7)
In which, random variables X1, X2, ···, Xn are various factors affecting component function, R represents strength and S, stress. When Z > 0, the component is in safe state; When Z = 0, the component is in limit state; When Z < 0, component is in failure state.
1) Limit State Function Plastic deformation, happening primarily in yield stage, is inevitable during reel-lay installation. Assume that the stress and strain relation of pipeline during the process of reel-lay obeys Ramberg-Osgood formula [9,10] shown in Equation (8).
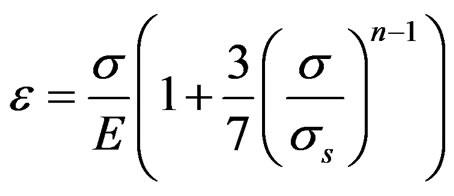 (8)
(8)
The stress expression of pipeline which suffers from pure tension is illustrated in Equation (9).
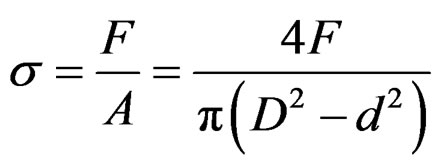 (9)
(9)
Plastic strain of pipeline, representing in the model of strength-stress, can be induced from Equation (8) and Equation (9).
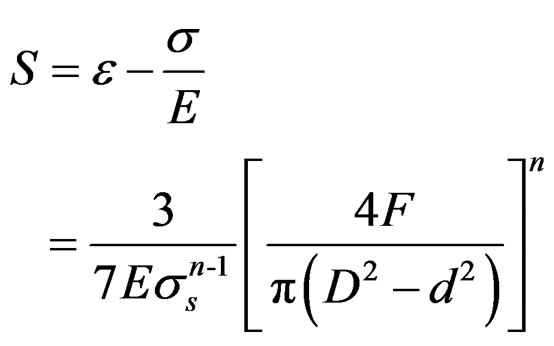 (10)
(10)
Therefore, limit state function is
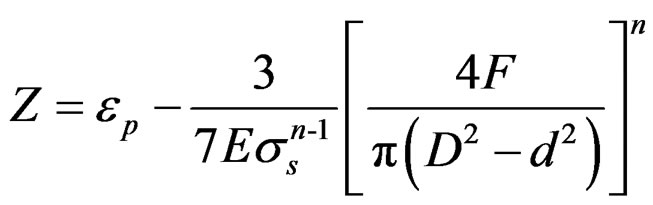 (11)
(11)
2) Calculation Example Referring to databases of a certain project in the South China sea, the steel type of pipeline is X65, outside diameter D is 0.2023 m and wall thickness is 0.012 m. According to experience and related design norms [11, 12] and research paper [13], each random variable is assumed reasonably to fit normal distribution, and the parameter values are shown in Table 3.
According to the basic principle of Monte Carlo, the calculation of failure probability through Matlab program is obtained, and its flow chart is shown in Figure 9. In this program, n represents simulation times, m represents failure times, Pf represents failure probability, β represents reliability index.
When different calculating times are taken, the corresponding failure probability and reliability index can be calculated according to Matlab flow chart in Figure 6. Results are shown in Table 4.
The more simulation times are, the more accurate result will be. Considering accuracy requirement, it is appropriate to repeat 1,440,000 times, obtaining failure probability 0.0013 and reliability 3.0103.
4. Suggestions to Reel-Lay Installation
To avoid accident during reel-lay installation, not only the above qualitative and quantitative risk analyses are needed, but also reasonable safety advices.
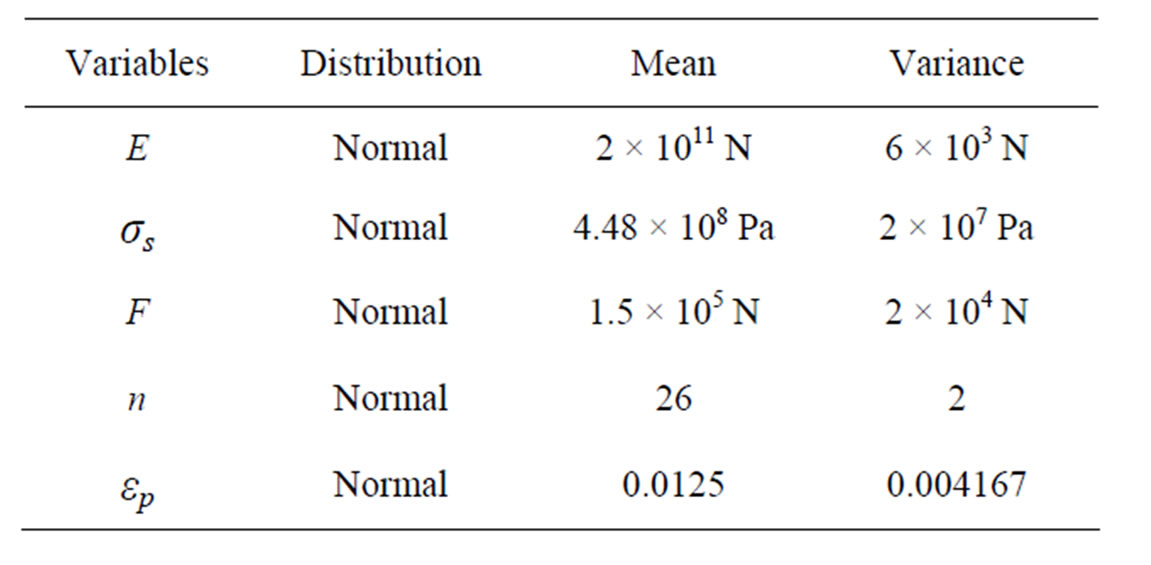
Table 3. Distribution of dimension and load variables.
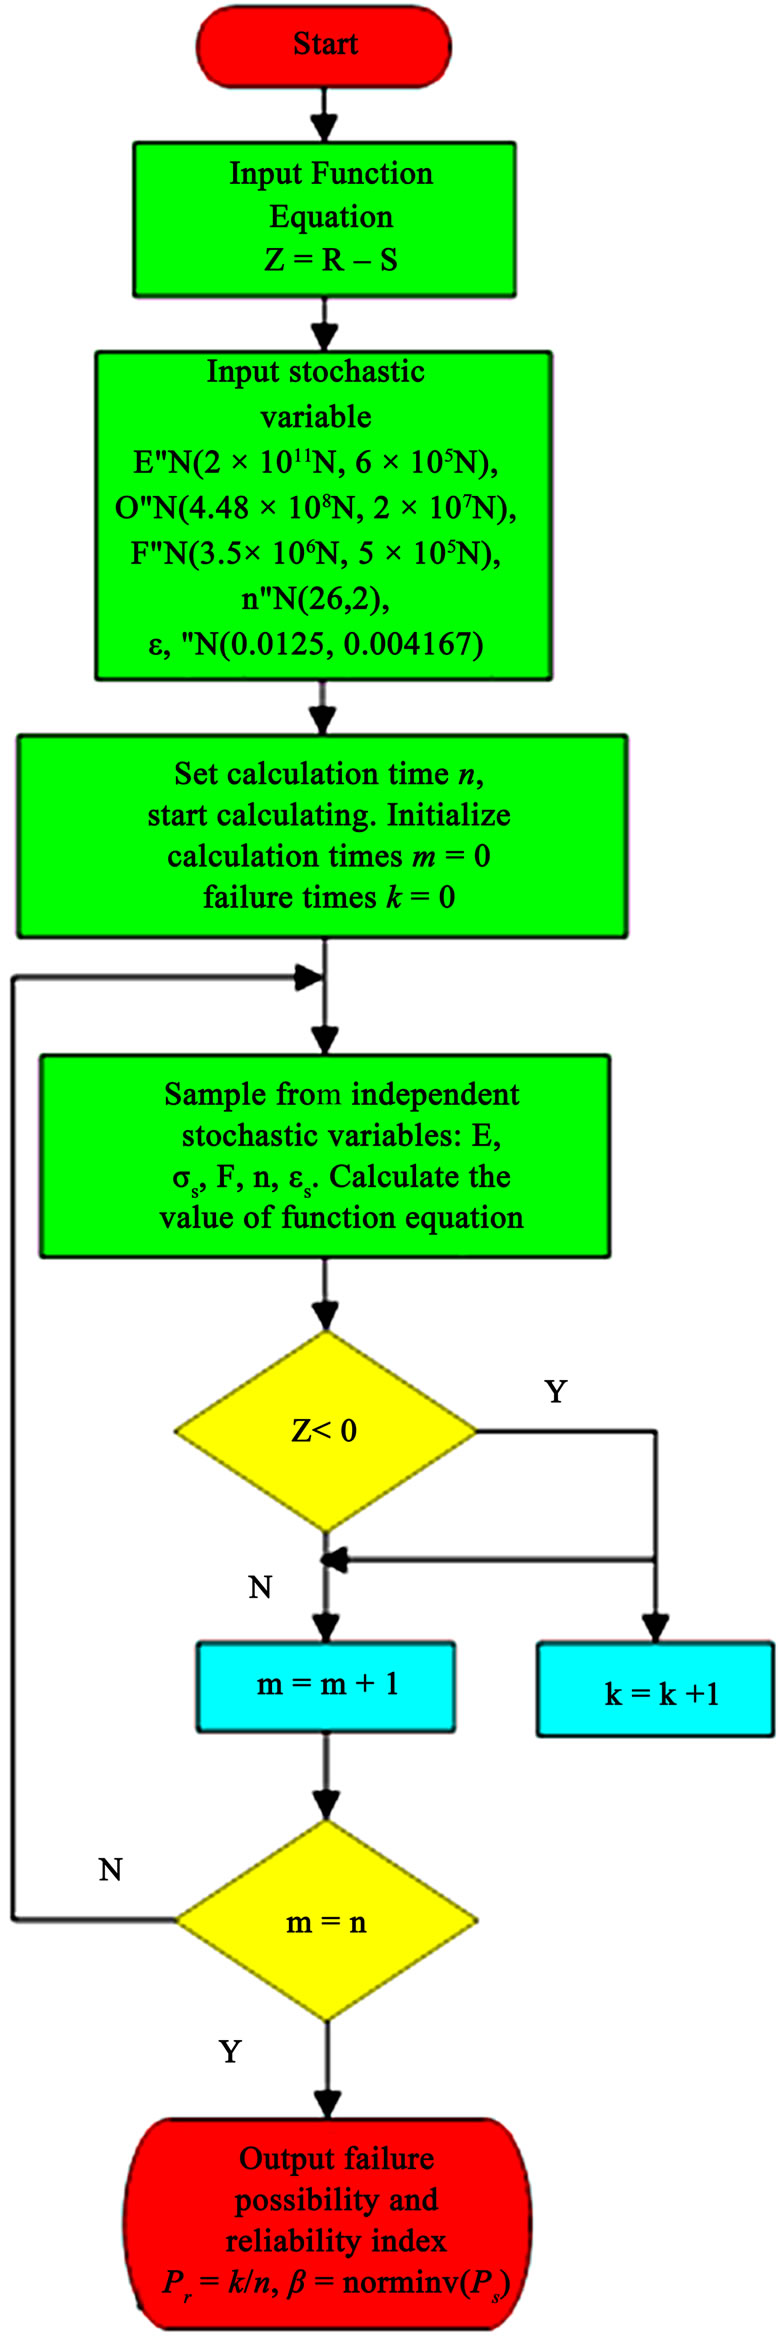
Figure 9. Program structure diagram.
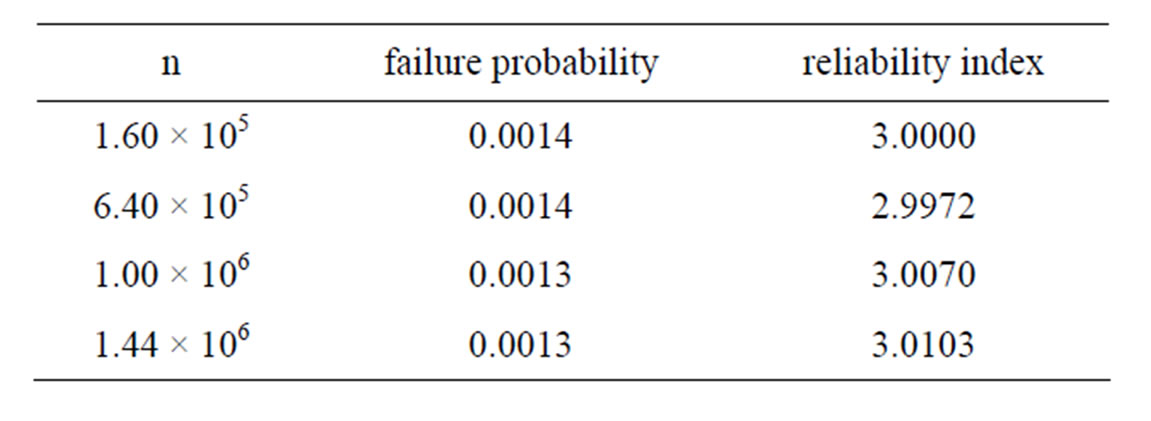
Table 4. Failure probability and reliability index.
4.1. Ergonomics on Reel-Lay Installation
Ergonomics focuses on the protection of human during the process of operation. It is mainly about how to keep balanced among human, machine and environment during manufacturing process in the aspects of physiology, psychology, biomechanics and labor-science. The main goal is to establish a reasonable and feasible humanmachine system and realize comprehensive effectiveness among security, economy and efficiency. Specifically, it provides some reasonable parameters and requirements of reel-lay installation for engineering and technology designers.
Among the working system of human, machine and environment, human is the main part. Machine is designed by human. And environment, being unchangeable, will influence the work of human and machine to some extent. Taking the factors which influence the above three aspects into consideration, the structure figure of “human-machine-environment” system during reel-lay installation is shown in Figure 10.
Recently, the main problems existing in the humanmachine design of reel-lay system include low quality of safety management, incomplete operation rules, inadequate operator training, unfriendly man-machine interface, etc. Research based on Ergonomics pays more attention to human factor in the process of reel-lay installation. It is of great significance and application prospects. Also it is the concrete manifestation of “human oriented” safety management concept. Some safety suggestions are put forward, aiming at developing reel-lay installation.
4.2. Safety Suggestions to Reel-Lay Installation
Human, as a subjectivity factor in this system, should be highlighted in the design of reel-lay installation [14]. Moreover, machines should be designed to adapt to human [15]. Consequently, the following factors based on both Ergonomics and above analyses should be considered in the process of design.
1) It is of necessity to apply appropriate pipeline design requirements, that is to say, pipeline should be strictly designed based on standards, such as DNV-OSF101, ASME B31.4, ASME B31.8, etc.
2) Proper protection methods should be applied on the pipeline, such as corrosion protection, vibration protection, etc. Moreover, pipeline installation should be protected from workers’ misoperation, which can be
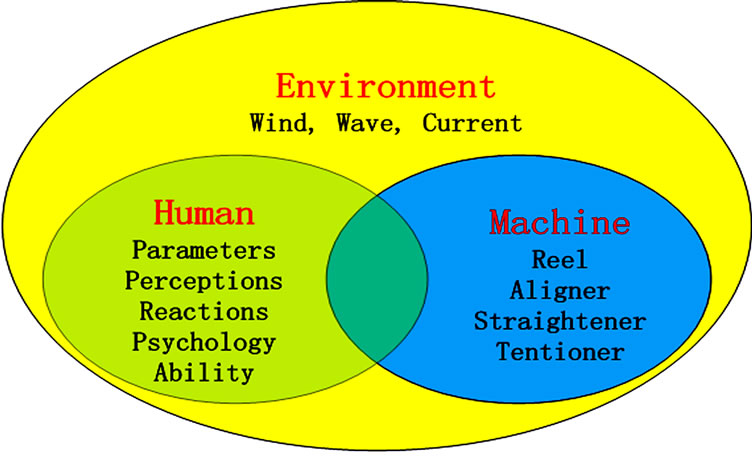
Figure 10. Human-machine-environment system.
achieved by additional protection facilities.
3) Pipeline should be timely detected during installation. In order to avoid undesired structure failure, it is better to periodically detect key parameters of pipeline, such as stress, strain, etc.
4) Humane factors should be fully taken into consideration in reel-lay installation, including body parameters, perception, reaction, psychology and working characteristic, etc.
5) Facilities used in reel-lay installation should be designed to adapt to various environments. That is to say, sea wind, waves, currents and other environment load should be considered to ensure that these facilities work well in bad environment.
6) Operators should receive necessary sea education and training in order to improve their working abilities, safety awareness, knowledge and skills, ensuring better adapting ability of operators to various environmental factors.
5. Conclusions
Qualitative results, including MCSs, structural importance and probability expression of system failure, are obtained from fault tree analysis through the establishment of fault tree model. In fault tree analysis, failure of pipeline during tensioning in reel-lay installation is regarded as top undesired event, which mainly results from four reasons, namely overloading, management failure, third-party damage and plastic deformation failure. These four aspects have been analyzed in detail to work out basic events of pipeline failure through deduction. Accordingly, fault tree model of pipeline failure is completed, leading to the qualitative risk analysis of reel-lay installation. Also, quantitative results are worked out through Monte Carlo simulation, including failure probability and reliability index of pipeline plastic deformation. Monte Carlo simulation is efficiently conducted through Matlab. The more simulation times are, the better results will be. Therefore, a large number of simulations have been conducted through Matlab, obtaining a relatively accurate result. Finally, considering the relationship among human, machine and environment, proper suggestions based on Ergonomics are provided. These suggestions focus on not only the development of a friendly interface between operators and installation facilities, but also a better adaption between operators and environment. In summary, main conclusions are summarized as follows.
1) The fault tree of reel-lay installation includes 10 oneorder minimum cut sets, 29 two-order minimum cut sets and 38 three-order minimum cut sets and 12 four-order minimum cut sets. Pipeline plastic deformation failure should receive more attention because of its low order in minimum cut sets.
2) The higher the structure importance is, the more risky the basic event is. According to the rank of basic events’ structure importance index, low pipeline design requirements, pipeline protection shortage, untimely detection and control of pipeline defect are relatively risky among all the factors.
3) According to reliability analysis, failure probability of pipeline plastic deformation is 0.0013 and its reliability index is 3.0103. It is acceptable in industry, implying that pipeline plastic deformation is reliable during reel-lay installation.
4) Scientific reel-lay installation should not only pay attention to the above-mentioned results from risk and reliability analysis, but also comprehensively take human, machine and environment into account. Accordingly, safety suggestions are provided, emphasizing the role of human in reel-lay installation.
6. Acknowledgements
This paper is financially supported by the National Basic Research Program of China (973 Program, Grant No. 2011CB013702). The authors would like to thank Dr. Jiuju Zhang for her critical reading of the manuscript.
REFERENCES
- Y. Bai and Q. Bai, “Subsea Pipelines and Risers, Elsevier Ocean Engineering Book Series,” Elsevier, Amsterdam, 2005, pp. 751-785. doi:10.1016/B978-008044566-3/50042-7
- S. Manouchehri, B. Howard and S. Denniel, “A Discussion of the Effect of the Reeled Installation Process on Pipeline Limit States,” Proceedings of the Eighteenth International Offshore and Polar Engineering Conference, Vancouver, 6-11 July 2008, pp. 53-59.
- T. A. Netto and M. I. Lourenco, “Fatigue Life Assessment of Reeled Risers,” Offshore Technology Conference, Houston, 30 April-3 May 2007, pp. 1-7. doi:10.4043/18482-MS
- H. A. Ernst, et al., “Probabilistic Fracture Mechanics Methodology Applied to Pipes Subjected to Multiple Reeling Cycles,” Proceeding of the 17th International Offshore and Polar Engineering Conference, San Diego, 10-15 June 2007, pp. 3216-3224.
- J. D. Andrews and M. T. Robert, “Reliability and Risk Assessment,” Professional Engineering Publishing, Hong Kong, 2008, pp. 201-267.
- A. Shahriar, et al., “Risk Analysis for Oil & Gas Pipelines: A Sustainability Assessment Approach Using Fuzzy Based Bow-Tie Analysis,” Journal of Loss Prevention in the Process Industries, Vol. 25, No. 3, 2012, pp. 505-523. doi:10.1016/j.jlp.2011.12.007
- P. F. Liu, et al., “Failure Analysis of Natural Gas Buried X65 Steel Pipeline under Deflection Load Using Finite Element Method,” Materials and Design, Vol. 31, No. 3, 2010, pp. 1384-1391. doi:10.1016/j.matdes.2009.08.045
- D. B. Kececioglu, “Reliability Engineering Handbook,” Vol. 1, DEStech Publications, Inc., Pennsylvania, 1991.
- B. Champagne and D. Smith, “The BP Bombax Pipeline Project-Design for Construction,” Offshore Technology Conference, Houston, 5-8 May 2003, pp. 1-8. doi:10.4043/15271-MS
- N. Mostaghel and R. A.Byrd “Inversion of Ramberg— Osgood Equation and Description of Hysteresis Loops,” International Journal of Non-Linear Mechanics, Vol. 37, No. 8, 2002, pp. 1319-1335. doi:10.1016/S0020-7462(02)00025-2
- API Specification 5L, “Specification for Line Pipe,” 42 Edition, American Petroleum Institute, Washington DC, 2000, pp. 27-76.
- DNV-OS-F101, “Submarine Pipeline Systems,” Det Norske Veritas, Norway, 2000, pp. 27-45.
- T. Tkaczyk, et al., “A Non-Linear Fracture Assessment Procedure for Pipeline Materials with a Yield Plateau,” Proceedings of the 19th International Offshore and Polar Engineering Conference, Osaka, 21-26 June 2009, pp. 100-109.
- M. Green, “Experience in Incorporating Human Factors into the Control Center Design Process,” An International Conference on Human Interfaces in Control Rooms, Manchester, 19-21 June 2001, pp. 19-24.
- G. Savendy, “Handbook of Human Factors and Ergonomics,” John Wiley & Sons, Inc., Hoboken, 2006. doi:10.1002/0470048204
Nomenclature
d Inner diameter of pipeline.
D Outer diameter of pipeline.
E Elastic modulus.
F Tensile load.
n Ramberg-osgood index.
 Yield strength.
 Plastic strain limits distribution.
mi Number of basic events of a minimum cut set.
I(i) Structural importance of a basic event.
TDP Touch down point.
NOTES
*Corresponding author.