Open Journal of Social Sciences
Vol.03 No.10(2015), Article ID:60388,7 pages
10.4236/jss.2015.310009
The Empirical Study on the Relationship between Listed Companies’ Private Placement and Operating Performance
―Based on the Empirical Data from 2009 to 2014
Guoxi Wang*, Yanhong Li
School of Economics, Jinan University, Guangzhou, China
Email: *1289943032@qq.com
Copyright © 2015 by authors and Scientific Research Publishing Inc.
This work is licensed under the Creative Commons Attribution International License (CC BY).
http://creativecommons.org/licenses/by/4.0/


Received 30 September 2015; accepted 16 October 2015; published 20 October 2015
ABSTRACT
After the generation of private placement system, it is popular with the securities market and listed companies, it has become one of the main channels for enterprises to carry out equity refinancing, domestic scholars’ studies mainly focus on the purchase discount, big shareholders’ profit transfer problems, and problems with the company’s short-term effect, articles about private placement and operate performance are not enough, conclusions are also different, so it is very necessary for the empirical study on the relationship between listed companies’ private placement and performance by using the private placement experience of western countries and combining the reality of the capital market’s development of China. In this paper, by using factor analysis method and using Chinese A-share listed companies who have implemented private placement in 2010 as the samples, through calculating the samples’ comprehensive performance score from 2009 to 2014 and its average ranking non-parametric test, the results show that whether in the short or long term, private placement has a negative effect on companies performance, but the effect is not significant in statistics, the results will be more of reference value and practical significance, this paper will be beneficial for investors, the market regulator and the private placement’s follow-up study.
Keywords:
Private Placement, Operating Performance, Financial Indicators, Factor Analysis

1. Introduction
In America, England and other western countries, private placement has become a popular way of equity refinancing since the 1990s. In China, private placement is still an emerging thing, it is still not sound from the IPO mechanism to market regulation mechanism, and related theory researches are also not mature. Along with the smooth completion of the reform of non-tradable shares, The China Securities Regulatory Commission issued “measures for the administration of securities issuance of listed company” on May 8, 2006, from then on, as an equity refinancing way, private placement enters into a rapid development track, it is very popular with the securities market and listed companies and it has become the mainstream channel of equity refinancing. By the end of the June 18, 2015, listed companies have carried out 1900 private placement.
2. Literature Review
Western scholars mainly analyze the relationship between listed companies’ private placement and operating performance with three theories which include supervision effect theory, information asymmetry theory and behavioral finance theory. Scholars who support supervision effect theory think that investors who are new shareholders of the private placement companies should own the stock for a certain time; this rule can prompt these investors to supervise the company’s management, which is helpful to improve the company’s management level and performance. Wruck [1] researched 99 private placement which happened in America from 1980 and 1988, and he found that shareholders’ average cumulative excess return rose significantly in 15 days before the declaration date, and the average cumulative excess return rose to 1.9 percent, the wealth effect reached about 4.5 percent, the author thought that the active investors’ participation had the desire and ability to supervise the management of listed companies, and which could prompt managers’ goals to be consistent with shareholders’ interests, this could delivery positive signals to the outside world and promote the company’s share price. Scholars who support information asymmetric theory think that the company’s project information can be passed to the market by private placement, which can reduce the information asymmetry problem. Hertzel and Smith [2] found that the private placement cumulative excess return was 3.28 percent during the period of (−9.0), 8.78 percent during the period of (−29.10), in author’s opinion, the explanation for the positive influence was that there was information asymmetry phenomenon between the insiders of the enterprise and outside investors. If specific investors thought that there was a good investment opportunities in private placement enterprises, they would choose to invest these enterprises. According to the specific investors’ behavior, market investors would think that the private placement company’s stock price was undervalued; therefore, private placement meaned that listed companies had good investment opportunities and positive earnings. Behavioral finance theory is a combination of behavioral science theory and finance, which explains, researches, and forecasts the development of financial markets from the microcosmic individual behavior and its psychology. Marciukaityte et al. [3] thought that when the company raised money by private placement, the company may invest in some projects whose net cash flows were negative or whose management risk was larger, which resulted in the private placement companies’ long term performance decline .
Domestic scholars mainly analyzed the relationship between listed companies’ private placement and operating performance with the announcement effect and the supervision effect. Shoufu Xu [4] found that the listed company’s stock cumulative excess return was about 8 percent within 7 days before the private placement pre- arranged planning date of declaration, private placement had obvious promotion effect on corporate performance in the short term. The author pointed out that big shareholders who subscribed for increasing the stock proportion would have supervision effect on operation and management of listed companies, which could improve the efficiency of investment and the value of the company. Weidong Zhang and Anqi Zhao [5] found that since the investors should possess the stocks for a certain time, investors would carry on a series of investigation about private placement companies to ensure the positive earnings, the participants who took part in the private placement with assets could reduce horizontal competition and related party transactions, which could promote the company’s performance, therefore, private placement had positive long term wealth effect. Yusheng Kong [6] studied the growth change of private placement companies from 2009 to 2011, as a result, there was no obvious change about the overall growth of listed companies before and after private placement, the author thought that most private placement was project financing, the project cycle was longer, and the company’s performance was uncertain.
Through the above literature review at home and abroad, we can find that foreign scholars have had systematic research about the private placement, however, since the private placement’s history is short in our country, and the capital market development is imperfect, domestic scholars’ study on the relationship between listed companies’ private placement and operating performance is not enough, and the research time interval is short, conclusions are also different, in this paper, I study the private placement company’s comprehensive performance ranking changes from 2009 to 2014, the results will be of more reference value and practical significance, this paper will also be beneficial for investors, the market regulator and the private placement’s follow-up study.
3. The Selection of Sample Data and the Design of Index System
3.1. The Selection of Sample Data
This paper’s total samples are all the 2024 a-share listed companies before December 31, 2010. For the 2024 companies in this paper, I select as follows: ① Eliminate financial companies, because the financial enterprises’ business content are different from the ordinary enterprises; ② Eliminate ST and *ST companies, because these kinds of enterprises’ finance is easy to be manipulated; ③ Eliminate these companies who carry on public offering, rationed shares, convertible bonds; ④ Eliminate these companies who carry on private placement other than the year of 2010; ⑤ Eliminate these companies who carry on private placement twice in 2010; ⑥ Eliminate these companies who have abnormal value. In the end, I get 1110 suitable companies including 77 companies who carry on private placement in 2010. In this paper, all sample companies and financial index data are from Wind database.
3.2. The Design of Index System
This article analyze the company’s financial condition and operating performance from the earning power, debt- paying ability, operation ability, cash flow ability, growth ability, these five aspects include 11 financial indicators and the indicators are defined as follows:
① Earning Power: X1 = rate of return on common stockholders’ equity = net profit attributable to the parent company shareholders * 2/(initial net profit attributable to the parent company shareholders + final net profit attributable to the parent company shareholders). X2 = rate of return on total assets = net profit (include minority interest income)*2/(initial total assets + final total assets).
② Debt-paying Ability: X3 = liquidity ratio = liquid assets/liquid liabilities. X4 = quick ratio = (liquid assets − net inventory)/liquid liabilities. X5 = asset/liabilities = total assets/total liabilities.
③ Operation Ability: X6 = liquid asset turnover = total operating income * 2/(initial liquid assets + final liquid assets). X7 = total asset turnover = total operating income * 2/(initial total assets + final total assets).
④ Cash Flow Ability: X8 = net business activities generated cash flow per share = net business activities generated cash flow/Total equity. X9 = sales cash ratio = net business activities generated cash flow/operating income.
⑤ Growth Ability: X10 = rate of return on common stockholders’ equity (dilution) year-on-year growth rate = (current period rate of return on common stockholders’ equity (dilution)-the same period of last year rate of return on common stockholders’ equity (dilution))/the same period of last year rate of return on common stockholders’ equity (dilution). X11 = net profit attributable to the parent company shareholders year-on-year growth rate = (current period net profit attributable to the parent company-the same period of last year net profit attributable to the parent company)/the same period of last year net profit attributable to the parent company.
4. Research Methods and Model Specification
This paper is based on the enterprises’ financial data from 2009 to 2014, 1110 sample companies’ financial index respectively minus the corresponding industry average financial indicators to reduce the impact of the boom of industry on the company’s ranking, then I use the factor analysis to build the listed company performance comprehensive score model, in this way, I can calculate the overall 77 private placement companies average compre- hensive performance score ranking.
In all sample companies, I use descriptive statistics and nonparametric test to study the company’s overall comprehensive performance ranking changes before and after the private placement.
Factor analysis mainly extracts the original variable overlap portions and assembles them into the minority representative factors to achieve the purpose of reducing the number of variables, this article changes the 11 financial indicators for dimensionality reduction, the principle is that cumulative variance contribution rate is more than 80 percent, I extract five common factors, and take the proportion of each main factor variance contribution rate in total variance contribution rate as weight, so I get the financial performance comprehensive score model:

In the formula, Qi means the i company’s comprehensive performance score, βj means the j common factor variance contribution rate, Fij means the i company j common factor score, finally according to the total score of each sample, I rank them and make an analysis.
5. Empirical Analysis
In this paper, I use the factor analysis method, and use Chinese A-share listed companies which have implemented private placement in 2010 as the samples, through calculating the samples’ comprehensive performance score from 2009 to 2014 to analysis these companies’ development condition, this paper adopts SPSS19.0 for factor analysis, I analyze data in 2010 as an example.
5.1. Factor Analysis Suitability Test
In this paper, I use the KMO and Bartlett’s test to examine whether the original relevant variables are suitable for factor analysis, KMO test is used to compare simple correlation coefficient and partial correlation coefficient between variables, The bigger the KMO value is, the greater the common factors between variables are, the more suitable for factor analysis. If its value is less than 0.5,then it is not suitable for factor analysis, Bartlett’s test is calculated according to the correlation coefficient matrix determinant, and it approximately obey the chi- square distribution, if the statistic observation is bigger, and the given probability p value is less than the given significant level a, then we can think that correlation coefficient matrix is unlikely to be the unit matrix, the original variables are suitable for factor analysis, otherwise, the original variables are not suitable for factor analysis.
We can see from Table 1, KMO = 0.550 > 0.5,the value of Bartlett’s test is 10911.212, p = 0.000, the two indexes all meet the requirements, the original variables are suitable for factor analysis (Table 1).
5.2. The Number of Factors to Determine
As the applicability of the factor analysis test passed, I use the SPSS19.0 to analyze data, and I get the interpretation total variance for Table 2:
Factor’s variance contribution rate is a key indicator to measure the importance of factor, the higher the variance contribution rate, the more relevant financial information the corresponding factor can reflect, we can see from the Table 2, the five factors’ cumulative variance contribution rate reaches 82.326 percent, which can reflect the 11 variables most information, and have a better explanation ability, therefore, in this article, I choose five common factors to go on analysis.
5.3. The Factor Named
In this paper, I carry on orthogonal rotation about component matrix by using varimax method to make the factor named explanatory, then I output factor loading after rotation according to the first factor loading matrix in descending order, as Table 3 shows, the common factor variables have a higher load.

Table 1. The KMO and Bartlett’s test.
Table 2. Interpretation total variance.
Extraction method: principal component analysis.
Table 3. Rotate component matrixa.
Extraction method: principal component analysis; Rotation method: Kaiser standardized orthogonal rotation method; aRotating convergence after five iterations.
According to Table 2 and Table 3, the expression of the company comprehensive performance score in 2010 is the following:
Q2010 = 0.3197 * F1 + 0.1967 * F2 + 0.1891 * F3 + 0.1713 * F4 + 0.1233 * F5
In this way, the other expressions of the company comprehensive performance score are the following:
Q2009 = 0.3195 * F1 + 0.2214 * F2 + 0.1921 * F3 + 0.1377 * F4 + 0.1292 * F5
Q2011 = 0.3262 * F1 + 0.2166 * F2 + 0.1864 * F3 + 0.1564 * F4 + 0.1145 * F5
Q2012 = 0.2924 * F1 + 0.2036 * F2 + 0.18 * F3 + 0.1776 * F4 + 0.1464 * F5
Q2013 = 0.2936 * F1 + 0.2013 * F2 + 0.1793 * F3 + 0.1749 * F4 + 0.1509 * F5
Q2014 = 0.3073 * F1 + 0.1973 * F2 + 0.1837 * F3 + 0.171 * F4 + 0.1407 * F5
5.4. The Comparative Analysis of the Company Comprehensive Performance Score before and after the Private Placement
According to the expression of the company comprehensive performance score from 2009 to 2014, for the 77 private placement companies ranking situation in 2010, I analyze them as follows:
We can see from Graph 1, the company ranking mean appears a continuous decline from 2010 to 2012, and the company ranking mean is higher in 2013 and 2014 compared with 2011 and 2012, but lower than 2009, this shows that the private placement doesn’t improve the company performance. In order to rule out the maximum and minimum’s influence on mean, from the list of median, we can see that compared with the ranking mean, the data has improved, but compared with 2009, the company performance’s improvement isn’t obvious, I use the Wilcoxon matched-pairs signed-ranks test to examine whether the result of the ranking is significant or not.
We can see from Table 4, the company’s development is better in 2013, but the data is worse in other years, Table 5 shows that the probability p values is less than 0.05 in 2012 year ranking-2009 year ranking, therefore, the listed companies performance ranking does not differ significantly before and after the private placement, the private placement will not significantly affect companies’ performance.
6. Conclusion and Suggestions
In this paper, using factor analysis method and using Chinese A-share listed companies which have implemented private placement in 2010 as the samples, through calculating the samples’ comprehensive performance score from 2009 to 2014 and its average ranking non-parametric test, the results show that whether in the short or long term, private placement has a negative effect on companies performance, but the effect is not significant in statistics. Although the private placement has a series of advantages than other refinancing way, we should recognize that in order to improve the company’s performance, the main method is to strengthen the corporate governance and enhance their core competitiveness, rather than only hope that the private placement can completely improve corporate performance.
Along with this article research conclusion, I come up with the following suggestions: Firstly, the China Securities Regulatory Commission should strengthen the approval and supervision of the private placement, such as the private placement price, major shareholders injection assets quality, big shareholders related interests transmission problems, compliance on money raised direction for use, guide of the listed companies to choose the right ways of equity refinancing, the relevant units should strengthen supervision about those companies who have carried out the private placement to protect the interests of the investors. Secondly, the China Securities Regulatory Commission should improve the system of private placement inquiry to ensure the impartiality of the private placement price. Thirdly, the China Securities Regulatory Commission should strengthen the listed
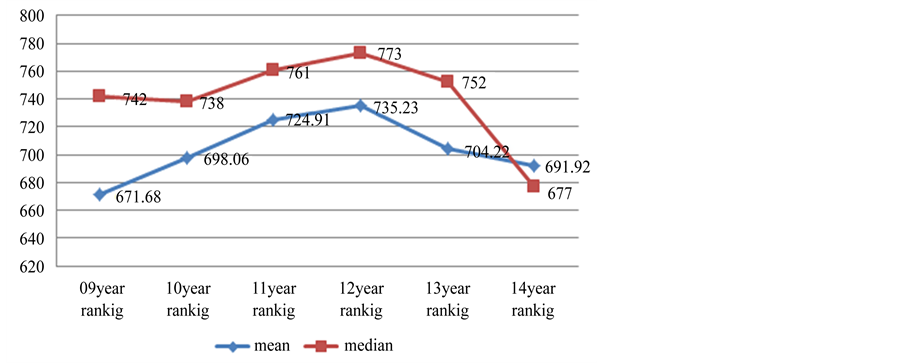
Graph 1. Tendency of ranking results.
Table 4. Rank calculation result.
a10 year ranking < 09 year ranking; b10 year ranking > 09 year ranking; c10 year ranking = 09 year ranking; d11 year ranking < 09 year ranking; e11 year ranking > 09 year ranking; f11 year ranking = 09 year ranking; g12 year ranking < 09 year ranking; h12 year ranking > 09 year ranking; i12 year ranking = 09 year ranking; j13 year ranking < 09 year ranking; k13 year ranking > 09 year ranking; l13 year ranking = 09 year ranking; m14 year ranking < 09 year ranking; n14 year ranking > 09 year ranking; o14 year ranking = 09 year ranking.
Table 5. Wilcoxon matched-pairs signed-ranks.
aBased on negative rank; bWilcoxon matched-pairs signed-ranks.
*Corresponding author.
Cite this paper
GuoxiWang,YanhongLi, (2015) The Empirical Study on the Relationship between Listed Companies’ Private Placement and Operating Performance
—Based on the Empirical Data from 2009 to 2014. Open Journal of Social Sciences,03,59-66. doi: 10.4236/jss.2015.310009
References
- 1. Wruck, K.H. (1989) Equity Ownership Concentration and Firm Value: Evidence from Private Equity Financing. Journal of Financial Economics, 23, 3-28. http://dx.doi.org/10.1016/0304-405X(89)90003-2
- 2. Hertzel, M.G. and Smith, R.L. (1993) Market Discounts and Shareholder Gains for Placing Equity Privately. Journal of Finance, 48, 459-485. http://dx.doi.org/10.1111/j.1540-6261.1993.tb04723.x
- 3. Marciukaityte, D., Szewcyk, S. and Varma, R. (2005) Investor Overoptimism and Private Equity Placements. Journal of Financial Research, 28, 591-608. http://dx.doi.org/10.1111/j.1475-6803.2005.00141.x
- 4. Xu, S.F. (2010) Private Placement of Listed Company’s Announcement Effect and the Influence Factors. Securities Market Leader, 5, 65-72.
- 5. Zhao, W.D. and Zhao, A.Q. (2012) Empirical Research on Long-Term Shareholder Wealth Effects of the Private Placement. Shanghai Economic Research, 1, 42-52.
- 6. Kong, Y.S. (2014) Research on Private Placement, Different Objects, Company Growth—Based on the Empirical Evidence from Chinese A-Share Market. Communication of Finance and Accounting, 12, 58-60.
NOTES

*Corresponding author.