Open Journal of Marine Science
Vol.05 No.01(2015), Article ID:53213,8 pages
10.4236/ojms.2015.51009
Marginal Expansion Planning of Infrastructure at a Container Terminal
Keng Bin Loke1*, Ab. Saman Abd. Kader2, Mohd. Zamani Ahmad2, Saharuddin Abdul Hamid1, Mohamad Rosni Othman1
1School of Maritime Business and Management, Universiti Malaysia Terengganu, Terengganu, Malaysia
2Faculty of Mechanical Engineering, Universiti Teknologi Malaysia, Johor, Malaysia
Email: *loke.k@umt.edu.my
Copyright © 2015 by authors and Scientific Research Publishing Inc.
This work is licensed under the Creative Commons Attribution International License (CC BY).
http://creativecommons.org/licenses/by/4.0/


Received 20 December 2014; accepted 7 January 2015; published 14 January 2015
ABSTRACT
Globalization push container terminal grown rapidly in decade. To fulfill the future traffic requirement, this study highlights marginal expansion planning of infrastructure in a container terminal. By using marginal approach, the expansion plan can be determine correctly and economically stage by stage. A mathematical model has generated to calculate the expansion size, expansion time, interval of expansion, expansion cost, and significant of expansion for each infrastructure respectively. It recommended determining the expansion plan for each infrastructure respectively. This is because one of the infrastructures needs to be expanding but the other may not. The generated model was verified with others model and validated with case study to investigate the practicability of the model. The model serves as expansion decision making tools to assist port expansion planners.
Keywords:
Infrastructure, Marginal Approach, Expansion Plan, Mathematical Model, Expansion Size, Expansion Time

1. Introduction
The main objective of port development and expansion is to provide terminal service and support future demand. Different parties have different ideas and intentions of port development and expansion. UNCTAD [1] used the planning chart concept to lead the different facilities or infrastructure. The formula has been converted into a chart for immediate use. Frankel [2] employed mathematical techniques to be familiar with the issues and methods of port planning and development. Kader [3] focused on port initial development and expansion planning; it’s unique for inland water way designs. Kendra [4] is specified for environmental protection design during port development. Thomas [5] specified in the container handling system, by given significant efficiency and competence to the container terminal selected. Niswari [6] related the operational capacity and financial requirement to cost expansion; it’s particular in container terminal expansion. Mohd Zamani [7] utilized fuzzy methods to develop a planning model. He tried to improve the lack of human modes in planning approaches. Dekker and Verhaeghe [8] applied marginal approach to determine when, size and interval expansion time in such method.
Most of the existing container terminal’s expansion models are focused on the fulfillment of future throughput demand [1] [2] [7] . The purpose of expansion is only to describe the overall terminal expansion with respect to increase in demand. At this moment, container terminal’s expansion models are not considering small changes in commercial viability as well as in expansion magnitude over time.
Dekker and Verhaeghe [8] (here declare as Dekker model) drew attention to marginal approach in container terminal’s expansion planning. They proposed the use of NPV to calculate the significance of expansion in very single expansion step. However, their study only draws interest in total expansion in TEU, and neglected the expansion of the actual port infrastructure. The expansion cost for expansion variables (actual infrastructure) is based upon the change in demand, but some expansion variables could sustain the demand and the others may not.
Therefore, this study drew attention to marginal approach in container terminal’s expansion planning for the actual port infrastructure respectively. The expansion cost for expansion infrastructure is based upon the change in demand, some expansion infrastructure could sustain the change in demand but others may not. Container terminal expansion will be more accurate if change in demand and periods of sustaining for each expansion infrastructure could be identified so that the expansion of infrastructure is at correct size and at the correct time. Thereafter, this study uses NPV to evaluate the increment requirement for future throughput demand. The positive NPV represents the significance of increment of the expansion infrastructure respectively for each expansion period, to ensure a sustainable and economically effective expansion plan.
2. Mapping the Direction
Several studies and approaches have been used to evaluate and organize the port development and expansion model between 1985 and 2008. Mohd Zamani [7] established fuzzy expert system to assess the container terminal development planning. He adapted the expansion variables from UNCTAD [1] , Frankel [2] , and Thomas [5] . Dekker and Verhaeghe [8] established marginal approach to determine maximum capacity extension in YEU/year. However, it did not deal with the expansion infrastructure individually. Therefore, this study extent from Dekker model and deal with its limitation; revises the marginal approach model with expansion infrastructure focusing on expansion time and size. Figure 1 shows the formulation of a conceptual framework for container terminal expansion model by the marginal approaches that deal with expansion infrastructure.
2.1. Identification of Research Variables and Development of Marginal Terminal Expansion Decision-Making Model
The immediate concern is to identify the expansion infrastructure (research variables) for terminal expansion planning by marginal approach. The expansion infrastructure adapted the variables used by Mohd Zamani’s model [7] and marginal approach used by Dekker’s model [8] . Figure 2 shows the placement of variables within the context of the proposed container marginal terminal expansion model. This work aims at improving the shortcoming of previous models.
Figure 2 further transformed into the marginal terminal expansion decision-making model as presented in Figure 3. Figure 3 shows the preliminary decision-making model combining all the variables. Part A is described as the data input for the marginal expansion of the selected elements for a container terminal. A series of data set for each infrastructure component to be expanded marginally are required for the marginal expansion algorithm. The series of data set are the group of forthcoming throughput demand, forthcoming capacity requirements for infrastructure components, current capacity support for infrastructure components, cost per unit of infrastructure component, and size of economic order quality for infrastructure components. The infrastructure components are container park area, container freight station, berth capacity requirement, container handling system, and terminal other areas. The expansion of infrastructure components can be expanded by full
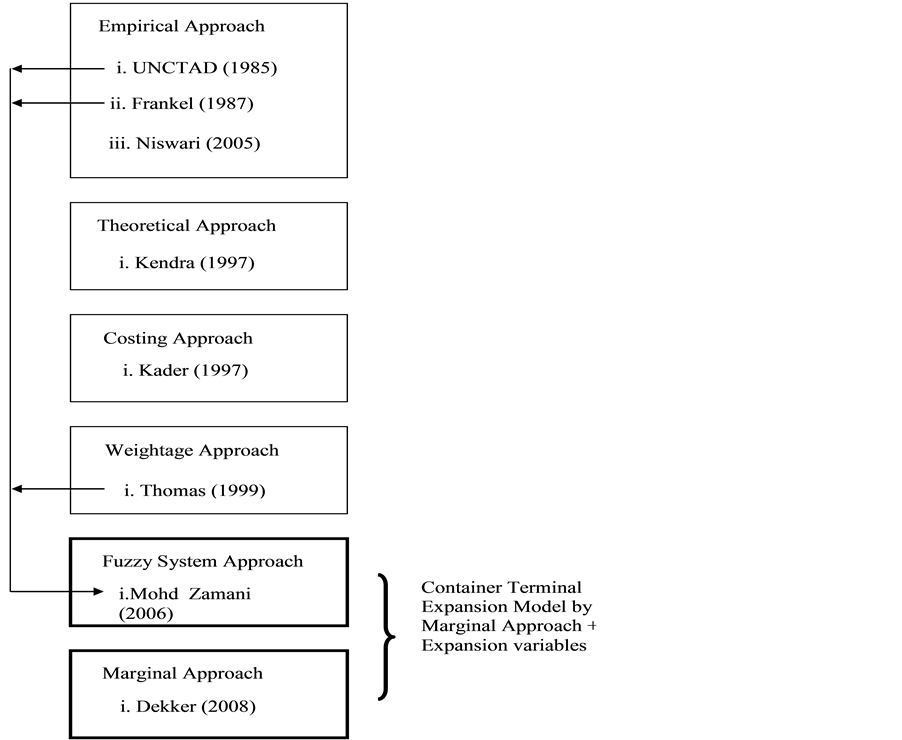
Figure 1. Formulation of conceptual framework for container terminal expansion model by marginal approach.
combination, either combination, or by only one expansion item. The output from the algorithm will be the amount of marginal expansion required for each planning element within the planning horizon.
Part B is described as the data input for the financial requirements for expanding the infrastructure components for the container terminal. A series of data set for each financial item of infrastructure components to be expanded marginally are inserted into the algorithm. The series of data set is a group of financial data based on the collection and expenditure for the new investment items. The output is the NPV for the marginal investment. If the result is positive, the expansion is viable and likewise, if the result is negative, the expansion is not viable and the current infrastructure must sustain until further planning.
2.2. Development of Marginal Expansion Algorithm
Several studies have done to determine the development and expansion needs of a container terminal. UNCTAD [1] selected container park area, container freight station area, berth-day requirement, ship’s cost at terminal as research variables. Frankel [2] selected container part area and berth capacity requirement as research variables. Thomas selected container handling system as research variable. Zamani [7] selected container part area, container freight station area, ship’s cost at terminal, berth-day requirement, container handling system, and terminal other areas as research variables. Dekker [8] selected twenty-foot equivalent unit as research variable. All of the previous studies are targeted to fulfill and support the operation systems in various concepts. This study expands from Dekker model and tries to overcome the shortage of the model to be more practicable, the expansion infrastructure variables are modified from UNCTAD [1] , Frankel [2] and Zamani [7] . By adding the expansion infrastructure, the expansion of terminal would be more accurate. There are five key operational systems in a
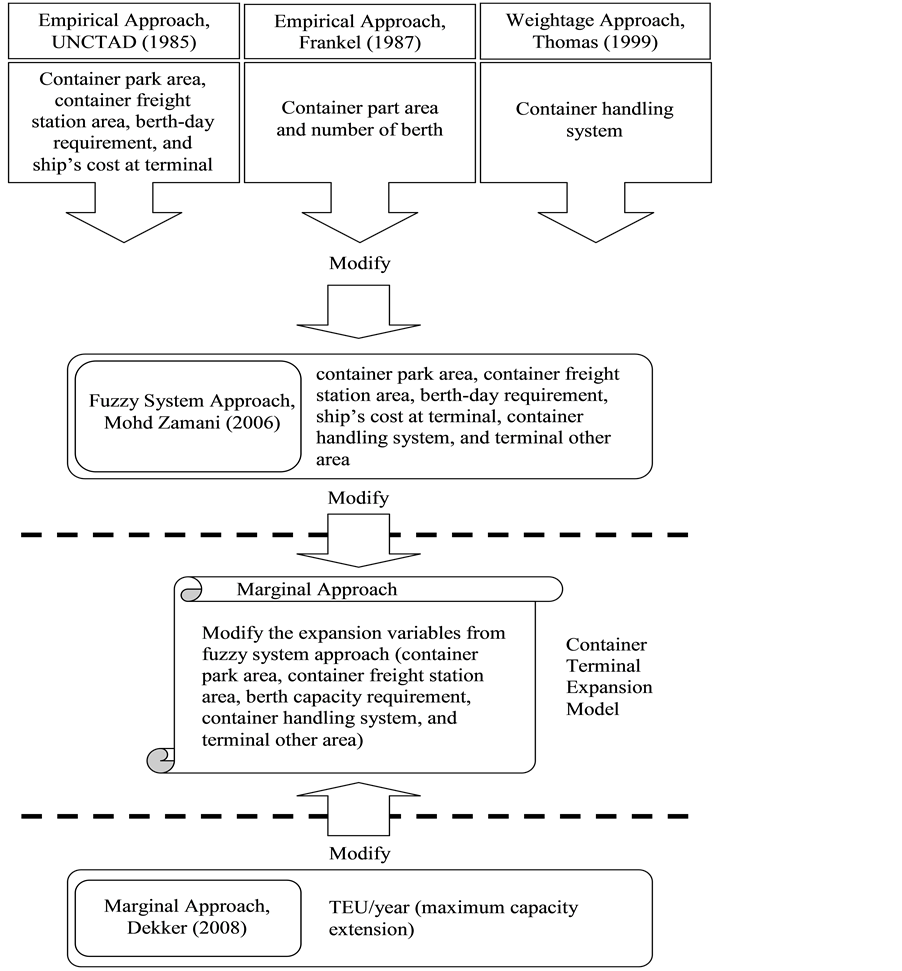
Figure 2. Research variables within the context of the proposed container marginal terminal expansion model.
container port; namely ship, quay transfer, container yard, receipt/delivery, and container freight station operations [9] . To support the key operation demand, this study focused on key operational systems in a container terminal. Therefore, five key operation infrastructure are selected; namely container handling system (chs), berth capacity requirement (bcr), container part area (cpa), container freight station (cfs), and terminal other areas (toa). The algorithm is generated based on the five key expansion infrastructures. Therefore, container terminal expansion (cte) is expressed as:
 (1)
(1)
The calculation of chs is the sum of marginal expansion of equipments making up the container handling system that needs to be expanded, where handle by quay crane (qc), rubber tyred gantry crane (rtg) and prime mover (pm). Quay crane selected as illustrate for the algorithm generated. To be clear on the algorithm sequence,
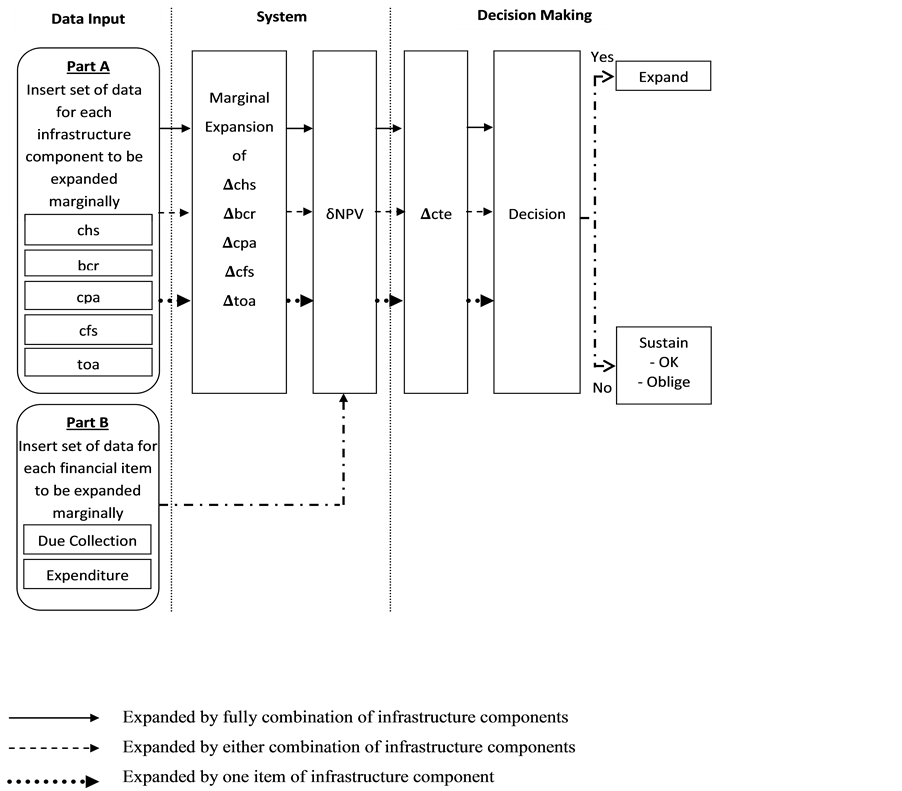
Figure 3. Preliminary decision-making model combining all the variables.
Figure 4 shows the mapping of preliminary modeling evaluation; the forthcoming throughput demand needs to be determined first, before any expansion plan takes action. Once the future demand is identified, the current capacity of quay crane needs to match with future throughput demand. If the current capacity is bigger than fu- ture demand, then quay crane does not need to be expanded. However, if the current capacity is smaller than the forthcoming demand, subsequently, this infrastructure needs to be expanded. The result output will be assessing to verify and validate the process by its effects. Comparison has been done between the developed algorithm model with UNCTAD [1] and Dekker [8] models to verify the results. The results show that the present marginal model required 3 units of berths, 11.96 ha of space of container park area and 1983 m2 of space of container freight station. However, UNCTAD’s model required 4 units of berths, 12 ha of container park area and 2000 m2 container freight station. Comparison against UNCTAD’s model and present model shows that returns a lower value for container park area (0.33%) and container freight station area (0.85%). The present model claims a lower value because it is based on the marginal approach. The differential of berth capacity requirement (25%) is because the determination of berth capacity needs is based on unit basic. On the other hand, the investment recovery period for present marginal model is 7 years for every single incremental and the investment return rate is 23.5%. The investment recovery period for Dekker’s model is 11 years for every single incremental plan and the investment return rate is 6%. The quickly and higher investment return may cause by more accurate invest on specifics infrastructure that ensures a quicker and higher rate of return. Thereafter, the present model is validated and presented in section model robustness.
The linear regression used for forecasting issues, where δQct represents container throughput forecasting in
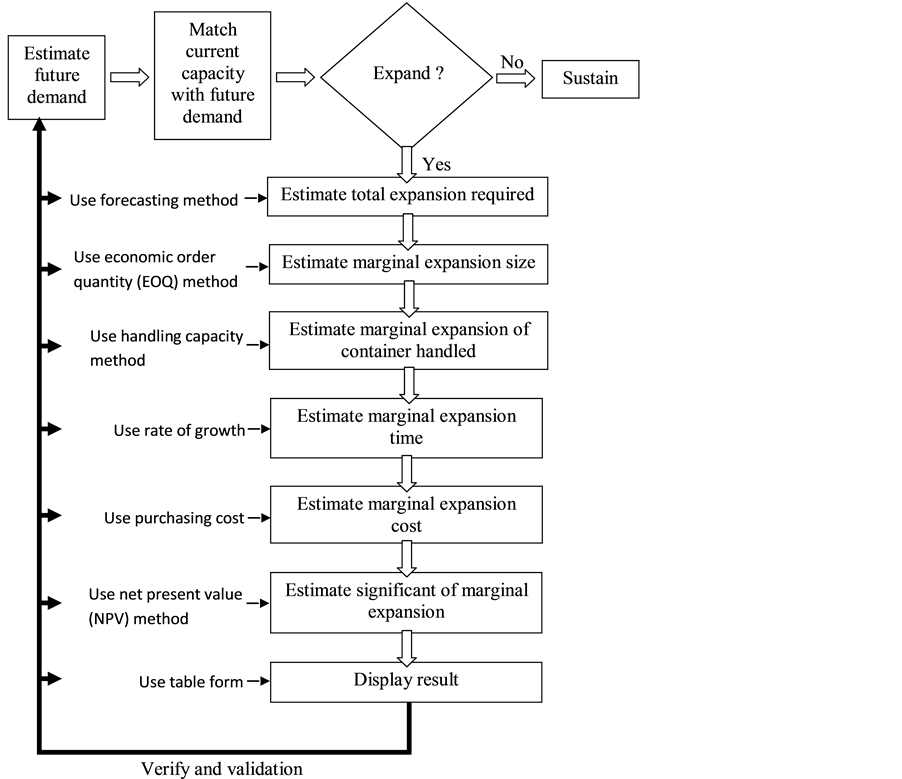
Figure 4. Preliminary modeling evaluation.
time t, γct represents container capacity growth given by the gradient of plot of container’s demand growths, P represents estimation of total principal investment over the planning time horizon and I represents estimation of total net income from the new investment, and δQc0 represents initial quantity demand of container throughput. This equation is used to determine the forecasting of container throughput to twenty-foot equivalent unit (TEU).
 (2)
(2)
Thereafter, total marginal future expansion size of quay crane (Nqc) is determined by equation below. MPHqc is move per hour for one unit of qc, ut is utility rate of infrastructure, qcnow is current supply unit of qc. Symbol x is multiply code.
 (3)
(3)
After the Nqc is determined, economic order quantity (EOQ) will be used to determine every single incremental of expansion needed.
 (4)
(4)
where m is the minimum purchasing unit or minimum construction unit and n is the number unit/duplicate of m. This equation is used to determine the marginal expansion of quay crane, with the condition of minimum purchasing unit or minimum construction unit. S represents the cost per setup, RMqc is cost per unit of quay crane, and R represents carrying costs in percentage of holding cost, 25% [10] .
The handling capacity rate of qc is calculated by equation below [1] [11] . Where δQct represents container throughput forecasting in time t, MPHqc represents Move per Hour (MPH), and ut represents maximum utilisation rate of equipment, which is 90% (Dekker and Verhaeghe, 2008).
 (6)
(6)
After the δQqcEOQ is determined, the expansion time and cost for the marginal expansion of quay crane are calculated as follows.
 (7)
(7)
 (8)
(8)
Thereafter, net present value (NPV) used to determine the significant of expansion. Where Pi is initial investment capital, M is due collection from the new investment, OI is operator’s investment (e.g. training) spend in year t, FP is fees (e.g. salary) paid by the operator in time t, OC is operating costs in year t, MC is maintenance costs in time t, and MIT is mitigation (other costs) costs in time t.
 (9)
(9)
2.3. Model Robustness
A case study was selected to validate the algorithm model. Data was collected to test run the algorithm generated and the results output was displayed in table form. This section discusses the real case scenarios where it is high- lighting the expansion requirement on entire variables namely cpa, cfs, bcr, chs, and toa.
Table 1 shows that the expansion requirement is started in the year of 2021, the expansion year of No. 10. The expansion size for qc and rtg are 1 unit for every purchasing time. The expansion size for pm is 2 units for every purchasing time. All the expansion stage is positive about the NPV value. Its significant proves that the expansion plan is efficient and economic viably. The interval time for container handling equipment is plus and minus 1 year; this is because the purchasing of equipment is in unit basic. This is further proving in Table 2. The interval time for qc is 4 or 5 years. The interval time for rtg and pm is 1 or 2 years. As a result, it is concluded that the interval time is plus and minus 1 year to be smoothed for minimum purchasing requirement.
Table 2 shows the subsequent expansion for the year 2032; the expansion year of No. 21. The expansion size for qc and rtg are 1 unit for every purchasing time. The expansion size for pm is 2 units for every purchasing time. All the expansion stage is positive about the NPV value. It further proves that the expansion plan is signifi- cant and workable.
3. Conclusion
The scope of the model encompasses the marginal expansion of five key part infrastructure namely chs, bcr, cpa, cfs, and toa. Instead of determining the economic marginal TEU expansion the present model translates that value into economic marginal infrastructure expansion of the quay crane (qc), rubber-tyred gantry crane (rtg), prime mover (pm), number units of berth capacity requirement (bcr), size of container park area (cpa), size of the container freight station (cfs), and number units of the entry gate for terminal other areas (toa). The infrastructural expansions have been effectively segregated to ensure that the algorithm structure in modular. Mod- ular structure offers the advantage of quicker analysis for the selected module.

Table 1. Expansion diagram from the year 2012, to year 2031.
Table 2. Expansion diagram from the year 2032, to year 2036.
Acknowledgements
We extend our sincere appreciation and indebtedness to Universiti Teknologi Malaysia (UTM) and their funder (vot no 77205) for the guidance, support and encouragement. We would also like to thank the reviewers of this paper for they helpful suggestion.
References
- UNCTAD (1985) Port Development―A Handbook for Planners in Developing Countries. UNITED NATIONS, New York, 227.
- Frankel, E.G. (1987) Port Planning and Development. John Wiley and Sons, New York, 795.
- Kader, A.S.A. (1997) Cost Modelling for Inland Waterway Transport Systems. Liverpool John Moores University, Liverpool, 276.
- Kendra, J.M. (1997) Seaport Development versus Environmental Preservation: The Case of Sears Island, Maine, USA. Marine Policy, 21, 409-424. http://dx.doi.org/10.1016/S0308-597X(97)00004-3
- Thomas, B.J. (1999) Improving Port Performance―Container Terminal Development. Proceedings of the Trade and Development and Swedish International Development Authority, United Nation.
- Niswari, A. (2005) Container Terminal Expansion to Build Capacity: A Case Study. Erasmus University Rotterdam, Rotterdam, 73.
- Mohd Zamani, A. (2006) The Application of Fuzzy Expert System to Preliminary Development Planning of Medium Size Container Terminal. Universiti Teknologi Malaysia, Johor Bahru, 355.
- Dekker, S. and Verhaeghe, R.J. (2008) Development of a Strategy for Port Expansion: An Optimal Control Approach. Maritime Economic and Logistics, 2008, 258-274.
- Thomas, B.J. and Roach, D.K., Interface4 Ltd., International Labour Office (1994) A Project by the International Labour Office (ILO), Financed by the Royal Government of the Kingdom of the Netherlands, Port Development Programme, C.1.1 Container Terminal Operations. 56.
- Fawcett, S.E., Ellram, L.M. and Ogden, J.A. (2007) Supply Chain Management Form Visio to Implementation. Pearson Education, Inc., New Jersey, 530.
- Loke, K.B., Saharuddin, A.H., Ibrahim, A.R. and Rizal, I. (2004) Container Handling Efficiency. Proceedings of the 4th International Conference on Marine Technology, Malaysia.
NOTES

*Corresponding author.