World Journal of Neuroscience
Vol.4 No.2(2014), Article ID:45523,12 pages DOI:10.4236/wjns.2014.42018
In Vivo 9.4T MRI and 1H MRS for Evaluation of Brain Structural and Metabolic Changes in the Ts65Dn Mouse Model for Down Syndrome
S. Même1*, N. Joudiou1, N. Yousfi1, F. Szeremeta1, P. Lopes-Pereira2, J. C. Beloeil1, Y. Herault2,3,4, W. Même1
1Center for Molecular Biophysics, Orleans, France
2Transgenesis, Archiving and Animal Models, Orleans, France
3Mouse Clinical Institute, Illkirch, France
4Institute of Genetics and Molecular and Cellular Biology, Illkirch, France
Email: *sandra.meme@cnrs-orleans.fr
Copyright © 2014 by authors and Scientific Research Publishing Inc.
This work is licensed under the Creative Commons Attribution International License (CC BY).
http://creativecommons.org/licenses/by/4.0/


Received 20 February 2014; revised 20 March 2014; accepted 28 March 2014
ABSTRACT
In the present study we investigated structural and metabolic modifications of the brain in the Ts65Dn mouse model of Down syndrome (DS) using both in vivo magnetic resonance imaging (MRI) and proton magnetic resonance spectroscopy (MRS). MRI was performed for further texture analysis and changes in texture parameters, including mean grey levels, contrast and homogeneity, and they were found in Ts65Dn compared to diploid littermates (2n). These phenotypic changes were different in the hippocampus and cerebellum, since in Ts65Dn mean grey levels increased in the cerebellum and decreased in the hippocampus. In addition, proton NMR spectra revealed differences in metabolite ratios. Levels of N-acetylaspartate (NAA) and glutamate (Glu), were lower compared to total creatine levels (CX), in the Ts65Dn brain. However, the most striking finding was an increase in the concentration of myo-inositol (Ins) and choline (Cho) in the hippocampus, whereas the Ins concentration was reduced in the cerebellum. Overall, these data illustrate that MRI and MRS are valuable assesment tools sufficiently sensitive to detect associated changes in different brain areas, thus providing new insight into the causative role of dosage-sensitive genes in the Ts65Dn DS mouse model.
Keywords:Magnetic Resonance Imaging, Texture Analysis, 1H Magnetic Resonance Spectroscopy, Down Syndrome, Mouse Model

1. Introduction
Down syndrome (DS), or trisomy 21, is the most common genetic cause of intellectual disability that is associated with morphological and physiological brain defects. DS occurs in 1 in 800 live births. It is due to an extra copy of the human chromosome 21 (Hsa21). This leads to impairments in cognitive ability originating during development and ranging from mild to moderate. Malformations of the brain can be detected in DS patients, from early development stages. The brain is smaller, being only 76% of normal [1] . Structural changes are heterogeneous in the brain and some areas are dissimilarly affected. For example, the cerebellum is 66% of normal weight [2] . Individuals with DS have numerous neurological anomalies including cortical, hippocampal and cerebellar dysplasia, and impairment of some monoaminergic and cholinergic systems [3] . Neuropathological observations include reduced size and numbers of neurons along with increased size and numbers of astrocytes [1] [3] [4] . In addition, DS individuals have a higher risk of developing Alzheimer-like dementia by the age of 40, including plaques and tangles and loss of cholinergic neurons in the basal forebrain [5] [6] . Therefore, a fundamental understanding of Down syndrome is necessary. Indeed several therapeutic strategies targeting either pathways, candidate genes or the entire Hsa21 chromosomes [7] -[10] have been successfully validated in preclinical mouse models and only for a few in human. Such in depth understanding of the DS biology will benefit any genetic or pharmacological intervention, considered in key areas such as the developmental or neurobiological processes in the central nervous system (CNS).
Mouse models are key elements in understanding better the genotype-phenotype relationship and the physiopathology of Down syndrome. Based on the homology of Hsa21 and the murine chromosomes Mmu16, Mmu17 and Mmu10 several mouse models have been developed [11] [12] . In particular, the Ts(1716) 65Dn (Ts65Dn) remains a reference model in the literature for the study of DS cognitive deficits [13] -[15] even though additional models have been described more recently [16] -[20] . Ts65Dn mice are trisomic for the distal 12 - 15 Mb of mouse chromosome 16 (Mmu16) and this carries 167 genes in three copies located between Mrpl39 and Zfp295 and contains approximatively 92 genes orthologues to Hsa21. These trisomic mice reveal some phenotypic characteristics of DS such as delay in postnatal development [21] and deficits in many behavioral and cognitive tests (for review see [22] ). Ts65Dn mice have defects in structure and development of neuronal circuits, and show deficits in long-term potentiation, a form of synaptic plasticity thought to underlie memory storage [23] -[33] . Ts65Dn also have early onset of the neuropathology of Alzheimer’s disease [21] [34] . Ts65Dn mice have thus been widely used to study the relationship between gene dosage and the expression of various phenotypes of DS, and for therapeutical assays [35] .
Magnetic Resonance Imaging is a well-known non-invasive imaging technique that is well established in clinical practice and research on human neurological disorders. The recent emergence of high magnetic field imagers, enables higher resolution images to be acquired which in turn enable MRI research on small animal models of CNS diseases [36] . In parallel, texture analysis (TA) of the MR images allows studies to go further and to extract more information [37] . Image texture is formed by repetitive elements called primitives. There are two types of texture: periodic (or ordered) and random. The first one is formed by primitives arranged in a particular way, tidy. The basic pattern is then repeated on a regular basis, and is easy to isolate. We talk about ordered texture. The second one (random texture) looks totally disorderly. It is difficult if not impossible to isolate a basic pattern. TA can reveal structural subtle changes in tissue which are not visible by eye on MR images (human beings can only discriminate 20 grey levels). Several studies have been published on the eye perception of details on images. It has been shown that if two textures have the same 2nd order statistics but are different by their higher order statistics, then the human eye won’t be able to perceive any differences [38] [39] . Therefore, we have used image analysis methods which can highlight details in an image which are not visible by the human eye. Those changes can be associated for example to a loss of cellular density (neurons for example), gliosis, inflammation (with oedema) or on the contrary fibrosis formation [37] [40] .
TA actually contains several mathematical techniques of image analysis that allow the characterization of a Region Of Interest (ROI) by studying its constitutive pixels in terms of intensity and spatial distribution. Several different TA methods exist [41] and they can be divided in two different classes: statistical and structural methods. In the present study, we used the statistical approach with histogramm and cooccurrence matrix (the latest is well suited to study tissue without apparent structural regularity). Several quantitative parameters can therefore be extracted from the image analysis. Thus, multiparametrical statistical methods such as Correspondence, Factorial Analysis (CFA) or Hierarchical Ascending Classification (HAC) are used to pool out texture parameters that aim to identify different types of tissue into one organ. For instance, these methods can be used to compare and distinguish healthy from pathological tissues, to follow the development of a pathology or to study the efficacy of therapeutic treatments. TA has been applied successfully to liver [42] , bone [43] , muscular [38] and cerebral [37] [40] [44] tissue in humans or animals.
MRI studies of the Ts65Dn model have already been conducted [18] [45] [46] . They cover morphological measurements of brain structure volumes such as the cerebellum or the hippocampus. Results show that there is a decrease in the size of the cerebellum and CA2 region of the hippocampus in Ts65Dn mice. In addition, Chen et al. [47] have measured a decrease in MRI T2 relaxation time in the septal nucleus, hippocampus, retrospinal and cingulate cortex, the four main structures involved in the cholinergic system.
Magnetic Resonance Spectroscopy (MRS) is a method that allows non-invasive identification and quantitation of metabolites whose concentration is much lower than water. It provides information on brain metabolism and neuronal functions. MRS is well suited for studying brain disorders because metabolite levels are sensitive to different in vivo pathological processes at the molecular or cellular level. It can be used to detect N-acetylaspartate (a marker of neuronal number and health), glutamate (an excitatory neurotransmitter), glutamine (precursor of glutamate), lactate (the end product of anaerobic glycolysis), choline (membrane component), creatine, taurine (osmoregulation, calcium modulation, neuromodulator) and myo-inositol (glial marker). Studies have also been performed using MRS to characterize neurodegenerative diseases in humans. It has been shown that a decrease in N-acetylaspartate is linked to a process of cerebral degeneration in the case of Alzheimer’s disease, Down syndrome, and mental retard in children [48] , whereas, myo-inositol is increased in DS adults [49] . In Ts65Dn animals, mass spectrometry studies confirmed an elevated level of myo-inositol in the hippocampus and frontal cortex of Ts65Dn mice [50] [51] .
The aim of the present work was to perform a dual approach for studying the structural characterization (MRI and TA) and cerebral metabolism (MRS) of the Ts65Dn model. These two techniques represent complementary tools to understand better the genotype-phenotype relationship and the physiopathology of Down syndrome. Texture analysis was used on the Ts65Dn model in order to determine whether DS may induce structural abnormalities in the brain and more specifically in the hippocampus and cerebellum, two cerebral regions involved in memory and learning processes, and impair psychomotor development. Neurochemical changes in the Ts65Dn mouse brain were then investigated using high-resolution, single voxel 1H-MRS. The results showed specific alteration of the Ts65Dn brain and supported our long term objective: to apply our MRI and MRS methods to various mouse models with genes or regions homologous to human chromosome 21 (Hsa21) which are necessary or sufficient to induce DS cognitive features.
2. Results
2.1. MR Texture Analysis
Following MRI acquisition, ROIs were selected on the images both in the cerebellum and hippocampus (Figure 1) to be analyzed by TA using histogramm and coocurrence matrix methods. Each ROI was then characterized using three texture parameters: mean grey levels (value of signal intensity), contrast and homogeneity. Those three parameters were extracted among all parameters (calculated with histogramm and cooccurrence matrix) after performing several CFAs which determined, the most significant texture parameters for the distinction between the two mice groups (Ts65Dn and diploid) with a confidence level of 0.95. Their mathematical formulae are given above:
 (a)
(a)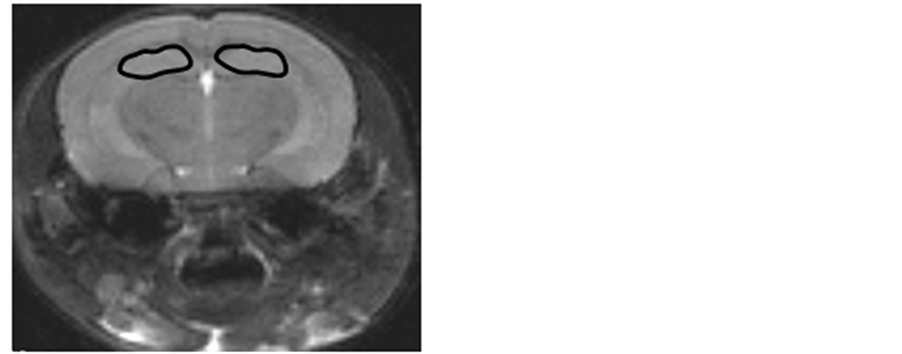 (b)
(b)
Figure 1. Mouse brain M.R. images: coronal (Figure 1(a)) and axial (Figure 1(b)) slices. Region of interest (ROIs) in the cerebellum (Figure 1(a)) and hippocampus (Figure 1(b)) were manually drawn to be analyzed with texture analysis methods.

where p(i,j) is the cooccurrence matrix element; i.e. the probability to have the transition grey level i to grey level j.
Means were calculated for each parameter for each group (2n and Ts65Dn). Graphs are presented as box plots on Figure 2 for the cerebellum and hippocampus. The first quartile, median and third quartile are represented with horizontal black lines (limits of the boxes) on the boxes. The vertical bars represent standard deviations.
In the cerebellum there is a significant 20% increase in mean grey levels (p = 0.001), a 11.5% decrease in contrast (p = 0.035) and a 10.5% increase in homogeneity (p = 0.05) for Ts65Dn mice compared to 2n mice. In the hippocampus there is a significant 9.5% decrease in mean grey levels (p = 0.001), a 30% decrease in contrast (p = 0.03) and a 10% increase in homogeneity (p = 0.01) in Ts65Dn mice compared to 2n mice. These results suggest that changes in texture parameters are different between brain structures, since in Ts65Dn mice mean grey levels increased in the cerebellum and decreased in the hippocampus compared to 2n mice.
2.2. Voxel Localized Spectroscopy
Following MRI, MRS acquisitions were performed on the same animals. In Figure 3 (cerebellum) and Figure 4 (hippocampus) a squared region of interest (ROI) on an image of a mouse brain shows the position and size of the localized volume (3 × 3 × 3) mm3 from which all spectra were obtained. 1H localized spectra in the cerebellum and hippocampus are illustrated with peak attribution. The spectrum obtained from a 2n mouse was compared to that obtained from a Ts65Dn animal (Figure 3 and Figure 4).
These were then analysed and quantified in the cerebellum and hippocampus using the AMARES method. The area under each metabolite peak was calculated, taking into account the amplitude, width at half height and width at the foot of the peak. Thus, the area calculated is directly proportional to the concentration of metabolites in the brain structure considered and are expressed as relative quantities (NAA/Cx, Gln+Glu/Cx, Cho/Cx, Ins/Cx, Tau/Cx and Lac/Cx). A Mann-Whitney test was used to compare these ratios between 2n and Ts65Dn mice. The results are presented in Table 1.
In the cerebellum of Ts65Dn mice, there is a significant decrease in NAA/Cx (−25%, p < 0.01), Glu+Gln/Cx (−56%; p < 0.01) and Ins/Cx (−67%; p < 0.01) compared to 2n mice. In the hippocampus of Ts65Dn mice, there is a significant decrease in NAA/Cx (−54%; p < 0.01) and Glu + Gln/Cx (−24%; p < 0.01) but a significant increase in Ins/Cx (+17%; p < 0.01) and Cho/Cx (+14%; p < 0.01). There was no significant modification in other metabolites, such as Tau/Cx and Lac/Cx either in the hippocampus or cerebellum of Ts65Dn mice compared to 2n mice (Table 1).
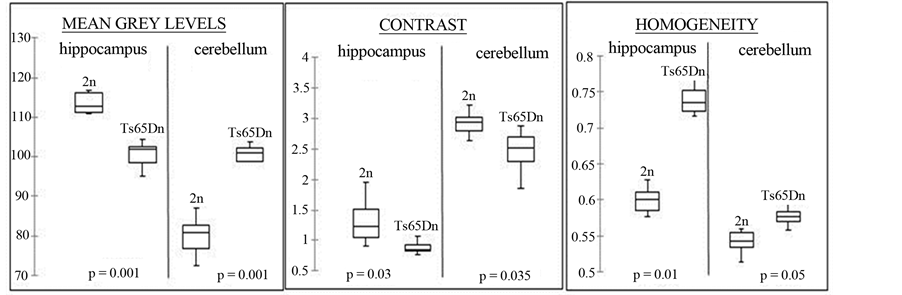
Figure 2. MR texture analysis parameters for cerebellum and hippocampus and corresponding Mann-Whitney p values for comparison between 2n and Ts65Dn mice (n = 10).
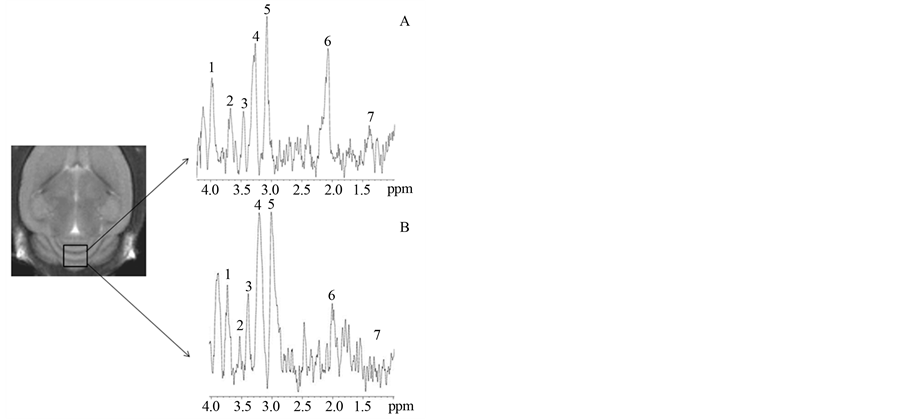
Figure 3. 9.4T MR image (coronal slice) of mouse brain and corresponding cerebellum 1H spectrum for 2n (A) and Ts65Dn (B) mice. (1: Glutamate + Glutamine; 2: Inositol; 3: Taurine; 4: Choline; 5: Creatine + phosphocreatine (Cx); 6: N-Acetyl Aspartate; 7: Lactate)

Table 1. In vivo MRS results show metabolites changes in 2n and Ts65Dn mice for cerebellum and hippocampus. Values are expressed as mean (S.D.). Mann-Whitney p values for comparison between 2n and Ts65Dn (n = 10). Cr + PCr = Cx Creatine + phosphocreatine; NAA: N-Acetyl Aspartate; Gln + Glu: Glutamate + Glutamine; Cho: Choline; Ins: Inositol; Tau: Taurine; Lac: Lactate.
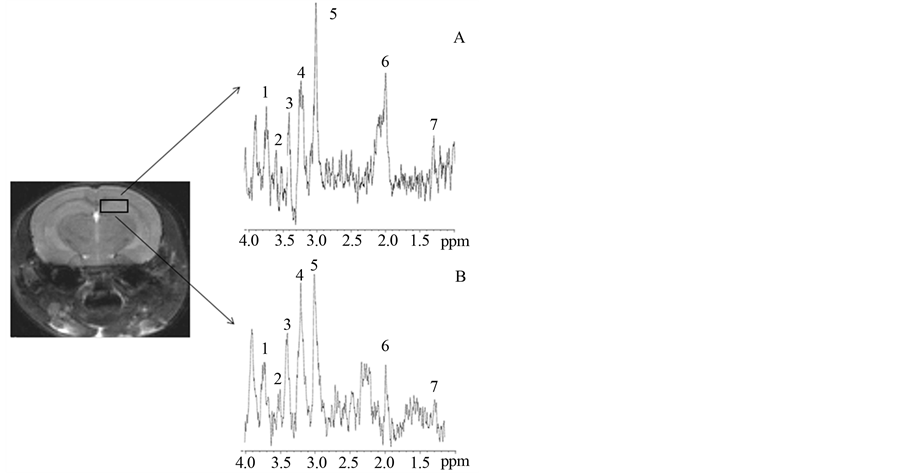
Figure 4. 9.4T MR image of mouse brain (axial slice) and corresponding hippocampus 1H spectrum for 2n (A) and Ts65Dn (B) mice. (1: Glutamate + Glutamine; 2: Inositol; 3: Taurine; 4: Choline; 5: Creatine + phosphocreatine (Cx); 6: NAcetyl Aspartate; 7: Lactate)
3. Discussion
In order to understand better the genotype-phenotype relationship and the physiopathology of Down syndrome, we first examined abnormalities in the brain of Ts65Dn mice using magnetic resonance imaging (MRI) combined with texture analysis methods (TA).
A reduction in contrast and mean grey levels and an increase in homogeneity were found in the hippocampus. These results suggest a modification of brain tissue in Ts65Dn mice which could be related to Ts65Dn functional or structural changes. Ts65Dn mice have been shown to exhibit a number of characteristic features of DS, including impairment in hippocampal-dependent tasks, the hippocampus being a structure which plays a key role in information encoding and retrieving in the CNS [52] . For instance, Ts65Dn mice demonstrate spontaneous alterations in the T-maze, contextual fear conditioning, novel object recognition [53] , and spatial memory in the radial arm maze and the Morris water maze tests [15] [29] [54] [55] . Galdzicki et al. [56] have already hypothesized that structural changes in the hippocampus could be the cause of learning and memory defects. This could be explained by an altered neuronal density and total synaptic density in CA1 [57] . In Ts65Dn brains, there is a decrease in hippocampal cell proliferation during the first week of life [58] . Although, one-month old mice display a normal number of neurons in the hippocampal CA1 - CA3 areas, an age-related degeneration of cholinergic neurons as well as astrocytic hypertrophy have been observed in these regions [21] [59] . Thus, CA1 neuron density is lower in older (17 - 18 months) Ts65Dn mice [31] [57] . In addition, a significant decrease in the number of dendritic thorns and an increase in pyramidal cell layers have been described in CA3 [18] [60] , whereas the dentate gyrus (DG) has fewer granule cells at all ages of Ts65Dn mice examined compared to disomic mice [31] [59] .
Texture analysis was also performed on MR images of the cerebellum. The cerebellum has traditionally been associated with motor coordination, but there is increasing evidence that this structure plays a role in higher cognitive processes, including attention, cognitive flexibility, and memory [61] . Consistent with what is found in DS, the volume of the cerebellum is significantly reduced in Ts65Dn mice [45] . Our results show that there is an increase in mean grey levels in the cerebellum with an increase in homogeneity for Ts65Dn mice compared to 2n mice. The latter suggests that there is a loss of structuring and that enlarged homogeneous areas appear with less transition of grey levels. This is confirmed by a decrease in contrast. Our data are in line with previous studies that have shown that the cerebellum of one-month-old Ts65Dn mice display fewer neurons in the internal granular layer and fewer granule and Purkinje cells from early postnatal stages to adulthood [45] [62] [63] .
Thus, changes in texture parameters from MRI are hallmarks of Ts65Dn brain structure phenotype in the hippocampus and cerebellum. Although a strict correlation between MRI TA changes and cellular changes in the hippocampus and cerebellum could not be done, we suggest that modification can be causally linked one to another [37] [40] . These parameters are therefore likely to be useful non-invasive biomarkers to characterize DS phenotypes in different mouse models.
We also examined the neurochemical profile of Ts65Dn brains using 1H magnetic resonance spectroscopy, a method which can provide high resolution mapping of the severity and extent of metabolic abnormalities in a region of interest. Although MRS studies of the human brain in DS patients are relatively common, MRS studies of the mouse brain have only been performed in a small number of studies [64] [65] . In particular, one MRS study on Ts65Dn brains has investigated metabolite modification after lithium treatment [50] . The main reason for so few studies is that high field imaging spectrometry is required due to the small size of the mouse brain which only contains small quantities of water and thus 1H signal. In accordance with Huang et al. [50] , a reduced level of NAA, compared to total creatine levels (CX), was found both in the hippocampus and cerebellum in Ts65Dn mice. NAA is predominantly an intraneuronal chemical and can be used as a marker for neuronal density and/or health. Several studies have shown that reduced NAA is an early and sensitive phenomenon that precedes structural changes in the brain. Thus, the NAA level can be used as an indicator of brain pathology [66] [67] . NAA can also be used as a marker for a volume ratio of neurons to other cells such as microglia and/or astrocytes which are known to change their phenotype in certain pathological situations such as neuroinflammation. Immunohistochemical analysis using GFAP antibody to identify astrocytes is consistent with the presence of activated glial cells including hypertrophy and an increased number of astrocytes in Ts65Dn mice [21] [68] . Likewise, the myo-inositol level, predominantly present in glia cells [69] , is higher in the hippcampus of Ts65Dn than 2n mice. This decrease in NAA and increase in myo-inositol could reflect a process of neurodegeneration with a loss of cholinergic neurons and astrogliosis associated with DS [70] -[72] .
A decrease in the level of glutamate/glutamine was found both in the hippocampus and cerebellum of Ts65Dn mice. Alterations in glutamatergic transmission leave the balance between excitatory and inhibitory synapses shifted toward increased inhibition in the trisomic brain. It has been shown that Ts65Dn mice have less excitatory synapses in the temporal cortex, DG, CA1, CA3 and their glutamatergic synapses are reduced in the hippocampus [32] [57] . Thus, Ts65Dn display reduced hippocampal long-term potentiation (LTP) in the hippocampal CA1 and DG regions [33] [55] [73] . Reduced activation of NMDA receptors is thought to hinder LTP induction in Ts65Dn mice [55] [73] [74] . In addition, over-inhibition in the hippocampus of Ts65Dn mice has been shown to be dependent on GABA receptors, because the GABAA antagonist receptor picrotoxin reversed the reduction in LTP, suggesting an increase in presynaptic release of GABA [75] . Unfortunatly, under our experimental conditions, we were not able to quantify GABA levels on proton NMR spectra. This was due to the small quantity of instantaneous GABA.
We showed an increase in the concentration of myo-inositol in the hippocampus in Ts65Dn mice. This is in accordance with previous studies performed with MRS on Ts65Dn and trisomy 16, and with mass spectroscopy of brain extracts [50] [51] . This can be explained by the presence of three copies of the SLC5A3 gene (present on human chromosome 21 and triplicated in the Ts65Dn mice) which encodes for the co-transport of Na+/myoinositol. Myo-inositol is a key precursor of membrane phospho-inositides and phospholipids and is involved in cell membrane and myelin sheet structures. It is considered to be a glial marker, and an increase in its content is believed to represent glial proliferation [69] . During periods of osmotic stress, the osmotic balance is preserved by regulation of myo-inositol across the plasma membrane. Increased membrane turn-over or damage to myeline sheets can results in increased concentrations of free myo-inositol. However, we found a significant decrease in the concentration of myo-inositol in the cerebellum of Ts65Dn mice. A similar discrepency between the hippocampus and cerebellum has been highlighted in previous neurochemical studies. For instance, it has been shown that Ts65Dn mice have severe deficits in the synaptic transmission of the central beta-noradrenergic system. This difference seems to be specific to the hippocampus and cerebral cortex, because it is not observed in the cerebellum [76] [77] . These observations suggest that the difference in the neurochemical metabolites observed arises from a variation in the region of the brain sampled in Ts65Dn. Therefore, the causative role of the overexpression of a subset of genes and their encoded proteins remain to be studied in different brain structures.
In conclusion, we have performed our MRI and MRS study on the most documented mouse model (Ts65Dn) of DS. We have highlighted structural (modification in the homogeneity) and metabolic modifications (myoinositol, Glx, choline and N-acetyl aspartate) both in the hippocampus and cerebellum, suggesting that these defects could contribute to learning performance and spatial memory defects observed in this mouse strain. Correlation between DS and altered texture parameters and/or neurochemical profiles remains to be studied. Nevertheless, texture parameters and neurochemical profiles represent valuable markers to understand better the genotype-phenotype relationship and the physiopathology of Down syndrome. In addition, these techniques might allow potential drug targets to be defined and evaluated and therapeutic assays to be developed.
4. Experimental Procedure
4.1. Animals
Ts65Dn mice were bred under specific pathogen free conditions and were treated in compliance with animal welfare policies of the French Ministry of Agriculture (law 87,848 and YH accreditation 45 - 31).
Ts65Dn animals were obtained by crossing Ts65Dn females with F1B6C3B males and were genotyped as previously described [78] . 11.9+/−0.3 (mean+/−sd) week-old littermates were used in the study and were divided into two groups diploid (2n) (n = 10) and Ts65Dn (n = 10). Animals were maintained under 12 h day light/dark cycle and received food and water ad libitum.
4.2. MR Experiments
All mice underwent the same protocol: MRI was immediately followed by MRS on the same day. During the MR experiments, mice were positioned in a custom-built cradle to immobilize the head. They were anesthetized during the MR experiment with 1.5% isoflurane and a mixture of O2/N2O (1:1) with an output of 0.7 L/min. Respiration was monitored during the whole experiment using an air pillow and body temperature was maintained constant at 37˚C by a warm-water circulation system. MR acquisitions were performed on a 9.4T horizontal ultra shielded superconducting magnet dedicated to small animal imaging (94/20 USR Bruker Biospec, Wissembourg, France) and equipped with a 950mT/m gradient set. A Bruker 35 mm inner diameter bircage coil was used for both 1H transmission and reception.
1) -MRI Both coronal and axial images of the brain were obtained using a spin echo RARE sequence with the following parameters: TE/TR = 46 ms/5 s, FOV size = 1.70 × 1.70 cm, matrix size = 128 × 128, Bandwidth = 50 kHz, slice thickness = 1 mm to display (133 × 133) μm2 in plane resolution for a duration of 2 min (2 accumulations).
2) -MRS Static B0 homogeneity was adjusted with first and second order shims in a (3.5 × 3.5 × 3.5) mm3 voxel centered in the hippocampus or the cerebellum on the images acquired with the above MRI protocol with the Bruker Fastmap procedure [79] . The half height linewidth achieved for tissue water was less than 10 Hz. A PRESS sequence (Point Resolved Spectroscopy) was used to record localized 1H spectra in a cubic (3 × 3 × 3) mm3 voxel placed in fastmap voxel with the following parameters (TE/TR = 16 ms/4 s, 256 scan: 17 min, 2048 points, bandwidth = 4000 Hz) with water suppression using VAPOR (Variable Pulse power and Optimized Relaxation delays) module and outer volume suppression [80] . Eddy current compensation and static magnetic field drift correction were applied during spectra acquisition.
4.3. Texture Analysis for Image Quantification
The MR images obtained were transferred onto a personal computer for data processing. Signal intensity was normalized with the signal from a water tube put just near the head during the acquisitions. Two ROIs (hippocampus and cerebellum) were selected in both hemispheres and drawn manually on each axial slice to be analyzed (Figure 1(a) & Figure 1(b)). ROIs were then analyzed with a home-made software which included several image texture analysis methods. In the present study histograms were used to calculate mean grey levels and co-occurrence matrix. These methods consisted in selecting patterns on the images. They encompassed one or several pixels oriented in a specific direction. In our study, patterns formed by two pixels (for the cooccurrence matrix) and with a 0˚ angle with the horizontal axis, were chosen. Eight texture parameters can be calculated from this matrix. Several CFAs were then performed to determinate the most discriminant ones in the comparison between 2n and Ts65Dn mice with a significance level of 95% (p < 0.05). Following image analyses, each ROI was characterized by its own texture profile that was defined with the calculated texture parameters of contrast, homogeneity and mean grey levels. Means and standard deviations were calculated for these three parameters and for both groups and were then statistically analyzed using Mann-Whitney tests.
4.4. Spectra Quantification
1H spectra were acquired for 2n and Ts65Dn mice. These spectra were then analyzed with JMRUI 4.0 software (http://www.mrui.uab.es/mrui/) working in time domain (baseline correction, phasing, zero filling). AMARES module (advanced method for accurate, robust, and efficient spectral fitting) [81] was used to quantify brain metabolites: N-Acetyl-Aspartate (NAA), glutamate (Glu), glutamine (Gln), -aminobutyric-acid (GABA), creatine (Cr), choline (Cho), myo-inositol (Ins), taurine (Tau) and lactate (Lac). Metabolite concentrations were calculated through spectra peak integration. They were expressed as ratios relative to Cr+PCr (Cx) concentrations as that peak did not vary between 2n and Ts65Dn mice (Table 1). The Cx value was thus taken as a reference [82] [83] . Mann-Whiney tests were then performed to make pairwise comparison of metabolite concentrations between contol and Ts65Dn mice.
References
- Crome, L. and Erdohazi, M. (1966) Main Pathological Findings in Hydrocephalic Children Treated by VentriculoAtrial Shunt. Archives of Disease in Childhood, 41, 179-182. http://dx.doi.org/10.1136/adc.41.216.179
- Jernigan, T.L., et al., (1993) Cerebral Morphologic Distinctions between Williams and Down Syndromes. Archives of Neurology, 50, 186-191. http://dx.doi.org/10.1001/archneur.1993.00540020062019
- Coyle, J.T., Oster-Granite, M.L., and Gearhart, J.D. (1986) The Neurobiologic Consequences of Down Syndrome. Brain Research Bulletin, 16, 773-787. http://dx.doi.org/10.1016/0361-9230(86)90074-2
- Griffin, W.S., et al., (1989) Brain Interleukin 1 and S-100 Immunoreactivity Are Elevated in Down Syndrome and Alzheimer Disease. Proceedings of the National Academy of Sciences of the United States of America, 86, 7611-7615. http://dx.doi.org/10.1073/pnas.86.19.7611
- Rumble, B., et al., (1989) Amyloid A4 Protein and Its Precursor in Down Syndrome and Alzheimer’s Disease. The New England Journal of Medicine, 320, 1446-1452. http://dx.doi.org/10.1056/NEJM198906013202203
- Sabbagh, M.N., et al., (2011) Positron Emission Tomography and Neuropathologic Estimates of Fibrillar AmyloidBeta in a Patient with Down Syndrome and Alzheimer Disease. Archives of Neurology, 68, 1461-1466. http://dx.doi.org/10.1001/archneurol.2011.535
- Braudeau, J., et al., (2011) Chronic Treatment with a Promnesiant GABA-A α5-Selective Inverse Agonist Increases Immediate Early Genes Expression during Memory Processing in Mice and Rectifies Their Expression Levels in a Down Syndrome Mouse Model. Advances in Pharmacological Sciences, 2011, Article ID: 153218.
- Das, I. and Reeves, R.H. (2011) The Use of Mouse Models to Understand and Improve Cognitive Deficits in Down Syndrome. Disease Models & Mechanisms, 4, 596-606. http://dx.doi.org/10.1242/dmm.007716
- De la Torre, R., et al., (2013) Epigallocatechin-3-gallate, a DYRK1A Inhibitor, Rescues Cognitive Deficits in Down Syndrome Mouse Models and in Humans. Molecular Nutrition & Food Research, 58, 278-288.
- Jiang, J., et al., (2013) Translating Dosage Compensation to Trisomy 21. Nature, 500, 296-300. http://dx.doi.org/10.1038/nature12394
- Herault, Y., et al., (2012) The in Vivo Down Syndrome Genomic Library in Mouse. Progress in Brain Research, 197, 169-197. http://dx.doi.org/10.1016/B978-0-444-54299-1.00009-1
- Rueda, N., Florez, J. and Martinez-Cue, C. (2012) Mouse Models of Down Syndrome as a Tool to Unravel the Causes of Mental Disabilities. Neural Plasticity, 2012, Article ID: 584071.
- Davisson, M.T., Schmidt, C. and Akeson, E.C. (1990) Segmental Trisomy of Murine Chromosome 16: A New Model System for Studying Down Syndrome. Progress in Clinical and Biological Research, 360, 263-280.
- Davisson, M.T., et al., (1993) Segmental Trisomy as a Mouse Model for Down Syndrome. Progress in Clinical and Biological Research, 384, 117-133.
- Reeves, R.H., et al., (1995) A Mouse Model for Down Syndrome Exhibits Learning and Behaviour Deficits. Nature Genetics, 11, 177-184. http://dx.doi.org/10.1038/ng1095-177
- Li, Z., et al. (2007) Duplication of the Entire 22.9 Mb Human Chromosome 21 Syntenic Region on Mouse Chromosome 16 Causes Cardiovascular and Gastrointestinal Abnormalities. Human Molecular Genetics, 16, 1359-1366. http://dx.doi.org/10.1093/hmg/ddm086
- O’Doherty, A., et al. (2005) An Aneuploid Mouse Strain Carrying Human Chromosome 21 with Down Syndrome Phenotypes. Science, 309, 2033-2037. http://dx.doi.org/10.1126/science.1114535
- Olson, L.E., et al. (2007) Trisomy for the Down Syndrome “Critical Region” Is Necessary but Not Sufficient for Brain Phenotypes of Trisomic Mice. Human Molecular Genetics, 16, 774-782. http://dx.doi.org/10.1093/hmg/ddm022
- Pereira, P.L., et al. (2009) A New Mouse Model for the Trisomy of the Abcg1-U2af1 Region Reveals the Complexity of the Combinatorial Genetic Code of Down Syndrome. Human Molecular Genetics, 18, 4756-4769. http://dx.doi.org/10.1093/hmg/ddp438
- Yu, T., et al. (2010) A Mouse Model of Down Syndrome Trisomic for All Human Chromosome 21 Syntenic Regions. Human Molecular Genetics, 19, 2780-2791. http://dx.doi.org/10.1093/hmg/ddq179
- Holtzman, D.M., et al. (1996) Developmental Abnormalities and Age-Related Neurodegeneration in a Mouse Model of Down Syndrome. Proceedings of the National Academy of Sciences of the United States of America, 93, 13333-13338. http://dx.doi.org/10.1073/pnas.93.23.13333
- Dierssen, M., Herault, Y. and Estivill, X. (2009) Aneuploidy: From a Physiological Mechanism of Variance to Down Syndrome. Physiological Reviews, 89, 887-920. http://dx.doi.org/10.1152/physrev.00032.2007
- Aldridge, K., et al. (2007) Differential Effects of Trisomy on Brain Shape and Volume in Related Aneuploid Mouse Models. American Journal of Medical Genetics Part A, 143A, 1060-1070. http://dx.doi.org/10.1002/ajmg.a.31721
- Belichenko, P.V., et al. (2004) Synaptic Structural Abnormalities in the Ts65Dn Mouse Model of Down Syndrome. Journal of Comparative Neurology, 480, 281-298. http://dx.doi.org/10.1002/cne.20337
- Best, T.K., Siarey, R.J. and Galdzicki, Z. (2007) Ts65Dn, a Mouse Model of Down Syndrome, Exhibits Increased GABAB-Induced Potassium Current. Journal of Neurophysiology, 97, 892-900. http://dx.doi.org/10.1152/jn.00626.2006
- Contestabile, A., et al. (2007) Cell Cycle Alteration and Decreased Cell Proliferation in the Hippocampal Dentate Gyrus and in the Neocortical Germinal Matrix of Fetuses with Down Syndrome and in Ts65Dn Mice. Hippocampus, 17, 665-678. http://dx.doi.org/10.1002/hipo.20308
- Dierssen, M., et al. (2003) Alterations of Neocortical Pyramidal Cell Phenotype in the Ts65Dn Mouse Model of Down Syndrome: Effects of Environmental Enrichment. Cerebral Cortex, 13, 758-764. http://dx.doi.org/10.1093/cercor/13.7.758
- Escorihuela, R.M., et al. (1995) A Behavioral Assessment of Ts65Dn Mice: A Putative Down Syndrome Model. Neuroscience Letters, 199, 143-146. http://dx.doi.org/10.1016/0304-3940(95)12052-6
- Escorihuela, R.M., et al. (1998) Impaired Shortand Long-Term Memory in Ts65Dn Mice, a Model for Down Syndrome. Neuroscience Letters, 247, 171-174. http://dx.doi.org/10.1016/S0304-3940(98)00317-6
- Hanson, J.E., et al. (2007) The Functional Nature of Synaptic Circuitry Is Altered in Area CA3 of the Hippocampus in a Mouse Model of Down’s Syndrome. The Journal of Physiology, 579, 53-67. http://dx.doi.org/10.1113/jphysiol.2006.114868
- Insausti, A.M., et al. (1998) Hippocampal Volume and Neuronal Number in Ts65Dn Mice: A Murine Model of Down Syndrome. Neuroscience Letters, 253, 175-178. http://dx.doi.org/10.1016/S0304-3940(98)00641-7
- Kurt, M.A., et al. (2000) Synaptic Deficit in the Temporal Cortex of Partial Trisomy 16 (Ts65Dn) Mice. Brain Research, 858, 191-197. http://dx.doi.org/10.1016/S0006-8993(00)01984-3
- Siarey, R.J., et al. (2006) Altered Signaling Pathways Underlying Abnormal Hippocampal Synaptic Plasticity in the Ts65Dn Mouse Model of Down Syndrome. Journal of Neurochemistry, 98, 1266-1277. http://dx.doi.org/10.1111/j.1471-4159.2006.03971.x
- Seo, H. and Isacson, O. (2005) Abnormal APP, Cholinergic and Cognitive Function in Ts65Dn Down’s Model Mice. Experimental Neurology, 193, 469-480. http://dx.doi.org/10.1016/j.expneurol.2004.11.017
- Ruparelia, A., Pearn, M.L. and Mobley, W.C. (2012) Cognitive and Pharmacological Insights from the Ts65Dn Mouse Model of Down Syndrome. Current Opinion in Neurobiology, 22, 880-886. http://dx.doi.org/10.1016/j.conb.2012.05.002
- Denic, A., et al. (2011) MRI in Rodent Models of Brain Disorders. Neurotherapeutics, 8, 3-18. http://dx.doi.org/10.1007/s13311-010-0002-4
- Meme, S., et al. (2009) MRI Characterization of Structural Mouse Brain Changes in Response to Chronic Exposure to the Glufosinate Ammonium Herbicide. Toxicological Sciences, 111, 321-330. http://dx.doi.org/10.1093/toxsci/kfp174
- Herlidou, S., et al. (1999) Comparison of Automated and Visual Texture Analysis in MRI: Characterization of Normal and Diseased Skeletal Muscle. Magnetic Resonance Imaging, 17, 1393-1397. http://dx.doi.org/10.1016/S0730-725X(99)00066-1
- Julesz, B., et al. (1973) Inability of Humans to Discriminate between Visual Textures That Agree in Second-Order Statistics-Revisited. Perception, 2, 391-405. http://dx.doi.org/10.1068/p020391
- Calas, A.G., et al. (2008) Chronic Exposure to Glufosinate-Ammonium Induces Spatial Memory Impairments, Hippocampal MRI Modifications and Glutamine Synthetase Activation in Mice. Neurotoxicology, 29, 740-747. http://dx.doi.org/10.1016/j.neuro.2008.04.020
- Conners, R.W. and Harlow, C.A. (1980) A Theoretical Comparison of Texture Algorithms. IEEE Transactions on Pattern Analysis and Machine Intelligence, 2, 204-222. http://dx.doi.org/10.1109/TPAMI.1980.4767008
- Jirak, D., et al. (2002) Texture Analysis of Human Liver. Journal of Magnetic Resonance Imaging, 15, 68-74. http://dx.doi.org/10.1002/jmri.10042
- Herlidou, S., et al. (2004) Influence of Age and Osteoporosis on Calcaneus Trabecular Bone Structure: A Preliminary in Vivo MRI Study by Quantitative Texture Analysis. Magnetic Resonance Imaging, 22, 237-343. http://dx.doi.org/10.1016/j.mri.2003.07.007
- Herlidou-Meme, S., et al. (2003) MRI Texture Analysis on Texture Test Objects, Normal Brain and Intracranial Tumors. Magnetic Resonance Imaging, 21, 989-993. http://dx.doi.org/10.1016/S0730-725X(03)00212-1
- Baxter, L.L., et al. (2000) Discovery and Genetic Localization of Down Syndrome Cerebellar Phenotypes Using the Ts65Dn Mouse. Human Molecular Genetics, 9, 195-202. http://dx.doi.org/10.1093/hmg/9.2.195
- Sebrie, C., et al. (2008) Increased Dosage of DYRK1A and Brain Volumetric Alterations in a YAC Model of Partial Trisomy 21. The Anatomical Record, 291, 254-262. http://dx.doi.org/10.1002/ar.20640
- Chen, Y., et al. (2009) In Vivo MRI Identifies Cholinergic Circuitry Deficits in a Down Syndrome Model. Neurobiology of Aging, 30, 1453-1465. http://dx.doi.org/10.1016/j.neurobiolaging.2007.11.026
- Filippi, C.G., et al. (2002) Developmental Delay in Children: Assessment with Proton MR Spectroscopy. American Journal of Neuroradiology, 23, 882-888.
- Yao, F.S., Caserta, M.T. and Wyrwicz, A.M. (2000) In Vitro 1H and 31P NMR Spectroscopic Evidence of Multiple Aberrant Biochemical Pathways in Murine Trisomy 16 Brain Development. International Journal of Developmental Neuroscience, 18, 833-841. http://dx.doi.org/10.1016/S0736-5748(00)00043-5
- Huang, W., et al. (2000) Brain Myo-Inositol Level Is Elevated in Ts65Dn Mouse and Reduced after Lithium Treatment. NeuroReport, 11, 445-448. http://dx.doi.org/10.1097/00001756-200002280-00004
- Shetty, H.U., et al. (1996) Brain Accumulation of Myo-Inositol in the Trisomy 16 Mouse, an Animal Model of Down’s Syndrome. Biochemical Journal, 313, 31-33.
- Morris, R.G., et al. (1982) Place Navigation Impaired in Rats with Hippocampal Lesions. Nature, 297, 681-683. http://dx.doi.org/10.1038/297681a0
- Fernandez, F. and Garner, C.C. (2008) Episodic-Like Memory in Ts65Dn, a Mouse Model of Down Syndrome. Behavioural Brain Research, 188, 233-237. http://dx.doi.org/10.1016/j.bbr.2007.09.015
- Demas, G.E., et al. (1996) Spatial Memory Deficits in Segmental Trisomic Ts65Dn Mice. Behavioural Brain Research, 82, 85-92. http://dx.doi.org/10.1016/S0166-4328(97)81111-4
- Kleschevnikov, A.M., et al. (2004) Hippocampal Long-Term Potentiation Suppressed by Increased Inhibition in the Ts65Dn Mouse, a Genetic Model of Down Syndrome. The Journal of Neuroscience, 24, 8153-8160. http://dx.doi.org/10.1523/JNEUROSCI.1766-04.2004
- Galdzicki, Z. and Siarey, R.J. (2003) Understanding Mental Retardation in Down’s Syndrome Using Trisomy 16 Mouse Models. Genes, Brain and Behavior, 2, 167-178. http://dx.doi.org/10.1034/j.1601-183X.2003.00024.x
- Kurt, M.A., et al. (2004) Deficits of Neuronal Density in CA1 and Synaptic Density in the Dentate Gyrus, CA3 and CA1, in a Mouse Model of Down Syndrome. Brain Research, 1022, 101-109. http://dx.doi.org/10.1016/j.brainres.2004.06.075
- Gotti, S., Caricati, E. and Panzica, G. (2011) Alterations of Brain Circuits in Down Syndrome Murine Models. Journal of Chemical Neuroanatomy, 42, 317-326. http://dx.doi.org/10.1016/j.jchemneu.2011.09.002
- Lorenzi, H.A. and Reeves, R.H. (2006) Hippocampal Hypocellularity in the Ts65Dn Mouse Originates Early in Development. Brain Research, 1104, 153-159. http://dx.doi.org/10.1016/j.brainres.2006.05.022
- Popov, V.I., et al. (2011) Three-Dimensional Synaptic Ultrastructure in the Dentate Gyrus and Hippocampal Area CA3 in the Ts65Dn Mouse Model of Down Syndrome. Journal of Comparative Neurology, 519, 1338-1354. http://dx.doi.org/10.1002/cne.22573
- Dickson, P.E., et al. (2010) Behavioral Flexibility in a Mouse Model of Developmental Cerebellar Purkinje Cell Loss. Neurobiology of Learning and Memory, 94, 220-228. http://dx.doi.org/10.1016/j.nlm.2010.05.010
- Contestabile, A., et al. (2009) Cell Cycle Elongation Impairs Proliferation of Cerebellar Granule Cell Precursors in the Ts65Dn Mouse, an Animal Model for Down Syndrome. Brain Pathology, 19, 224-237. http://dx.doi.org/10.1111/j.1750-3639.2008.00168.x
- Olson, L.E., et al. (2004) Down Syndrome Mouse Models Ts65Dn, Ts1Cje, and Ms1Cje/Ts65Dn Exhibit Variable Severity of Cerebellar Phenotypes. Developmental Dynamics, 230, 581-589. http://dx.doi.org/10.1002/dvdy.20079
- Marjanska, M., et al. (2005) Monitoring Disease Progression in Transgenic Mouse Models of Alzheimer’s Disease with Proton Magnetic Resonance Spectroscopy. Proceedings of the National Academy of Sciences of the United States of America, 102, 11906-11910. http://dx.doi.org/10.1073/pnas.0505513102
- Miyasaka, N., Takahashi, K. and Hetherington, H.P. (2006) 1H NMR Spectroscopic Imaging of the Mouse Brain at 9.4T. Journal of Magnetic Resonance Imaging, 24, 908-913. http://dx.doi.org/10.1002/jmri.20709
- Hsu, Y.Y., et al. (2001) Lateralization and Prognostic Value of Proton Magnetic Resonance Spectroscopy in Patients with Intractable Temporal Lobe Epilepsy. Chang Gung Medical Journal, 24, 768-778.
- Jessen, F., et al. (2000) Proton MR Spectroscopy Detects a Relative Decrease of N-Acetylaspartate in the Medial Temporal Lobe of Patients with AD. Neurology, 55, 684-688. http://dx.doi.org/10.1212/WNL.55.5.684
- Bambrick, L.L., Yarowsky, P.J. and Krueger, B.K. (2003) Altered Astrocyte Calcium Homeostasis and Proliferation in the Ts65Dn Mouse, a Model of Down Syndrome. Journal of Neuroscience Research, 73, 89-94. http://dx.doi.org/10.1002/jnr.10630
- Brand, A., Richter-Landsberg, C. and Leibfritz, D. (1993) Multinuclear NMR Studies on the Energy Metabolism of Glial and Neuronal Cells. Developmental Neuroscience, 15, 289-298. http://dx.doi.org/10.1159/000111347
- Ceuterick, C., et al. (1998) Astroglial Tangles in the Hippocampus of Two Patients with Down Syndrome and Alzheimer Neuropathology. Ultrastructural Pathology, 22, 161-163. http://dx.doi.org/10.3109/01913129809032272
- Jorgensen, O.S., Brooksbank, B.W. and Balazs, R. (1990) Neuronal Plasticity and Astrocytic Reaction in Down Syndrome and Alzheimer Disease. Journal of the Neurological Sciences, 98, 63-79. http://dx.doi.org/10.1016/0022-510X(90)90182-M
- Murphy Jr., G.M., et al. (1992) Astrocytic Gliosis in the Amygdala in Down’s Syndrome and Alzheimer’s Disease. Progress in Brain Research, 94, 475-483. http://dx.doi.org/10.1016/S0079-6123(08)61774-4
- Belichenko, P.V., et al. (2007) Synaptic and Cognitive Abnormalities in Mouse Models of Down Syndrome: Exploring Genotype-Phenotype Relationships. Journal of Comparative Neurology, 504, 329-345. http://dx.doi.org/10.1002/cne.21433
- Belichenko, N.P., et al. (2009) The “Down Syndrome Critical Region” Is Sufficient in the Mouse Model to Confer Behavioral, Neurophysiological, and Synaptic Phenotypes Characteristic of Down Syndrome. The Journal of Neuroscience, 29, 5938-5948. http://dx.doi.org/10.1523/JNEUROSCI.1547-09.2009
- Kleschevnikov, A.M., et al. (2012) Increased Efficiency of the GABAA and GABAB Receptor-Mediated Neurotransmission in the Ts65Dn Mouse Model of Down Syndrome. Neurobiology of Disease, 45, 683-691. http://dx.doi.org/10.1016/j.nbd.2011.10.009
- Dierssen, M., et al. (1997) Alterations of Central Noradrenergic Transmission in Ts65Dn Mouse, a Model for Down Syndrome. Brain Research, 749, 238-244. http://dx.doi.org/10.1016/S0006-8993(96)01173-0
- Dierssen, M., et al. (1996) Impaired Cyclic AMP Production in the Hippocampus of a Down Syndrome Murine Model. Developmental Brain Research, 95, 122-124. http://dx.doi.org/10.1016/0165-3806(96)00071-5
- Duchon, A., et al. (2011) The Telomeric Part of the Human Chromosome 21 from Cstb to Prmt2 Is Not Necessary for the Locomotor and Short-Term Memory Deficits Observed in the Tc1 Mouse Model of Down Syndrome. Behavioural Brain Research, 217, 271-281. http://dx.doi.org/10.1016/j.bbr.2010.10.023
- Gruetter, R. (1993) Automatic, Localized in Vivo Adjustment of All Firstand Second-Order Shim Coils. Magnetic Resonance in Medicine, 29, 804-811. http://dx.doi.org/10.1002/mrm.1910290613
- Tkac, I., et al. (1999) In Vivo 1H NMR Spectroscopy of Rat Brain at 1 ms Echo Time. Magnetic Resonance in Medicine, 41, 649-656. http://dx.doi.org/10.1002/(SICI)1522-2594(199904)41:4<649::AID-MRM2>3.0.CO;2-G
- Vanhamme, L., van den Boogaart, A. and Van Huffel, S. (1997) Improved Method for Accurate and Efficient Quantification of MRS Data with Use of Prior Knowledge. Journal of Magnetic Resonance, 129, 35-43. http://dx.doi.org/10.1006/jmre.1997.1244
- van Eijsden, P., et al. (2010) In Vivo Neurochemical Profiling of Rat Brain by 1H-[13C] NMR Spectroscopy: Cerebral Energetics and Glutamatergic/GABAergic Neurotransmission. Journal of Neurochemistry, 112, 24-33. http://dx.doi.org/10.1111/j.1471-4159.2009.06428.x
NOTES

*Corresponding author.