Optics and Photonics Journal
Vol.2 No.3A(2012), Article ID:23307,4 pages DOI:10.4236/opj.2012.223038
Temperature Dependence of the Raman Intensity and the Bandwidth Close to the Order-Disorder Phase Transition in NaNO3
Department of Physics, Middle East Technical University, Ankara, Turkey
Email: *hamit@metu.edu.tr
Received June 5, 2012; revised July 15, 2012; accepted July 20, 2012
Keywords: Raman Intensity; Bandwidth; NaNO3
ABSTRACT
We analyze the temperature dependence of the Raman intensity using the experimental data according to a power-law formula close to the order-disorder transition (Tc = 549 K) in NaNO3. From this analysis, we extract the value of β = 0.26 as the critical exponent for the order parameter, which indicates a tricritical phase transition in this crystalline system. Using the temperature dependence of the order parameter, the Raman bandwidth is calculated at various temperatures in NaNO3. Our calculated bandwidths describe adequately the observed behavior of the order-disorder transition in this crystal.
1. Introduction
NaNO3 exhibits an order-disorder phase transition at Tc = 548 K [1]. Below Tc, the  ions are oriented along one preferred direction which gives rise to the long range order parameter. Above Tc, the
  ions are equally positioned between the two stable states.
The experimental studies such as the thermal expansion [1-3], X-ray [4] and light scattering [5-7] have been given in the literature. A large λ anomaly in the heat capacity of NaNO3 has been observed at Tc [8,9]. Besides, the molecular NO desorption from crystalline sodium nitrate [10], by the laser desorption the electronic structure [11] and the electron beam induced damage of NaNO3 [12] have been studied experimentally.
In order to explain the mechanism of the phase transitions in NaNO3, some models have been proposed for its disordered structure. There are mainly free rotational [1], two-position disordered model [13], as described in some detail previously [14]. The free rotational model and twoposition disordered models have been identified essentially with the XY and Ising models, respectively [14]. Also, the disordering due to the reorientation of the NO3– ions has been modeled for the disordered aragonite structure [15], disordered calcite structure [4] and the mixture of those two models [16], as pointed out in a previous study [6]. Additionally, the orientational disordering in NaNO3 and CaCO3 has been studied by molecular dynamics simulation using semiempirical potential models [17,18]. The temperature dependence of the specific heat Cp and of the lattice parameters in calcite (CaCO3) and in nitratine (NaNO3) have also been simulated [19]. In these two structures, an orientational ordering of the carbonate and nitrate groups occurs as the temperature decreases below the transition temperature. At high temperatures, the nitrate and carbonate groups are orientationally disordered about their three fold axes [14]. This is the orientational long-range disorder above Tc, whereas there exists a positional long range order below Tc [6]. At low temperatures, sodium nitrate crystallizes in the ordered calcite structure which has the  space group (R3c) with two formula units of NaNO3 per unit cell. Above Tc, the crystal changes the high-temperature phase that has one NaNO3 molecule with the crystal symmetry R3m.
It has been observed from the Raman spectra that the change from complete order to complete disorder for NaNO3 is spread out over a wide temperature range of about 100˚C [6]. It has been pointed out that the Raman spectrum of NaNO3 at high temperatures is a combination of the ordinary first-order Raman spectrum and the disorder-induced spectrum [6]. Above Tc, a central peak in the low-frequency Raman spectra of sodium nitrate has been observed [7]. It has been obtained that the Raman intensity and the bandwidth of this central peak due to a motion of  ions, exhibit an anomalous behaviour at Tc with increasing temperature [7]. Thus, the light scattering spectra of the order-disorder motion of
  ions is accompanied with the phase transition of NaNO3. So, the anomalous part of the temperature dependence of the Raman intensity of the central peak has been associated with the order parameter [7] which is an average value of the difference in number of
  ions in the two stable positions [4]. As a result of this, the anomalous part of the Raman intensity is due to rearrangement of
  ions around the z axis [7].
In this study we analyze the temperature dependence of the observed Raman intensity of the central peak [7] below Tc in NaNO3. This analysis of the Raman intensity associated with the order parameter is performed according to a power-law formula with the critical exponent β. Using the Raman intensity as the order parameter, the damping constant of the central peak is calculated at various temperatures for NaNO3. The expressions derived for the damping constant from the models of the pseudospinphonon interaction and of the energy fluctuation [20,21] are used. The damping constant is fitted to the experimentally measured Raman bandwidths of the central peak in NaNO3.
Below, we give our analysis of the spectral intensity and our calculation of the damping constant of the central peak of NaNO3 in Section 2. Section 3 gives our discussion of the results. Finally, conclusions are given in Section 4.
2. Analysis of the Spectral Intensity and Calculation of the Bandwidth
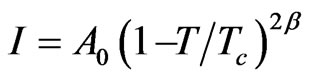
We analyzed the central-peak intensity measured [7] as a function of temperature near Tc in NaNO3 according to a power-law expression given by
 (1)
(1)
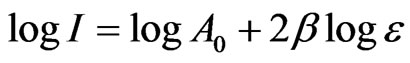
where β is the critical exponent for the order parameter and A0 is the amplitude. Since the intensity (order parameter) increases as the temperature decreases below Tc, the observed Raman intensity can be analyzed according to Equation (1). The anomalous part of the intensity in the x(zz)y geometry was analyzed using the experimental data [7]. The fitted parameters β and A0 were deduced within the range of the reduced temperature from our analysis. This analysis was performed by taking the logarithm of both sides of Equation (1) which gives
 (2)
(2)
where the reduced temperature is  with the transition temperature Tc = 549.1 K for NaNO3.
Table 1 gives the fitted parameters of the critical exponent β for the order parameter and the amplitude A0 within the interval of the reduced temperature ε for NaNO3. Figure 1 gives our plot of the spectral intensity as a function of temperature in a log-log scale according to Equation (2) for NaNO3. Figure 1 represents the increasing

Table 1. Values of the critical exponent β for the order parameter and the amplitude A0 from the analysis of the spectral intensity according to Equation (1) for NaNO3.
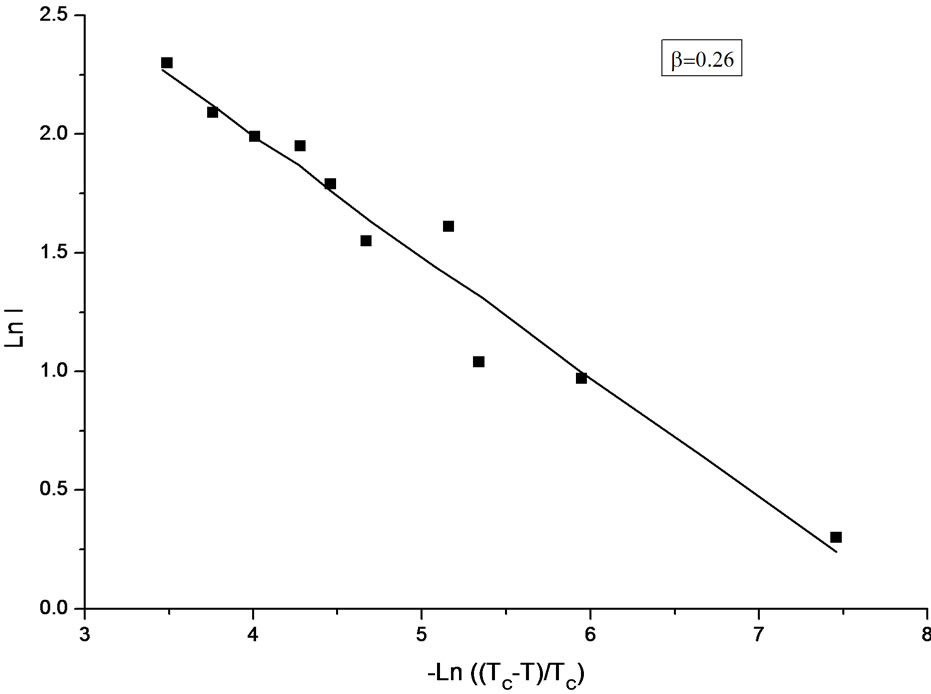
Figure 1. The anomalous part of the observed Raman intensity [7] as a function of temperature in a log-log scale below Tc according to Equation (2) in NaNO3.
intensity as the temperature decreases, which corresponds to the difference between the extrapolated (above Tc) and observed intensity [7] below Tc in the temperature region from 530 to 548 K. In a log-log scale, ln I decreases against—ln , as shown in Figure 1.
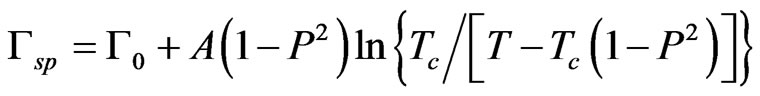
We also calculated the temperature dependence of the damping constant close to the order-disorder phase transition (Tc = 548 K) in NaNO3. This calculation was performed using the expressions,
 (3)
(3)
 (4)
(4)
where Г and  represent background damping constants and, A and A' are constants. In Equations (3) and (4), P defines the order parameter and it is simply proportional to the spectral intensity given by
 (5)
(5)
where I0 is the maximum intensity of a spectral band. Equations (3) and (4) have been derived as approximate relations in earlier studies [20,21]. Using the Matsushita’s expression [22] for the damping constant Laulicht and Lucnar [20,21] have been able to obtain the temperature dependence of the linewidth as approximate relations (Equations (3) and (4)) and they have applied for their analysis of the Raman linewidths for the ferroelectric material, KH2PO4. In this study, we also used Equations (3) and (4) to calculate the temperature dependence of the Raman linewidths of the central peak, as measured experimentally [7] for NaNO3. Thus, using the temperature dependence of the Raman intensity as P2 in Equations (3) and (4) below Tc, we obtained the temperature dependence of the Raman bandwidth in NaNO3. By fitting Equations (3) and (4) to the observed bandwidth of the central peak in the x(zz)y geometry [7], we determined the background bandwidths Г0 and , and also the amplitudes A and A', as given in Table 2. Since there is no ordering (P = 0) above Tc, Equations (3) and (4) were fitted to the observed bandwidths of the central peak in the x(zz)y geometry [7] at various temperatures.
We plot in Figure 2 our calculated Raman bandwidths of the central peak as a function of temperature below and above the transition temperature (Tc = 548 K) in NaNO3. The observed Raman bandwidths of the central peak [7] are also plotted in Figure 2.
3. Discussion
The temperature dependence of the Raman intensity was analyzed here according to a power-law formula (Equation 1) with the exponent value of β = 0.26 for the order parameter P, as given in Figure 1. This analysis was performed using the intensity data [7]. Considering the temperature dependence of the order parameter as Pα
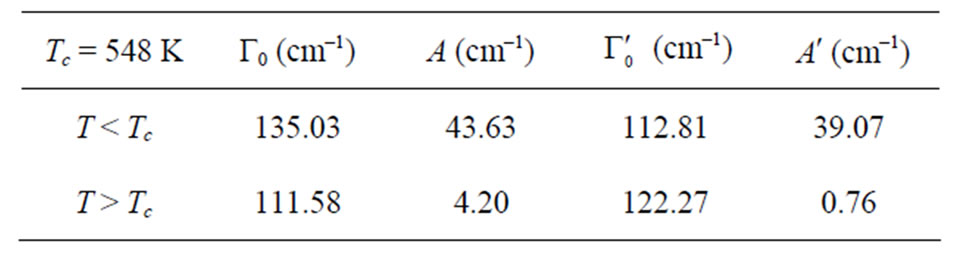
Table 2. Values of the background bandwidths Г0 and , and the amplitudes A and A' according to Equations (3) and (4) for the central peak in the x(zz)y geometry [7] in NaNO3.
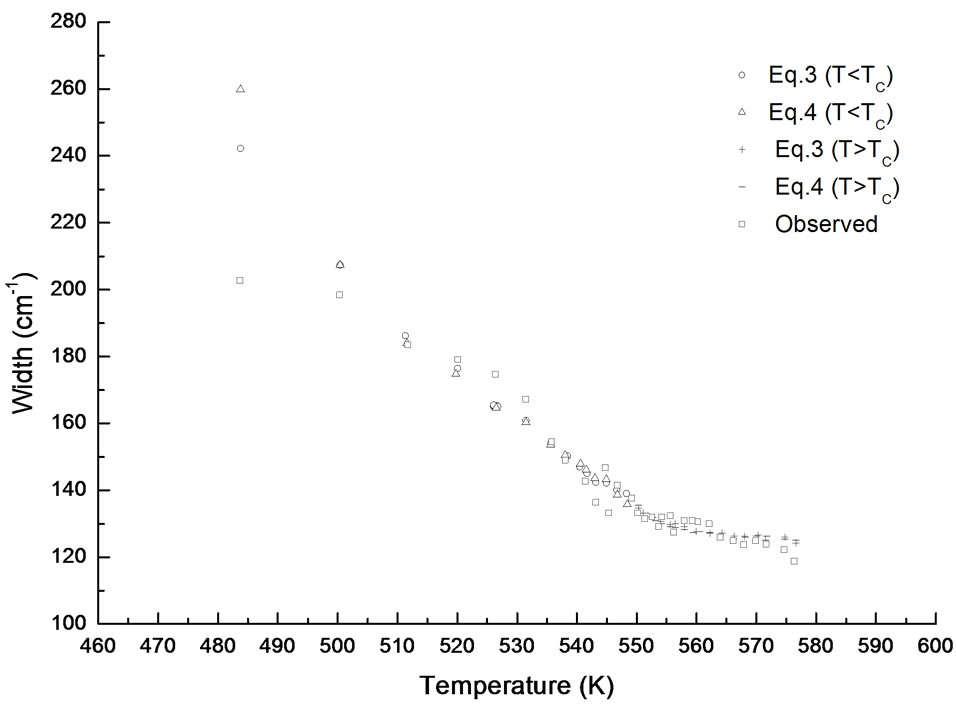
Figure 2. Temperature dependence of the bandwidth calculated from Equations (3) and (4) above and below the transition temperature (Tc = 548 K) in NaNO3. The observed bandwidths of the central peak in the x(zz)y geometry [7] are also given here.
 and the relationship between the intensity and the order parameter as I α P2, Equation (1) was used to analyze the temperature dependence of the intensity which increases with decreasing temperature below Tc. The β values for the order parameter which we deduced from the Raman intensity indicate that the order-disorder transition in NaNO3 is the tricritical transition. This is due to the fact that the observed Raman intensity [7] considered as an order parameter exhibits largely a continuous change with the temperature. It has been pointed out previously [14] that this is the orientational order-disorder transition which occurs through continuous planar rotations of the nitrate group rather than discrete jumps.
It has been obtained [7] the value of  as the critical index of the order parameter by analyzing the anomalous part of their measured Raman intensity in the temperature range between about 450 K and Tc. In this study, we reanalyzed their observed central-peak intensity in a relatively narrow temperature range of 530 to 548 K (Tc), as stated above (Figure 1), where the anomalous behavior of the central peak is more pronounced [7]. When the temperature range was narrowed, as performed in this study, the β value decreased from
  to 0.26, which indicates a cross-over from a second order (β = 0.5) to a tricritical (β = 0.25) transition within the mean field theory in NaNO3. On the other hand, the birefringence data gives β = 0.22 for 500 K < T < Tc and the transition is tricritical (β = 0.25) for T < 500 K in NaNO3 [23,24]. It has been explained that this apparent change in the value of β from 0.25 to 0.22 in NaNO3 is due to strong critical fluctuations at temperatures close to Tc in NaNO3, where the mean field theory does not hold [14]. This is not in agreement with our analysis which gives β = 0.26 closer to the tricritical value of 0.25 as predicted from the mean field theory in the interval of the reduced temperature
  (Table1). Our exponent value is also closer to the theoretical value of β = 0.228 (2) for the two-dimensional XY model.
The temperature dependence of the Raman bandwidth which increases (Figure 2), is in accordance with decreasing intensity of the central peak as the temperature decreases, as observed experimentally [7]. Our damping constant calculated according to Equations (3) and (4) describes the observed behavior of the temperature dependence of the Raman bandwidth for the central peak above and below Tc in NaNO3 (Figure 2). Below about 500 K, the observed bandwidth seems to be independent of temperature and its value of about 200 cm–1 remains the same at low temperatures [7]. However, our predicted values of the damping constant Г increase rapidly below 500 K according to Equations (3) and (4). This indicates that the damping constant (Raman bandwidth) can be predicted in accordance with the experimental results down to about 500 K below which Equations (3) and (4) are no longer valid for the order-disorder phase transition in NaNO3. This is also in accordance with our analysis of the Raman intensity for the central peak with the critical exponent value of β = 0.26 in the temperature interval of 530 K < T < 548 K (Table 1).
Increasing the Raman intensity and narrowing the bandwidth of the central peak with increasing temperature, as observed experimentally [7] indicate that a “central mode” exists due to rearrangements of  ions close to the order-disorder phase transition in NaNO3, as suggested previously [7]. This also appears in the disorder-induced Raman spectrum at high temperatures, which becomes effective in addition to the ordinary first-order Raman spectrum for NaNO3. This central mode which is related to the order-disorder phase transition in NaNO3 close to Tc, becomes very active far above Tc where the NO3– ions are no longer restricted to any fixed orientation, as suggested previously [7]. This leads to the melting phenomena in NaNO3.
4. Conclusion
The temperature dependence of the observed Raman intensity (order parameter) was analyzed using a power-law formula. From our analysis of the Raman intensity for the central peak, it is indicated that the exponent value of β = 0.26 describes the observed behavior as the tricritical transition in NaNO3 in a given temperature interval. Also, the temperature dependence of the damping constant calculated here is in agreement with the observed Raman bandwidth in NaNO3. This analysis given here can be applied to the central peaks close to order disorder phase transitions in some other crystals.
REFERENCES
- F. C. Kracek, E. Posnjak and S. B. Hendricks, “Gradual Transition in Sodium Nitrate II. The Structure at Various Temperatures and Its Bearing on Molecular Rotation,” Journal of American Chemical Society, Vol. 53, No. 9, 1931, pp. 3339-3348. doi:10.1021/ja01360a016
- R. J. Reeder, S. A. T. Redfern and E. Salje, “Spontaneous Strain at the Structural Phase Transition in NaNO3,” Physics and Chemistry of Minerals, Vol. 15, No. 6, 1988, pp. 605-611. doi:10.1007/BF00311033
- Y. Takeuchi and Y. Sasaki, “Elastic Properties and Thermal Expansion of NaNO3 Single Crystal,” Journal of Physical Society of Japan, Vol. 61, 1992, pp. 587-595. doi:10.1143/JPSJ.61.587
- Y. Shinnaka, “Anion Rotational Disorder in Sodium Nitrate,” Journal of Physical Society of Japan, Vol. 19, 1964, pp. 1281-1290. doi:10.1143/JPSJ.19.1281
- I. Nakagawa and J. L. Walter, “Optically Active Crystal Vibrations of the Alkali & #8208; Metal Nitrates,” Journal of Chemical Physics, Vol. 51, 1969, pp. 1389-1397.
- T. Y. Shen, S. S. Mitra, H. Prask and S. F. Trevino, “Order-Disorder Phenomenon in Sodium Nitrate Studied by Low-Frequency Raman Scattering,” Physical Review, Vol. 12, No. 10, 1975, pp. 4530-4533. doi:10.1103/PhysRevB.12.4530
- H. Yasaka, A. Sakai and T. Yagi, “A Central Peak in the Order-Disorder Phase Transition of Sodium Nitrate,” Journal of Physical Society of Japan, Vol. 54, 1985, pp. 3697- 3700. doi:10.1143/JPSJ.54.3697
- V. C. Reinsborough and F. E. W. Wetmore, “Specific Heat of Sodium Nitrate and Silver Nitrate by Medium High Temperature Adiabatic Calorimetry,” Australian Journal of Chemistry, Vol. 20, No. 1, 1967, pp. 1-8. doi:10.1071/CH9670001
- T. Jriri, J. Rogez, C. Bergman and J. C. Mathieu, “Thermodynamic Study of the Condensed Phases of NaNO3, KNO3 and CsNO3 and Their Transitions,” Thermochimica Acta, Vol. 266, 1995, pp. 147-161. doi:10.1016/0040-6031(95)02337-2
- R. A. Bradley, E. Lanzendorf, M. I. McCarthy, M. Orlando and W. P. Hess, “Molecular NO Desorption from Crystalline Sodium Nitrate by Resonant Excitation of the
 π - π* Transition,” Journal of Physical Chemistry, Vol. 99, No. 30, 1995, pp. 11715-11721. doi:10.1021/j100030a015
 - M. I. McCarthy, K. A. Peterson and W. P. Hess, “Electronic Structure of Sodium Nitrate: Investigations of Laser Desorption Mechanisms,” Journal of Physical Chemistry, Vol. 100, No. 16, 1996, pp. 6708-6714. doi:10.1021/jp953108n
- N. G. Petrik, K. Knutsen, E. Paparazzo, S. Lea, D. M. Camaion and T. M. Orlando, “Electron Beam Induced Damage of NaNO3 Single Crystals: An Energy, Temperature, and Quantum State Resolved Study,” Journal of Physical Chemistry, Vol. 104, No. 7, 2000, pp. 1563-1571. doi:10.1021/jp993310g
- J. A. A. Ketalaar and B. Strijk, “The Atomic Arrangement in Solid Sodium Nitrate at High Temperatures,” Recueil des Travaux Chimiques des Pays-Bas et de la Belgique, Vol. 64, 1945, p. 174.
- M. J. Harris, “A New Explanation for the Unusual Critical Behavior of Calcite and Sodium Nitrate, NaNO3,” American Mineral, Vol. 84, 1999, pp. 1632-1640.
- S. Siegel, “Effect of Neutron Bombardment on Order in the Alloy Cu3Au,” Physical Review, Vol. 75, No. 12, 1949, pp. 1823-1824. doi:10.1103/PhysRev.75.1823
- K. O. Strømme, “The Crystal Structure of Sodium Nitrate in the High-Temperature Phase,” Acta Chemica Scandinavica, Vol. 23, 1969, pp. 1616-1624. doi:10.3891/acta.chem.scand.23-1616
- R. M. Lynden-Bell, M. Ferrario, I. R. McDonald and E. Salje, “A Molecular Dynamics Study of Orientational Disordering in Crystalline Sodium Nitrate,” Journal of Physics Condensed Matter, Vol. 1, No. 37, 1989, pp. 6523- 6542. doi:10.1088/0953-8984/1/37/002
- M. Ferrario, R. M. Lynden-Bell and R. M. McDonald, “Structural Fluctuations and the Order-Disorder Phase Transition in Calcite,” Journal of Physics Condensed Matter, Vol. 6, No. 7, 1994, pp. 1345-1358. doi:10.1088/0953-8984/6/7/007
- J. Liu, C. G. Duan, M. M. Ossowski, W. N. Mei, R. W. Smith and I. R. Hardy, “Simulation of Structural Phase Transition in NaNO3 and CaCO3,” Physical Chemistry of Minerals, Vol. 28, No. 8, 2001, pp. 586-590. doi:10.1007/s002690100191
- I. Laulicht and N. Lucnar, “Internal Mode Line-Broadening by Proton Jumps in KH2PO4,” Chemical Physics Letters, Vol. 47, No. 2, 1977, pp. 237-240. doi:10.1016/0009-2614(77)80008-0
- I. Laulicht, “On the Drastic Temperature Broadening of Hard Mode Raman Lines of Ferroelectric KDP Type Crystals near Tc,” Journal of Physics and Chemistry of Solids, Vol. 39, No. 8, 1978, pp. 901-906. doi:10.1016/0022-3697(78)90153-1
- M. Matsushita, “Anomalous Temperature Dependence of the Frequency and Damping Constant of Phonons near Tλ in Ammonium Halides,” Journal of Chemical Physics, Vol. 65, No. 1, 1976, pp. 23-28. doi:10.1063/1.432804
- W. C. K. Poon and E. Salje, “The Excess Optical Birefringence and Phase Transition in Sodium Nitrate,” Journal of Physics C: Solid State Physics, Vol. 21, No. 4, 1988, pp. 715-729. doi:10.1088/0022-3719/21/4/009
- W. W. Schmahl and E. Salje, “X-Ray Diffraction Study of the Orientational Order Disorder Transition in NaNO3: Evidence for Order Parameter Coupling,” Physics and Chemistry of Minerals, Vol. 16, No. 8, 1989, pp. 790-798. doi:10.1007/BF00209703
NOTES
*Corresponding author.