Journal of Surface Engineered Materials and Advanced Technology
Vol.2 No.3A(2012), Article ID:21437,10 pages DOI:10.4236/jsemat.2012.223037
Elucidation and Identification of Double-Tip Effects in Atomic Force Microscopy Studies of Biological Structures
![]()
1State Key Laboratory of Food Science and Technology, Nanchang University, Nanchang, China; 2Institute for Advanced Study, Nanchang University, Nanchang, China.
Email: dr_yongchen@hotmail.com
Received May 10th, 2012; revised June 13th, 2012; accepted June 23rd, 2012
Keywords: Nanobiotechnology; Atomic Force Microscopy (AFM); Double-Tip Artifact; Biological Specimens; Linear DNA
ABSTRACT
While atomic force microscopy (AFM) has been increasingly applied to life science, artifactual measurements or images can occur during nanoscale analyses of cell components and biomolecules. Tip-sample convolution effect is the most common mechanism responsible for causing artifacts. Some deconvolution-based methods or algorithms have been developed to reconstruct the specimen surface or the tip geometry. Double-tip or double-probe effect can also induce artifactual images by a different mechanism from that of convolution effect. However, an objective method for identifying the double-tip/probe-induced artifactual images is still absent. To fill this important gap, we made use of our expertise of AFM to analyze artifactual double-tip images of cell structures and biomolecules, such as linear DNA, during AFM scanning and imaging. Mathematical models were then generated to elucidate the artifactual double-tip effects and images develop during AFM imaging of cell structures and biomolecules. Based on these models, computational formulas were created to measure and identify potential double-tip AFM images. Such formulas proved to be useful for identification of double-tip images of cell structures and DNA molecules. The present studies provide a useful methodology to evaluate double-tip effects and images. Our results can serve as a foundation to design computerbased automatic detection of double-tip AFM images during nanoscale measuring and imaging of biomolecules and even non-biological materials or structures, and then personal experience is not needed any longer to evaluate artifactual images induced by the double-tip/probe effect.
1. Introduction
Nanotechnology has been emerging as a powerful tool for the studies of life science [1]. One of the important research endeavors is to understand nanoscale structures and life events through the nano-measuring and imaging of cells [2-6] or thin sections of them [7], cellular organelles [8], proteins [9-13] , polysaccharide [14], DNA [15] and others using the instruments such as scanning tunneling microscopy (STM), near field scanning optical microscope (NSOM) [16-18] and atomic force microscope (AFM) [19-21]. It is important to note that artifactual measurements or images can occur during nanoscale analyses of cell components and biomolecules using the current-generation instruments. Artifactual or “ghost” images due to errors in STM and AFM probing have been described by some investigators since the invention of scanning probe techniques [22-25] . Such artifactual images appear to be associated with steep corrugations or sharp structural features on a sample surface [26], and with the occurrence of an “extra-tip” on the scanning tipsample interface (double-tip or multiple-tip effect and tip asymmetry).
Since the artifactual measurements or images derived from nanoscale operation can certainly jeopardize our understanding of the nano-world, the mechanisms by which such artifactual images develop have been intensively studied and well known [27]. Tip-sample geometric convolution effect is the most common mechanism responsible for causing artifacts especially when the size of an imaged object or feature is on the same scale as the radius of curvature of the AFM tip. At present, some methods or algorithms for reconstruction of specimen surfaces or tip geometries have been developed mainly by deconvolution [28,29].
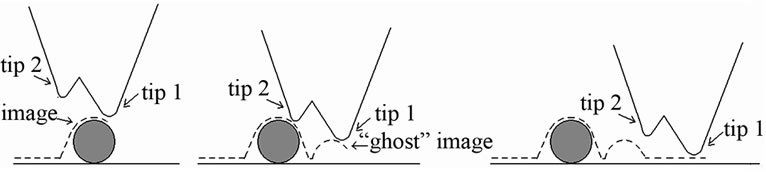
The mechanism of double-tip/probe effect is different from that of convolution effect (Figure 1) [30]. Tip convolution occurs when the curvature radius of the tip of a single-tip AFM probe is on the same size scale as the imaged object of feature, and the tip images the object of feature only one time during the imaging process; for
 (a) (b) (c)
Figure 1. Schematics of the mechanism of double-tip effect. The double-tip AFM probe actually images the object twice, getting an image first at the location of the object by tip 1 (a) and then a “ghost” image nearby by tip 2 (b). During the imaging process of each tip, convolution effect may occur if the size of the object is on the same scale as the curvature radiuses of the two tips.
double-tip effect, however, the two tips of a double-tip probe scan the surface of an object separately, forming two images (a real image and a ghost image) of the object at two different but adjacent locations (Figure 1) [30]. Convolution effect may occur during the imaging process of each of the two tips if the size of the imaged object is on the same scale as the curvature radiuses of the two tips.
Due to the distinction in mechanism, the previous well-developed, deconvolution-based methods or algorithms may be unapplicable to the artifactual images induced by double-tip/probe effect. Unfortunately, up to now, there have been no objective methods to facilitate the identification or detection of potential artifacts caused by double-tip/probe effect. To fill this important gap, we made use of our AFM expertise to explore a methodology to detect potential artifactual images derived double-tip/probe effect by analyzing cell structures and DNA or proteins. Generally, it is hard to identify the artifacts caused by double-tip/probe effect especially for the linear, tangling structures or molecules. To analyze the array pattern of real and ghost images makes it possible to identify these artifacts since the distance and angle between the two tips of a double-tip AFM probe are all fixed.
2. Materials and Methods
2.1. Human MSC Cultures
Bone marrow (BM) from human fetus thighbone was aspirated into 10 ml syringes within 4 h of harvest. The marrow samples were washed and centrifuged twice (1000 rpm for 5 min) in mesenchymal stem cell (MSC) growth medium (MSCGM; Osiris Therapeutics, USA) before suspension in fresh MSCGM. 70% Percoll (Sigma, USA) was added into the suspension, and then centrifuged at 1500 rpm for 15 min. The suspension with MSCs was added to MSCGM medium supplemented with 15% FBS. The number of mononuclear cells was determined with a hemocytometer and plated in 25-cm2 tissue culture flasks at a density of approximately 1 × 10⁵ BM mononuclear cells/cm2. Cells were incubated at 37˚C with 5% fully humidified CO2. The first medium change occurred after 24 h and then every 3 - 4 days thereafter. Then they were processed by trypsinization (0.25% trypsin and 1 mM EDTA for 5 min at 37˚C) and re-expanded to confluency. After a second passage, the cells were counted and assessed for viability by means of Trypan Blue dye exclusion. Before AFM imaging, MSCs were incubated on the surface of clear cover slips treated with poly-L-lysine at 37˚C with 5% CO2 at saturated humidity.
2.2. Preparation of the Cell and Biomolecule Samples for AFM
Microscope cover slips were cleaned by means of standard surfactant and rinsed with distilled water. Before AFM imaging, sterilized cover slips were placed in cell culture dishes containing freshly passaged MSC cells. The cells were cultured in conventional culture media in all cases and incubated at 37˚C with 5% CO2. After 2 days, the cover slips with MSCs were taken from the medium directly. After air-fixing rapidly by waving the slip vigorously, a 1% glutaraldehyde solution was then added for several minutes to rigidify the cells. The cells were washed with PBS and then air-dried for 10 min. The sample was then examined under the optical microscope and was imaged by AFM.
Calf thymus DNA (Sigma) was dissolved at 1 mg/ml in Milli-Q water. A 3 µl drop of the DNA solutions was deposited onto a freshly cleaved mica surface. Approximately 1 min later, the residual solution on the mica was carefully removed by a slice of filter paper, followed by air-drying. Other DNA solutions were maintained at room temperature for several days, and then sampled. At this time, most DNA molecules were hydrolyzed into spherical particles. Collagen type I (Sigma) were dissolved in acetic acid, were purposely mixed with unpurified water containing particles, were deposited onto mica surface, and then were scanned by AFM probe.
2.3. Atomic Force Microscopy
The cover slip was mounted on an AFM stage, and the integral video camera was used to locate the regions of interest. The samples were observed with an AutoProbe CP AFM (Thermomicroscopes, USA) in tapping mode. Microfabricated silicon nitrite cantilevers (Park Scientific Instruments) with sharp tips with a tip radius of curvature 10 nm and a force constant of approximately 2.8 N/m were used. Observation was carried out in air at room temperature. The scan speed of the tip was 1 Hz. The AFM images were planar leveled using the software (Thermomicroscopes Proscan Image Processing Software Version 2.1) provided with the instrument. Using the line analysis function of the software, widths and heights of the regions of interest were determined, and the height profiles of cross sections were obtained. Images of spheres and linear molecules or structures were measured for various line parameters such as horizontal and vertical lines connecting the real and ghost molecule, and the line-related angles using the line-measuring AFM software.
2.4. Statistical Analyses
Data are expressed as the mean ± SD. ANOVA and student t test analyses were undertaken to determine the extent to which Φ and x values obtained by measurements resemble those Φ and x values calculated by mathematic formulas.
3. Results and Discussion
3.1. Analyses of Double-Tip Images of Cell Structures and Biomolecules
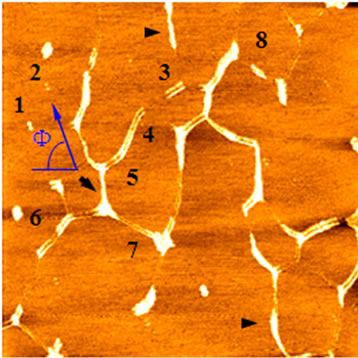
Artifacts induced by double-tip or double-probe effect have been briefly described [31-34] and the underlying mechanism has been clarified [30]. However, an effective method for objectively identifying these artifacts is needed. As an initial effort to dissect and identify double-tip effects in AFM practice, we sought to analyze and define double-tip images of cell structures and biomolecules. A mesenchymal stem cell (MSC) with fibrillar branches was scanned by AFM and assessed for double-tip images of cellular structures. First glance of the AFM topographic image of MSC on the cover slip simply revealed the occurrence of extensive and dense fibrillar structures around the cell (Figure 2(A)). Careful examination allowed the identification of double-tip images for some of fibrils (marked 1-6, Figure 2(A)), although many tiny fibrillar branches did not show ghost (false) images in both the low-magnified and high-magnified (bottom left) topographic images. The double-tip images were readily illustrated by the sequential heightprofile analyses of topographic images in six different cross sections along one of the fibrillar branches (Figure 2(A)). Evidently, the width and height of the ghost fibril images (a short arrow) were smaller than those of the real fibril images (a long arrow). Moreover, with the real fibril image getting smaller, the height of its ghost fibril image also became smaller and lower, and even disappeared (arrowhead) when the height of the real branch reached around 30 nm. The double-tip phenomenon of cell structures was more readily revealed in high-magnified topography than in the low-magnified image (Figure 2(B)). Several morphological changes that occurred as a result of double-tip effect were shown in the magnified image of the cell. First, the repetition of branches (green doted areas) was noticeable. Secondly, edges of cell were extended (pink dotted areas). Finally, large protuberances on membrane surface were doubled (blue circles).
We then sought to analyze double-tip phenomena in imaging studies of DNA molecules and single collagen fibrils. DNA specimens containing both linear single-chain DNA and hydrolyzed DNA spheres were imaged by a high-quality AFM tip. Initial AFM scanning showed a real image of linear single-chain DNA and individual spheres of hydrolyzed DNA (Figures 3(a) and (b)). However, the subsequent scanning of the upper area containing a contaminated particle (black arrow) by the same AFM tip resulted in the development of a double-tip and the occurrence of double-tip images of the both linear DNA and hydrolyzed DNA spheres (Figure 3(b)). The single-chain DNA became double-chain DNA in the double-tip image; the hydrolyzed DNA spheres were duplicated. In some cases, these false double chain-like DNA molecules were comprised of a real single-chain DNA and its paralleled artifactual single-chain DNA (ghost chain). In other cases, the double-tip effect could generate the image of a widened DNA chain (arrowheads in Figure 3(b)), which looked like a fused double-chain DNA molecule (see the mathematic models below for explanation). Interestingly, double-tip images of partially hydrolyzed linear DNA could look like unwinding double helix DNA (Figure 3(c)).
Similarly, double-tip effect on individual protein molecules was also seen. Double-tip images of collagen fibrils were identified during AFM scanning and imaging of the fibrils and the defined particles that could derive a double tip (Figure 3(d)). It should be pointed out that, without these referring particles, the double-tip effect would be difficult to recognize or distinguish. These referring particles in unpurified water were purposely mixed with collagen fibrils and were deposited on mica. The AFM-tip scanning of these particles appeared to derive a double tip and the double-tip images of real and ghost fibrils (Figure 3(d)).
Next, we did mathematical analyses of the double-tip images (Figure 4), based on which four mathematic models were developed (Figure 5). Then, mathematical measurements were performed to support the models (Figure 6). Based on the four mathematic models, finally, we created formulas (Figure 7) potentially useful for calculating and identifying a potential double-tip image.
3.2. Mathematical Analyses of Double-Tip Images of Cell Structures and Biomolecules
Mathematical measurements of double-tip images should be an important step for dissecting the development of double-tip effects during AFM scanning and imaging. We used the AFM line-measuring software to measure important angles and lines connecting ghost and real molecules in a same double-tip topography. Our studies indicates that double-tip images of both spherical and
 (A)
(A)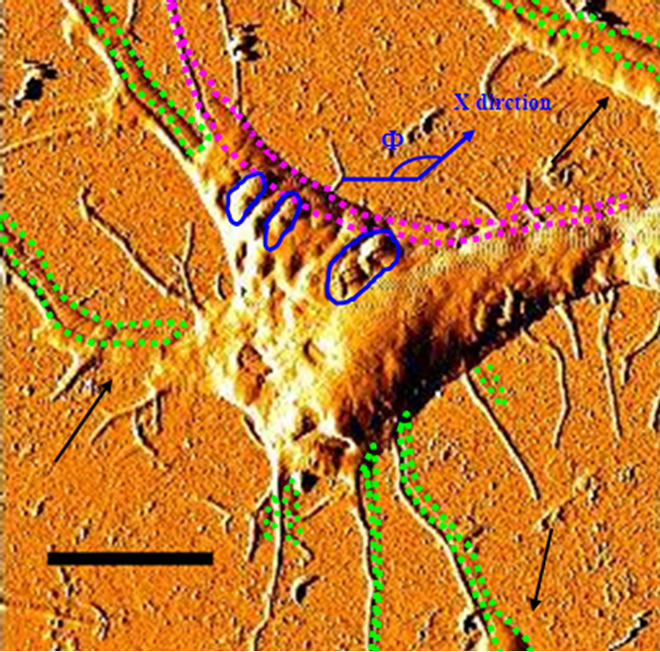 (B)
(B)
Figure 2. Analyses of double-tip images of cell structures. (A) The left panel revealed double-tip images (marked 1-6) of some fibrillar branches in a single MSC. Blue arrows indicated true images but not double-tip (ghost) images. The absence of double-tip images of a branch was also seen in the high-magnified AFM topographic image (bottom left). The right panel showed the double-tip images of a fibrillar branch by analyzing height profiles in a series of cross sections of the fibrillar branch. The cross sections a-f corresponded to the blue lines marked by letters a-f, along the branch of the cell in the left topography. The long arrow indicated the real image, and the short arrow meant the false (ghost) image induced by double-tip effect. Note that the real images were wider and higher than the ghost images. In addition, the ghost images became smaller with the branch being smaller, and no ghost was found when the height of the branch was around or less than 30 nm (the arrowhead in section F. Scan sizes of the lowand high-magnified images are 50 µm × 50 µm and 2.5 µm × 2.5 µm, respectively. Bar: 10 µm; (B) Artifactual double-tip effects on cell morphology and sizes in the higher-magnified AFM topography. Note the repeated branches and dilated edges of cell as highlighted by green and pink dashed circles. Measurement errors were easy to occur in some parts (arrows) where the ghost images overlapped with the real images. Furthermore, as shown by blue circles, some structures on cell membrane surface might also show structural ghosts that were difficult to be distinguished. Scan size: 20 µm × 20 µm. Bar: 5 µm.
 (a)
(a)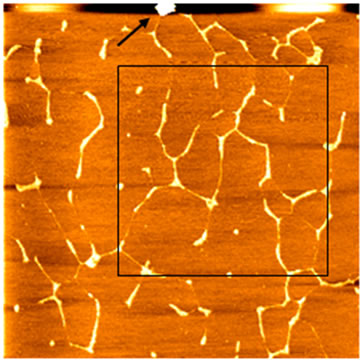 (b)
(b)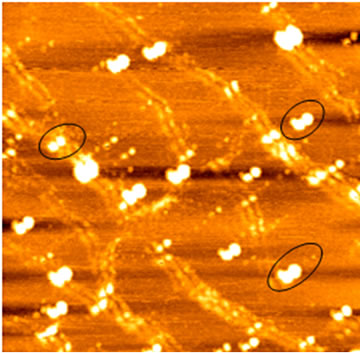 (c)
(c)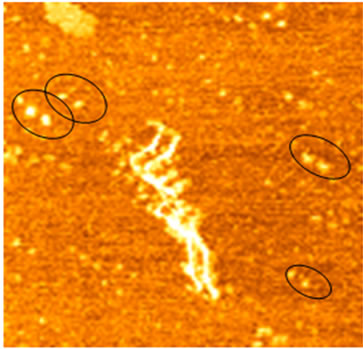 (d)
(d)
Figure 3. Analyses of double-tip images of biomolecules. (a) The control true topographic image of DNA spheres and linear DNA, which was scanned by a high-quality tip from bottom to top (the fast scan direction is X). Note that there was a particle on the top (arrow) that might induce a double-tip during the subsequent scanning. Scan size: 5 µm × 5 µm; (b) The double-tip images of DNA spheres and linear DNA in the subsequent scanning of the same square area in Figure 3(a) using the same AFM tip (subsequently contaminated by the particle mentioned in Figure 3(a)). Note that in the magnified square the single DNA spheres 1 and 2 (and others) now became double spheres in the double-tip images. Single-chain linear DNA now looked like doublechain DNA-like structures due to the double-tip effect. The single linear DNA could also exhibit a widened single-chain (arrowheads), which looked like being fused together. Scan size: 3 µm × 3 µm; (c) The double-tip images of DNA spheres (in circles) and partially-hydrolyzed linear DNA molecules. The partially-hydrolyzed DNA could wrongly be interpreted as unwinding double helix DNA. Scan size: 1 µm × 1 µm; (d) The double-tip images of known particles and bundles of collagen fibrils. The particles existed in unpurified water and were purposely mixed with collagen fibrils before AFM scanning and imaging. If one did not know the contaminated particles (in circles), the doubleimages of single collagen fibrils would be difficult to recognize (purified water does not contain the practices). Scan size: 1 µm × 1 µm.
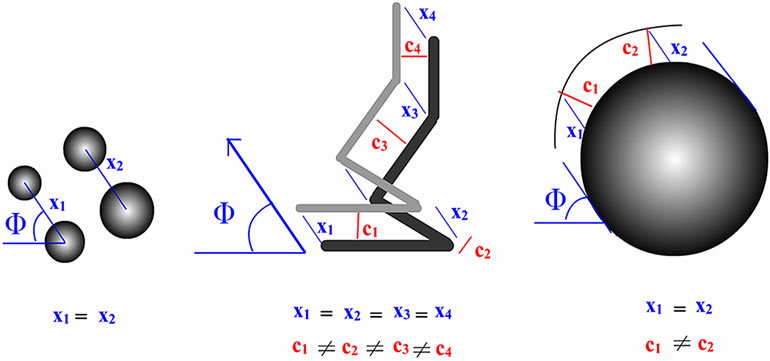
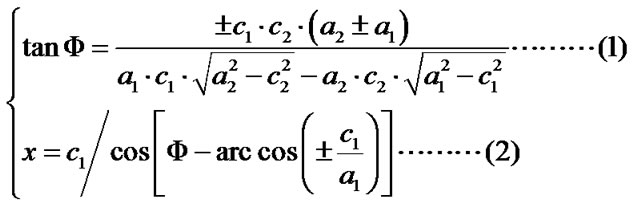
linear molecules share the same angle (Φ) which is formed by a horizontal line a and a line x connecting real and ghost molecules (Figure 4). For double-tip images of spherical fragments or structures, the x line is the same to the line c that vertically connects the real and ghost spheres in the same double-tip topography (Figure 4(a) and Figure 3(b)). For double-tip images of linear molecules or structures, the x appeared to be similar in values for each pair of ghost and real molecules, but different in values from the c (Figures 4(b), 4(c) and 3(b)). The Φ is related to the angle ω formed by a real linear molecule and an Φ-related line x. The measurements of these important angles and lines raises the possibility that mathematic models can be generated to dissect and identify double-tip images in AFM operation.
3.3. Mathematic Models for Dissecting Double-Tip Images in AFM Scanning of Cells or Biomolecules
Four mathematic models were developed to understand
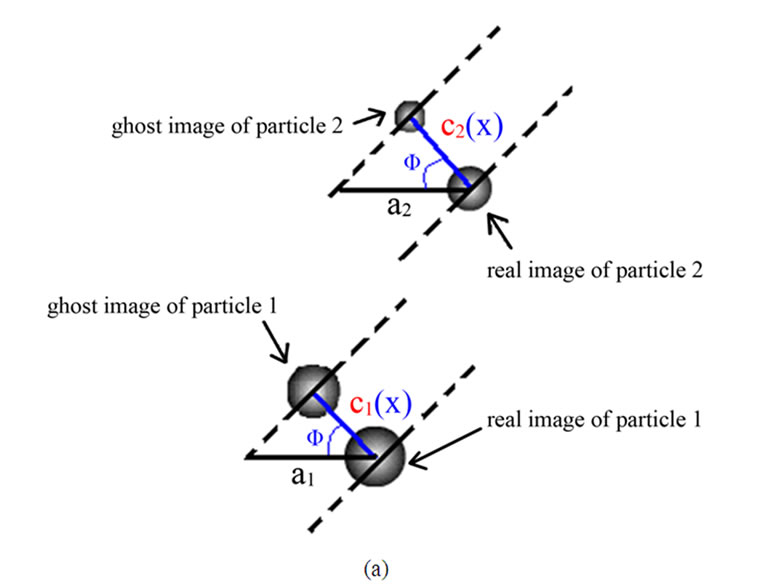
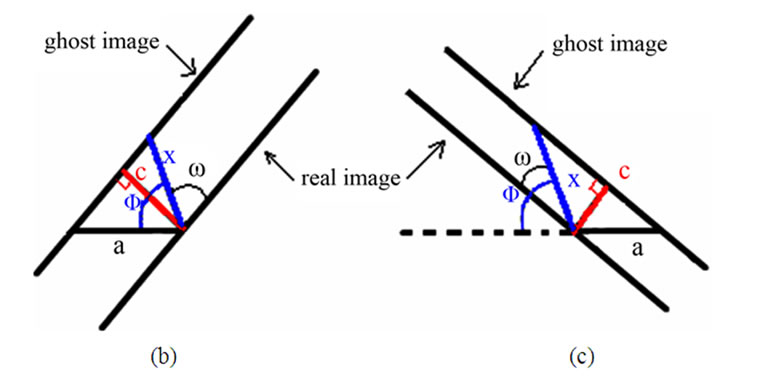
Figure 4. Mathematical analyses of double-tip images of cell structures and biomolecules. (a) Parameters for measuring double-tip images of spheres. The angle (Φ) is formed by a horizontal line a and a line x connecting real and ghost molecules. Note that the line x is the same as the line c (x = c) in the double-tip image of spheres. Here, cosΦ1= c1/a1, and cosΦ2 = c2/a2, then Φ1 = arccos(c1/a1), and Φ2 = arccos (c2/a2). Using formula 2 in Figure 7(a) (see below), the following can be expected: x = c/{cos[φ – arccos(c/a)]}, x1 = c1, and x2 = c2. Since c1 is the same as c2 (c1 = c2), it can be concluded: x1 = x2 = c1 = c2 and Φ1 = Φ2. (b) and (c) Parameters for measuring double-tip images of linear molecules in different positions or orientations. Note that the position, in which the double-tip images are located, is important for determining which group of formulas are used to calculate x and Φ (Figures 6(a) and 7).
the mechanical and optical mechanisms for the encountered ghost images derived from double-tip effects: 1) Double-tip image model of spherical molecules (Figure 5(a)). When two or more spherical molecules with different sizes were scanned by an AFM double-tip, double-tip images of these spherical molecules have following common features. The ghost spheres are as big as or smaller than real molecules. Importantly, Φ, x, or c value is the same for all pairs of real and ghost spheres in the same double-tip images. That is x1 = x2; c1 = c2; Φ1 = Φ2; c = x (Figure 4(a)). The ghost images of spheres are relatively easy to recognize; 2) Double-tip image model of curving linear molecules (Figure 5(b)). This model proposes that in the double-tip image of curving linear molecules, linear ghosts are paralleled to real linear molecules. Sometimes, such double-tip effects can make the curving linear molecules look like unwinding double helix DNA (Figures 3(c) and 5(b)). The x values are almost invariable, i.e. x1= x2 = x3 = x4 (blue lines in Figure 5(b)). However, c values (c1 – c4) are different to each other and to x in the same double-tip image (red lines in Figures 5(b) and (d)); 3) Double-tip image model of a global cell (Figure 5(c)). The double-tip effect can enlarge the circular shape of the global cell along the x line that forms the angle Φ (Figure 5(c)). Similarly, double-tip images of the cell structures share similar x (x1 = x2) but different c lines (c1 ≠ c2) (Figure 5(c)). If double-tip effect involves a global cell with branches, the ghost images of cellular branches can be explained by the model 2) as described above; 4) Double-tip image model of multiple short linear fragments or molecules (Figure 5(d)). This model helps to dissect complex double-tip images of short fragments of individual linear DNA or protein molecules in AFM scanning. Each pair of ghost and real short fragments of linear molecules has a different c but shares a same x or Φ in a given double-tip AFM topography. Importantly, two critical points, in which short fragments of linear molecules are positioned, can be defined to determine how c and x values for the images evolve in different imaging positions. When the angle ω is at 90˚, the short fragment of a real linear molecule is positioned in a critical point 1 and is perpendicular to the x that connects the ghost and real linear molecule (Figure 5(d)). In this case, the c equals to the x, and reaches its maximum value, c = x, [c = xsin(180˚ – ω); c = xsin(180˚ – 90˚); c = xsin90˚; thus c = x]. When the ω is at 180˚ or 0˚, the short fragment of a real linear molecule is positioned to the critical point 2. Thus, the c value is 0, indicating that a ghost linear molecule overlaps with or gets close to the real linear molecule. Within the range of 0˚ < ω < 90˚, an increase in the ω value is associated with an increase in c value (Figure 5(d)), which is consistent with the increases in c1 – c4 values for distances connecting ghost and real linear molecules (Figure 5(d)). In contrast, in the range of 90˚ < ω < 180˚ an increase in ω is associated with a reduction in c values (Figure 5(d)). Such a prediction is practically true for the decreases in c5 – c7 values (Figure 5(d)). This can help to explain why some ghost images are close to real images and others are far from their real images in various segments of the curving linear biomolecules shown in Figures 3(b), 3(c) and 5(b). The reason why some ghost and real images of linear molecules are fused as single widen linear molecules (shown by arrowheads in Figure 3(b)) is that the real linear molecules are close to the critical point 2 (c = 0), with minimum distance between the ghost and real linear molecules.
 (a)
(a)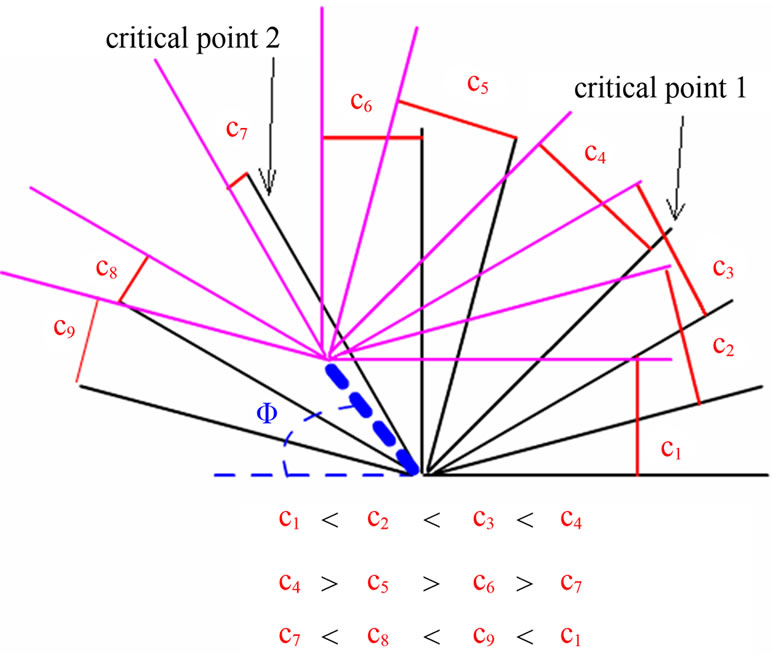 (b)
(b)
Figure 5. Four mathematic models for dissecting artifactual images caused by double-tip effect. (a) Double-tip image model of spherical molecules or structures; (b) Double-tip image model of linear curving molecules or structures. The black and gray wide lines represented the real and ghost images of the linear curving molecule, respectively; (c) Double-tip image of the spherical cell; (d) Double-tip image of multiple fragments of linear molecules. The black and pink lines meant the real and ghost images of fragments of linear molecules or cell structures, respectively. Indicated were two critical points, in which c values evolve with changes in ω (the angle formed by an x line and a real fragment).
3.4. Mathematical Measurements and Formulas for Identifying Double-Tip Images in AFM Scanning of Cells or Biomolecules
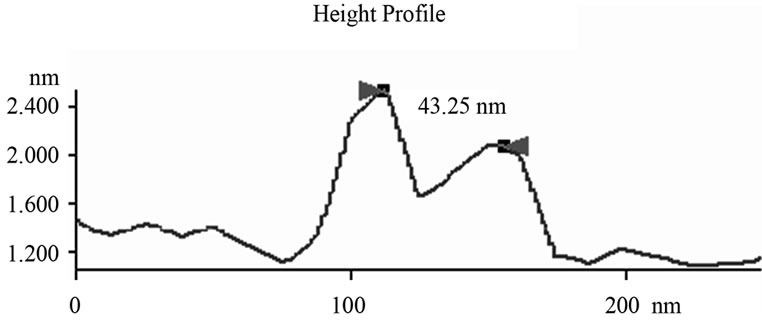
The detailed dissecting of double-tip effects in our models should make it possible to measure and identify potential double-tip images. Our mathematic models described above suggest that potential double-tip images of biomolecules share a same x but different c value. It is likely that measurements of x and c values could facilitate the recognition and identification of double-tip images of cell structures and biomolecules during AFM scanning. To prove this concept, we measured a, c, Φ and x in the defined double-tip images as shown in Figure 2. Since spherical and linear molecules or structures shared an invariant x or Φ in the same double-tip topography, we first measured the x or Φ values of ghost spheres 1 and 2 at Figure 2(d), and then made use of the Φ to measure the corresponding x, and c values for linear double-tip images 3 through 8 using the AFM linemeasuring software. The measured x values for the spherical double-tip images 1 and 2 at Figure 2(d) were very close to the c values measured by the cross-section line that vertically connects the real and ghost spheres (Figure 5(a)), confirming the scenario x = c in the double-tip image of spheres (Figure 3(a)). The measurements of linear images using the Φ derived from spherical images indicated that all the linear double-tip images 3 through 8 had very similar x values but had different c values (Table 1 and Figure 5(a)). Similarly, when cell
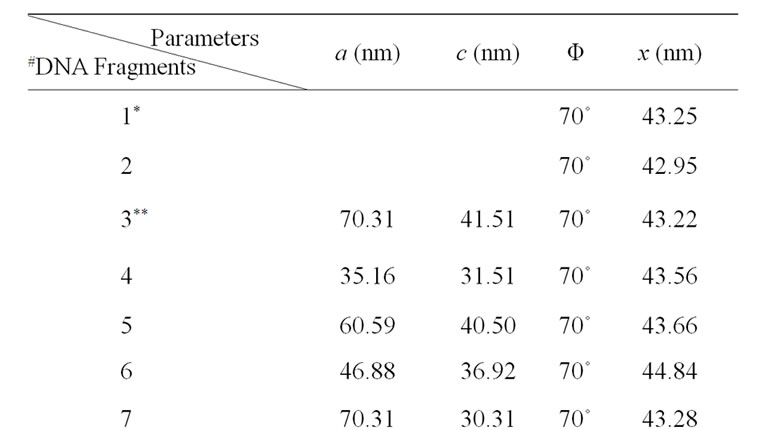
Table 1. Mathematic measurements indicated that doubletip images of DNA molecules had similar x values but different c values.
fibril ghosts were measured for c and x values at 23 different sites of double-tip images in the Figure 2(a), we found these double-tip images had the similar x but different c values (Figure 5(b)). These results suggest that mathematic measuring of x and c values is useful for recognition and identification of double-tip images at AFM scanning and imaging.
Given that the measuring of x relies on Φ, and that it is quite challenging to precisely measure the Φ if no spheres with obvious double-tip images are present in the same topography, it would be important to develop an objective and non-bias methodology to identify doubletip images. For this purpose, we created formulas to calculate and identify a potential double-tip image based on four mathematic models as described above. We then tested these formulas for the capacity to characterize and identify double-tip images. These mathematic formulas allow one to calculate x values for individual images of spheres/particles and linear molecules or their fragments (Figure 7(a)). While c and a values can be measured using the AFM line-measuring software, a Φ value can be calculated based on the formula 1. Then, the known Φ value allows one to calculate an x value using the formula 2 (Figure 7(a)). Since calculations of Φ and x using the formulas require any two random sites of potential double-tip images, three different modifications of the equations are further developed based on the each image’s position relative to the angle ω (Figures 7(b)-(d), and Figures 4(b) and (c)). Using these equations, suspected double-tip images of cell structures or molecules at multiple sites can be measured for a and c values, and calculated for Φ and x values. Double-tip images can then be determined based on the invariant x and different c values for the multiple sites in a same topography.
To test the authenticity and utility of these mathematic formulas for identifying potential double-tip images of spherical and linear molecules or their fragments, we took advantage of defined double-tip images of spherical structures or particle and linear molecules in the Figure 3(b) to measure a and c, and then calculate Φ and x at random two-site combination of double-tip images of DNA spheres and linear DNA molecules (Figure 3(b)). The results indicate that the x values are almost the same, whereas c values are completely different for the any two sites of linear DNA molecules or fragments (Table 2). The Φ and x values calculated from the formulas were indeed quite similar to those measured Φ and x values shown in Table 1. The calculation of Φ and x in 6 randomly-selected sites of cell fibril ghosts also yielded similar Φ and x values as measured in Figure 6(b) (Table 3). The data showing the “same” x but different c values are consistent with the observation of the defined double-tip images of spheres and linear molecules or
 (a)
(a)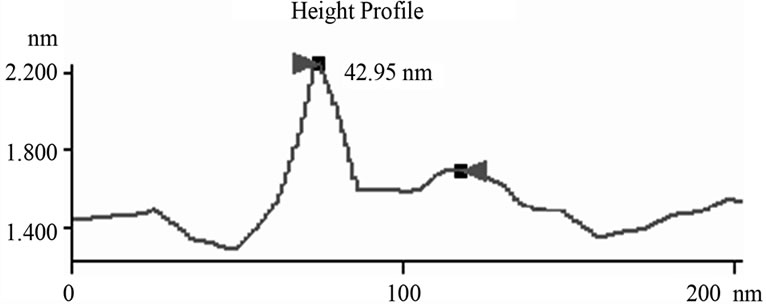 (b)
(b)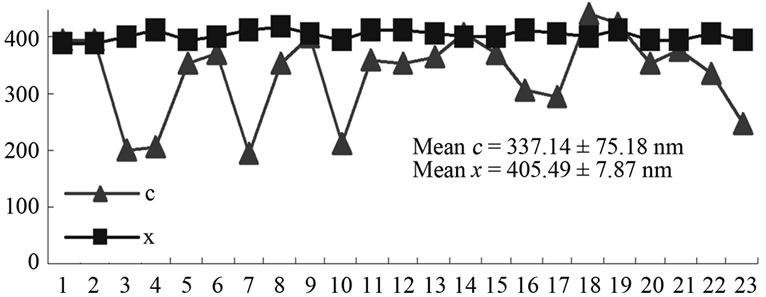 (c)
(c)
Figure 6. Mathematic measurements indicated that doubletip images of spheres and linear molecules or structures had similar x values but different c values. (a) The measured x values were similar to the c values, which were determined based on the measurements through height profile analyses of the cross section of both the real DNA sphere and ghost sphere 1 (left) and 2 (right) as marked in Figure 3(b) (see Table 1). This is consistent with what is described (x = c for double-tip spheres, Figure 4(a)); (b) Mathematic measurements of 23 sites of double-tip images of cell fibrils showed similar x values but different c values. The Φ derived from double-tip spherical structures were used to measure x and c for 23 different sites of double-tip images of cell fibrils in Figure 2(a).
structures as shown in Figures 2 and 3, suggesting that our mathematic formulas can be used to identify any pairs of real/ghost spheres and linear molecules.
Thus, the direct measurement and mathematic formulation provide a useful methodology to evaluate double-tip images. Our results can serve as a foundation to design computer-based automatic detection of double-tip/probe AFM images during nanoscale measuring and imaging of cell structures and biomolecules. However, for practical purposes of this methodology, it is necessary to recruit some specialists in other fields like computer science to figure out a practically implementable form for AFM instruments.
 (a)
(a) (b)
(b)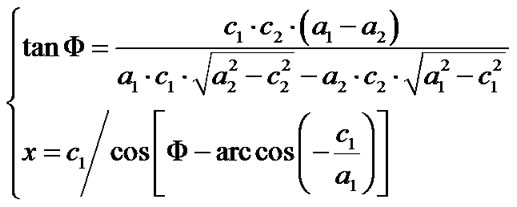 (c)
(c)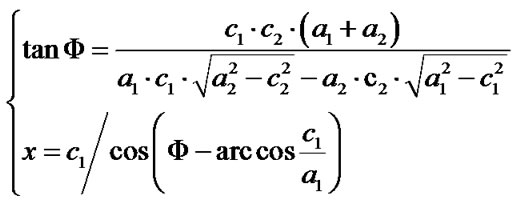 (d)
(d)
Figure 7. Mathematic formulas can be used to identify double-tip images of spherical and linear molecules or structures. (a) Basic formulas for calculating Φ and x values for suspected double-tip images; (b) Modified formula 1. This equation group was used to calculate Φ and x values when the random two sites of images for calculation were both orientated in the positions (0˚ < ω < 90˚), as shown at Figure 4(b); (c) Modified formula 2. This equation group was used to calculate Φ and x values when the random two sites of images for calculation were both orientated in the positions (90˚ < ω < 180˚) as shown at Figure 4(c); (d) Modified formula 3. This equation group was used to calculate Φ and x values when one of the random two sites of images for calculation was orientated in the positions (0˚ < ω < 90˚) as shown at Figure 4(b) and the other was in the positions (90˚ < ω < 180˚) as shown in Figure 4(c). The ω is an angle formed by the x line and the imaging line of a real linear molecule or fragment (Figure 4).
4. Acknowledgments
This work was supported by the National Natural Science Foundation of China (No. 30900340), the Open Project Program of State Key Laboratory of Food Science and Technology, Nanchang University (No. SKLF-KF-2010011), the Natural Science Foundation of Jiangxi Province (No. 2010GZN0138), the Scientific Research Foundation for Returned Overseas Chinese Scholar of State Education Ministry, and the Scientific Research Fund of Jiangxi Provincial Education Depart
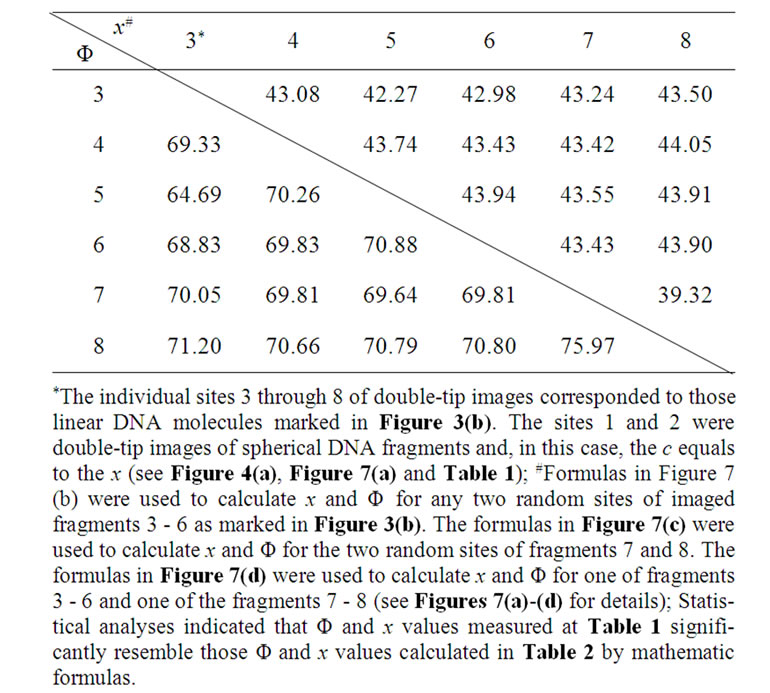
Table 2. Mathematic formulas (Figure 7) made it possible to calculate Φ and x values at random two sites of imaged molecules and to identify double-tip images of linear molecules as defined in Figure 3(b) (Mean Φ = 70.17 ± 2.23; Mean x = 43.18 ± 1.16).

Table 3. Mathematic formulas (Figure 7) made it possible to calculate Φ and x values at random two sites of imaged cell structures and to identify double-tip images of cell branches as defined in Figure 2(a) (Mean Φ = 124.68 ± 0.15; Mean x = 404.18 ± 12.93).
ment (No. GJJ10305).
REFERENCES
- R. F. Service, “Nanotechnology: Biology Offers Nanotechs a Helping Hand,” Science, Vol. 298, No. 5602, 2002, pp. 2322-2323. doi:10.1126/science.298.5602.2322
- S. W. Schneider, K. C. Sritharan, J. P. Geibel, et al., “Surface Dynamics in Living Acinar Cells Imaged by Atomic Force Microscopy: Identification of Plasma Membrane Structures Involved in Exocytosis,” Proceedings of the National Academy of Sciences of USA, Vol. 94, No. 1, 1997, pp. 316-321. doi:10.1126/science.298.5602.2322
- D. Fotiadis, Y. Liang, S. Filipek, et al., “Atomic-Force Microscopy: Rhodopsin Dimers in Native Disc Membranes,” Nature, Vol. 421, No. 6919, 2003, pp. 127-128. doi:10.1126/science.298.5602.2322
- J. L. Alonso and W. H. Goldmann, “Feeling the Forces: Atomic Force Microscopy in Cell Biology,” Life Sciences, Vol. 72, No. 23, 2003, pp. 2553-2560. doi:10.1016/S0024-3205(03)00165-6
- J. A. Dvorak, “The Application of Atomic Force Microscopy to the Study of Living Vertebrate Cells in Culture,” Methods, Vol. 29, No. 1, 2003, pp. 86-96. doi:10.1016/S1046-2023(02)00284-0
- Y. Chen, J. Cai, “Membrane Deformation of Unfixed Erythrocytes in Air with Time Lapse Investigated by Tapping Mode Atomic Force Microscopy,” Micron, Vol. 37, No. 4, 2006, pp. 339-346. doi:10.1016/j.micron.2005.11.011
- Y. Chen, J. Cai, C. Wang, et al., “Atomic Force Microscopy Imaging and 3-D Reconstructions of Serial Thin Sections of a Single Cell and Its Interior Structures,” Ultramicroscopy, Vol. 103, No. 3, 2005, pp. 173-182. doi:10.1016/j.ultramic.2004.11.019
- L. F. Jimenez-Garcia and R. Fragoso-Soriano, “Atomic Force Microscopy of the Cell Nucleus,” Journal of Structural Biology, Vol. 129, No. 2-3, 2000, pp. 218-222. doi:10.1006/jsbi.2000.4233
- J. G. Forbes and G. H. Lorimer, “Structural Biology: Unraveling a Membrane Protein,” Science, Vol. 288, No. 5463, 2000, pp. 63-64. doi:10.1126/science.288.5463.63
- G. H. Thomas, “New Routes to Membrane Protein Structures. Practical Course: Current Methods in Membrane Protein Research,” EMBO Report, Vol. 2, No. 3, 2001, pp. 187-191. doi:10.1093/embo-reports/kve049
- T. Osada, A. Itoh and A. Ikai, “Mapping of the ReceptorAssociated Protein (RAP) Binding Proteins on Living Fibroblast Cells Using an Atomic Force Microscope,” Ultramicroscopy, Vol. 97, No. 1-4, 2003, pp. 353-357. doi:10.1016/S0304-3991(03)00060-3
- Y. Yang, H. Wang and D. A. Erie, “Quantitative Characterization of Biomolecular Assemblies and Interactions Using Atomic Force Microscopy,” Methods, Vol. 29, No. 2, 2003, pp. 175-187. doi:10.1016/S1046-2023(02)00308-0
- Y. Chen, J. Cai, Q. Xu and Z. W. Chen, “Atomic Force Bio-Analytics of Polymerization and Aggregation of Phycoerythrin-Conjugated Immunoglobulin G Molecules,” Molecular Immunology, Vol. 41, No. 12, 2004, pp. 1247- 1252. doi:10.1016/j.molimm.2004.05.012
- P. E. Marszalek, H. Li and J. M. Fernandez, “Fingerprinting Polysaccharides with Single-Molecule Atomic Force Microscopy,” Nature Biotechnology, Vol. 19, No. 3, 2001, pp. 258-262. doi:10.1038/85712
- J. Tamayo and M. Miles, “Scanning Probe Microscopy for Chromosomal Research,” Archives of Histology and Cytology, Vol. 65, No. 5, 2002, pp. 369-376. doi:10.1679/aohc.65.369
- Y. Chen, L. Shao, Z. Ali, J. Cai and Z. W. Chen, “NSOM/ QD-Based Nanoscale Immunofluorescence Imaging of Antigen-Specific T-Cell Receptor Responses during an in Vivo Clonal Vg2Vd2 T-Cell Expansion,” Blood, Vol. 111, No. 8, 2008, pp. 4220-4232. doi:10.1182/blood-2007-07-101691
- Y. Chen, J. Qin and Z. W. Chen, “Fluorescence-Topographic NSOM Directly Visualizes Peak-Valley Polarities of GM1/GM3 Rafts in Cell Membrane Fluctuations,” The Journal of Lipid Research, Vol. 49, No. 10, 2008, pp. 2268-2275. doi:10.1194/jlr.D800031-JLR200
- Y. Chen, J. Qin, J. Cai and Z. W. Chen, “Cold Induces Microand Nano-Scale Reorganization of Lipid Raft Markers at Mounds of Cell-Membrane Fluctuations,” PLoS One, Vol. 4, No. 4, 2009, p. e5386. doi:10.1371/journal.pone.0005386
- S. Bunk, “Better Microscopes Will Be Instrumental in Nanotechnology Development,” Nature, Vol. 410, No. 6824, 2001, pp. 127-129. doi:10.1038/35065204
- K. Keren, M. Krueger, R. Gilad, et al., “Sequence-Specific Molecular Lithography on Single DNA Molecules,” Science, Vol. 297, No. 5578, 2002, pp. 72-75. doi:10.1126/science.1071247
- J. K. Horber and M. J. Miles, “Scanning Probe Evolution in Biology,” Science, Vol. 302, No. 5647, 2003, pp. 1002- 1005. doi:10.1126/science.1067410
- K. L. Westra, A. W. Mitchell and D. J. Thomson, “Tip Artifacts in Atomic-Force Microscope Imaging of ThinFilm Surfaces,” Journal of Applied Physics, Vol. 74, No. 5, 1993, pp. 3608-3610. doi:10.1063/1.354498
- D. Nyyssonen, L. Landstein and E. Coombs, “2-Dimensional Atomic Force Microprobe Trench Metrology System,” Journal of Vacuum Science & Technology B, Vol. 9, No. 6, 1991, pp. 3612-3616. doi:10.1116/1.585855
- D. J. Keller and C. C. Chou, “Imaging Steep, High Structures by Scanning Force Microscopy with Electron-Beam Deposited Tips,” Surface Science, Vol. 358, No. 1-3, 1992, pp. 333-339. doi:10.1016/0039-6028(92)90973-A
- P. Grutter, W. Zimmermannedling and D. Brodbeck, “Tip Artifacts of Microfabricated Force Sensors for Atomic Force Microscopy,” Applied Physics Letters, Vol. 60, No. 22, 1992, pp. 2741-2743. doi:10.1063/1.106862
- S. N. Magonov, A. Y. Gorenberg and H. J. Cantow, “Atomic Force Microscopy on Polymers and Polymer RelatedCompounds,” Polymer Bulletin, Vol. 28, No. 5, 1992, pp. 577-584. doi:10.1007/BF00296049
- U. D. Schwarz, H. Haefke, P. Reimann and H. J. Guntherodt, “Tip Artifacts in Scanning Force Microscopy,” Journal of Microscopy, Vol. 173, No. 3, 1994, pp. 183- 197. doi:10.1111/j.1365-2818.1994.tb03441.x
- J. S. Villarrubia, “Morphological Estimation of Tip Geometry for Scanned Probe Microscopy,” Surface Science, Vol. 321, No. 3, 1994, pp. 287-300. doi:10.1016/0039-6028(94)90194-5
- J. S. Villarrubia, “Algorithms for Scanned Probe Microscope Image Simulation, Surface Reconstruction, and Tip Estimation,” Journal of Research of the National Institute of Standards and Technology, Vol. 102, No. 4, 1997, pp. 425-454. doi:10.6028/jres.102.030
- Y. Chen, J. Cai, M. Liu, et al., “Research on DoubleProbe, Doubleand Triple-Tip Effects during Atomic Force Microscopy Scanning,” Scanning, Vol. 26, No. 4, 2004, pp. 155-161. doi:10.1002/sca.4950260402
- N. C. Santos, E. Ter-Ovanesyan, J. A. Zasadzinski and M. A. Castanho, “Reconstitution of Phospholipid Bilayer by an Atomic Force Microscope Tip,” Biophysical Journal, Vol. 75, No. 4, 1998, pp. 2119-2120. doi:10.1016/S0006-3495(98)77654-4
- N. H. Thomson, B. L. Smith, N. Almqvist, et al., “Oriented, Active Escherichia coli RNA Polymerase: An Atomic Force Microscope Study,” Biophysical Journal, Vol. 76, No. 2, 1999, pp. 1024-1033. doi:10.1016/S0006-3495(99)77267-X
- F. J. Giessibl, S. Hembacher, H. Bielefeldt and J. Mannhart, “Subatomic Features on the Silicon(111)-(7 × 7) Surface Observed by Atomic Force Microscopy,” Science, Vol. 289, No. 5478, 2000, pp. 422-426. doi:10.1126/science.289.5478.422
- J. Jass, T. Tjarnhage and G. Puu, “From Liposomes to Supported, Planar Bilayer Structures on Hydrophilic and Hydrophobic Surfaces: An Atomic Force Microscopy Study,” Biophysical Journal, Vol. 79, No. 6, 2000, pp. 3153- 3163. doi:10.1016/S0006-3495(00)76549-0