World Journal of Nuclear Science and Technology
Vol.2 No.4(2012), Article ID:23795,5 pages DOI:10.4236/wjnst.2012.24026
Reduction of the Beam Hardening Artifacts in the X-Ray Computer Tomography: Energy Discrimination with a Photon-Counting Detector
1Research institute of Electronics, Shizuoka University, Hamamatsu, Japan
2Graduate School of Science and Technology, Shizuoka University, Hamamatsu, Japan
Email: *ryimura@ipc.shizuoka.ac.jp
Received August 8, 2012; revised September 10, 2012; accepted September 19, 2012
Keywords: X-Ray Computer Tomography; Artifacts; Photon Counting; Iterative Reconstruction; ART-TV; Titanium Sample; Security Applications
ABSTRACT
The material identification is a pressing requirement for the sensitive security applications. Dual-energy X-ray computer tomography (DXCT) has been investigated for material identification in the medical and security fields. It requires two tomographic images at sufficiently different energies. To discriminate dangerous materials of light elements such as plastic bombs in luggage, it is needed to measure accurately with several tens of kilo electron volts where such materials exhibit significant spectral differences. However, CT images in that energy region often include artifacts from beam hardening. To reduce these artifacts, a novel reconstruction method has been investigated. It is an extension of the Algebraic Reconstruction Technique and Total Variation (ART-TV) method that reduces the artifacts in a lower-energy CT image by referencing it to an image obtained at higher energy. The CT image of a titanium sample was reconstructed using this method in order to demonstrate the artifact reduction capability.
1. Introduction
Dual-energy X-ray computer tomography (DXCT) is a powerful material identification technique in the field of medical engineering [1-6]. In DXCT, the effective atomic number and electron density of a target object are derived from the attenuation coefficient or CT value at two different energies [7]. CT systems of this field have dual sources or the ability to rapidly switch the tube current and voltage.
DXCT is also expected to be applied to the security field. For medical use the target object is body tissue, consisting of light elements. However, these medical systems cannot be directly applied to security inspection, because the target object is composed of various elements. In addition, for space and cost reasons, medical equipment is unsuitable. The applications of DXCT technology have been applied to material discrimination in the security field [8]. An X-ray CT system using a conventional X-ray tube and a photon-counting line sensor has been developed and shown to be feasible for material discrimination [9], but one problem was the presence of artifacts due to beam hardening.
In DXCT, the effective atomic number and electron density are derived from the difference between the attenuation coefficients at different energies. Therefore, two CT images need to be obtained at a significant energy difference. In addition, the target object in the security field can include light elements such as plastic bombs. Thus, the lower X-ray energy needs to be several tens of kilo-electron volts. Depending on the thickness of the target, such low-energy X-rays may be completely absorbed and not reach the detector. In this case the attenuation is not a linear function of absorber thickness [10,11]. This nonlinear relationship induces artifacts as a beamhardening effect, evident as variations in pixel values even within the same material. An example of an image showing this artifact [12] is the CT image of a copper sample at 40 keV, for which a circular hole in it is blurred in comparison to its image at 90 keV. To identify the material accurately, it is necessary to reduce such artifacts and derive the correct attenuation coefficient from the low-energy CT images.
To reduce such artifacts, an iterative reconstruction method that uses CT images obtained at different energies was investigated. Higher energy images have fewer artifacts than those of lower energy [12]. This iterative reconstruction method uses a higher-energy CT image obtained simultaneously using polychromatic X-rays as the reference. As the basis for this method, Algebraic Reconstruction Technique and Total Variation (ART-TV) was adopted because it has been verified to be capable of overcoming data insufficiencies [13,14]. As an extension of ART-TV, we developed an improved method referred to here as ART-FG-TV, where FG stands for flatten gradient. This method utilizes a CT system that can simultaneously image an object at different X-ray energies.
Experimental projection data from a titanium sample were reconstructed with this method and evaluated in terms of artifact reduction. Although titanium is a heavier element than the atoms contained in plastics, it is selected to evaluate the effect of the ART-FG-TV because it clearly reveals artifacts from beam hardening. Also, as titanium is often included in electronic products and cameras, it is a key target material in the security field.
2. Reconstruction Method and Experiment
2.1. Reconstruction Method
The FG step is an iterative optimization process added to the ART-TV method. It flattens the gradient of a CT image by referencing the gradient of a higher-energy CT image. Following the notation of the original algorithm [14], this method can be summarized by the following four steps:
1) ART reconstruction
 (1)
(1)
2) FG step
 (2)
(2)
3) Positive constraint
 (3)
(3)
4) TV minimization
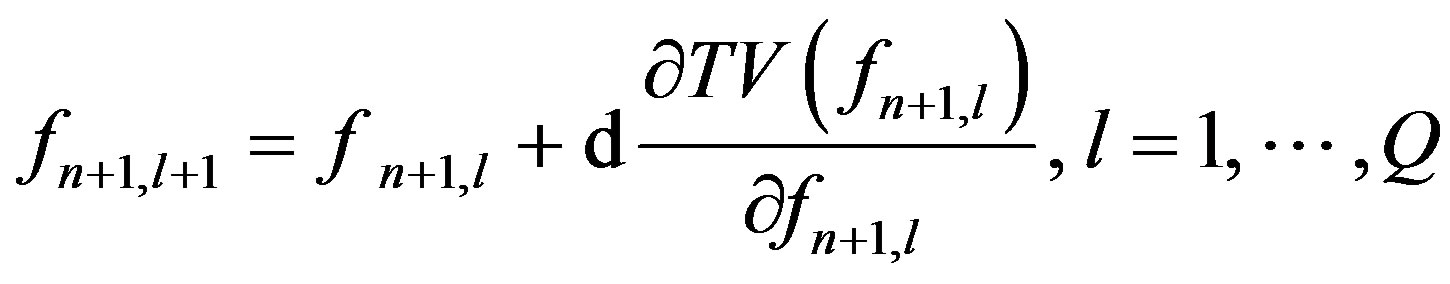 (4)
(4)
where f and g respectively denote a reconstructed image and the projection data, where H is the projection matrix. The number of projections is P, the TV iteration number is Q, and the FG iteration number is S.
In FG procedure, argument f represents a processed image vector, whereas h is the gradient vector of the higherenergy CT image, calculated by applying a Laplacian filter to the image. θ and α are, respectively, a threshold and a constant that represents the strength of this procedure, which affect the resulting image and should be chosen appropriately. R is a set of vectors of the indices of f that the X-ray path crosses, as in Figure 1.
The FG procedure is described below: the image f is traced, on a pixel by pixel basis, along the X-ray path R, and focused pixel is increased as to the strength parameter α and the difference s between that pixel and its adjacent pixels, if the gradient of the reference image at the same position is less than the threshold value θ. This iterative step modifies the values of the pixels on the image f corresponding to the positions of the flat area, or the same material area, of the reference image; the decline of CT value, or the artifact mentioned in Section 1 is thereby reduced.
2.2. Experiment
The CT images were reconstructed from the data measured using the X-ray CT system shown in Figure 2. It consists of a continuous X-ray tube (running at 150 kV and 10 μA) and a cadmium telluride (CdTe) X-ray/ gamma-ray detector (Amptek X-123CdTe). The sample is a titanium cylinder 15 mm in diameter. To avoid pileup at the detector, a 30-mm-thick aluminum plate is placed between the X-ray tube and the sample. The CdTe detector is wrapped with lead shielding to avoid scattered rays. Since the X-rays are collimated at the tube window and by the hole in the lead shield, they are assumed to constitute a pencil-shaped beam. Assigning the line connecting the X-ray tube and the detector to be 0 mm, data are measured by one second for each 1 mm from −16 to +16 mm. As the sample shape is cylinder, the measurement is done once and the data were repeated for 36 times to obtain a complete rotation. Examples of spectral data are shown in Figure 3.
The measured spectrum is divided into energy bands of 10 keV and the midpoint of each energy band is taken to define the effective energy [9]. Dual-source CT systems in the medical field often approximate the mean photon energy of the spectrum in terms of the total number of counts in the whole spectrum [1,2]. In contrast, our method counts the number of photons at the actual energy.
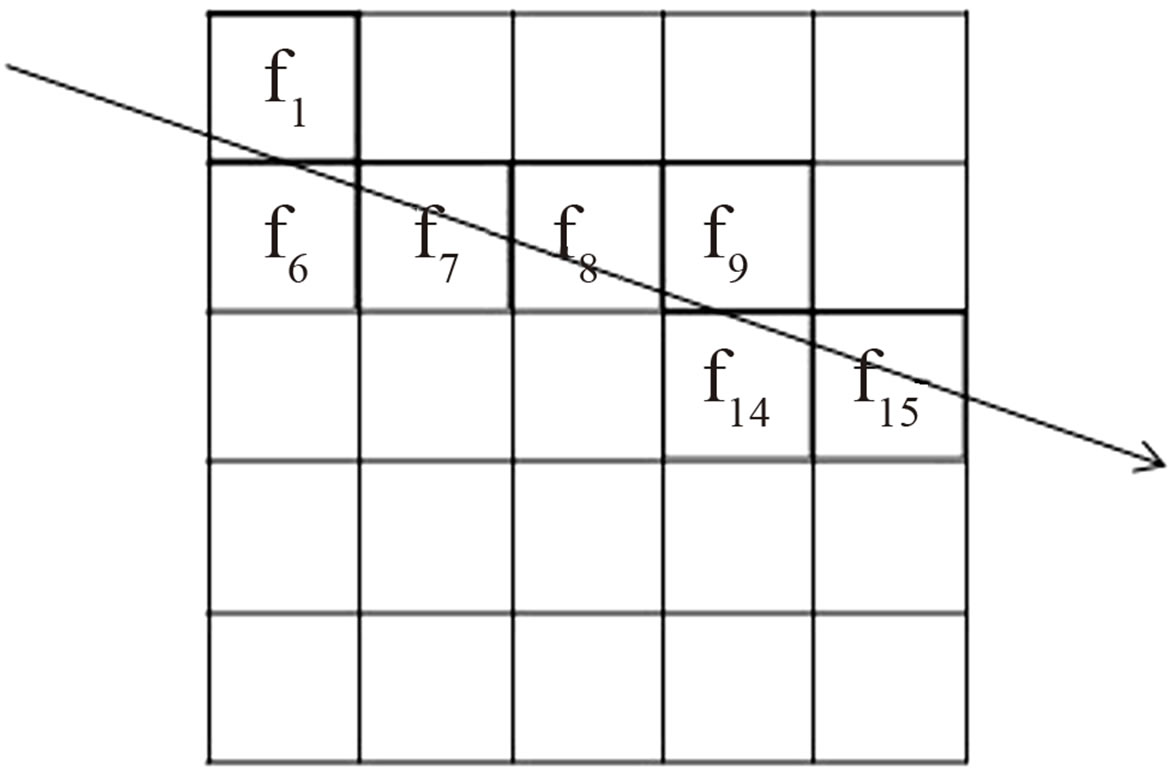
Figure 1. Example of an element r of R for the case of a 5 × 5 pixel image f. Element r is a vector that consists of pixel indices intersected by the ray passing through the image. In this example, r = {1, 6, 7, 8, 9, 14, 15}.

Figure 2. Schematic diagram of the adopted X-ray CT system. To avoid the pile-up phenomenon, a 30-mm-thick aluminum plate was placed between the X-ray tube and the sample.

Figure 3. Spectra output by the CT system. The solid line represents the spectrum measured without the sample and the dashed line represents that with the Ti sample.
3. Results and Discussion
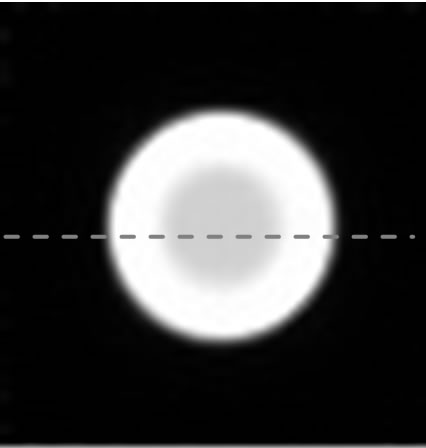
Measured CT data of the sample were reconstructed using ART-TV and ART-FG-TV at each energy band. The higher-energy image referenced in the FG procedure was also reconstructed using ART-TV. In Figure 4, the CT images of 50 keV and the reference image of 110 keV are shown; (a) is ART-TV, (b) is ART-FG-TV and (c) is the referenced image. Profiles along the centers of the images (dashed line in Figure 4) are plotted in Figure 5. Since the sample is a uniform titanium cylinder, the CT value should be uniform. Whereas the CT value obtained using ART-TV was non-uniform, it became more nearly uniform with ART-FG-TV. This improvement verifies that the method reduces artifacts.
In Figure 5, the lowest value in the ART-TV image is 0.098, and the difference between the highest and lowest values is 0.025, which is 20% of the highest value in the image. On the other hand, the lowest value in the ART-FG-TV image is 0.106, and the difference between the highest and lowest values is 0.011, which is only 9% of the largest value. Furthermore, the depression in the CT image in Figure 4, which is displayed in 256 shades of gray, is barely visible.
The ART-FG-TV image was also compared to one measured by conventional filtered back projection (FBP).
 (a) ART-TV
 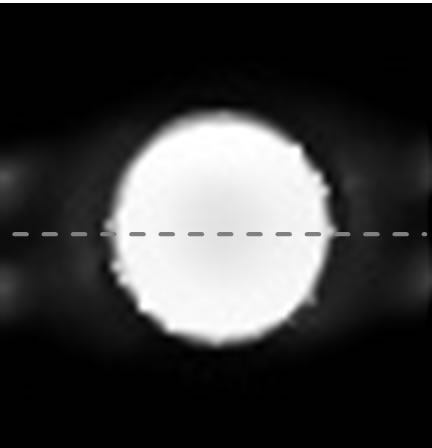 (b) ART-FG-TV
 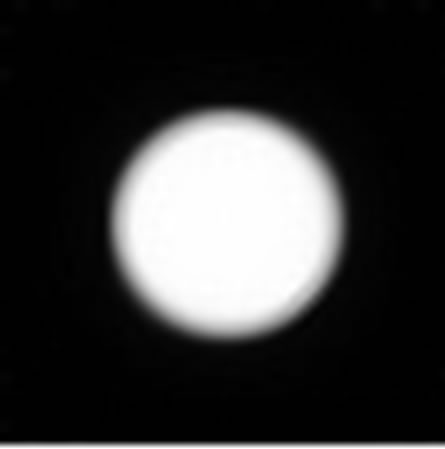 (c) Reference image
Figure 4. CT images of a 15-mm-diameter titanium cylinder using (a) ART-TV at 50 keV; (b) ART-FG-TV at 50 keV; and (c) ART-TV at 110 keV as the reference. The parameters used for ART-TV were P = 80 and Q = 100. The parameters used for the FG step were θ = 0.001, α = 0.05, and S = 50. A gray circle is evident at the middle of the image shown in (a), despite the sample being uniform titanium. By using ART-FG-TV, this artifact was reduced.
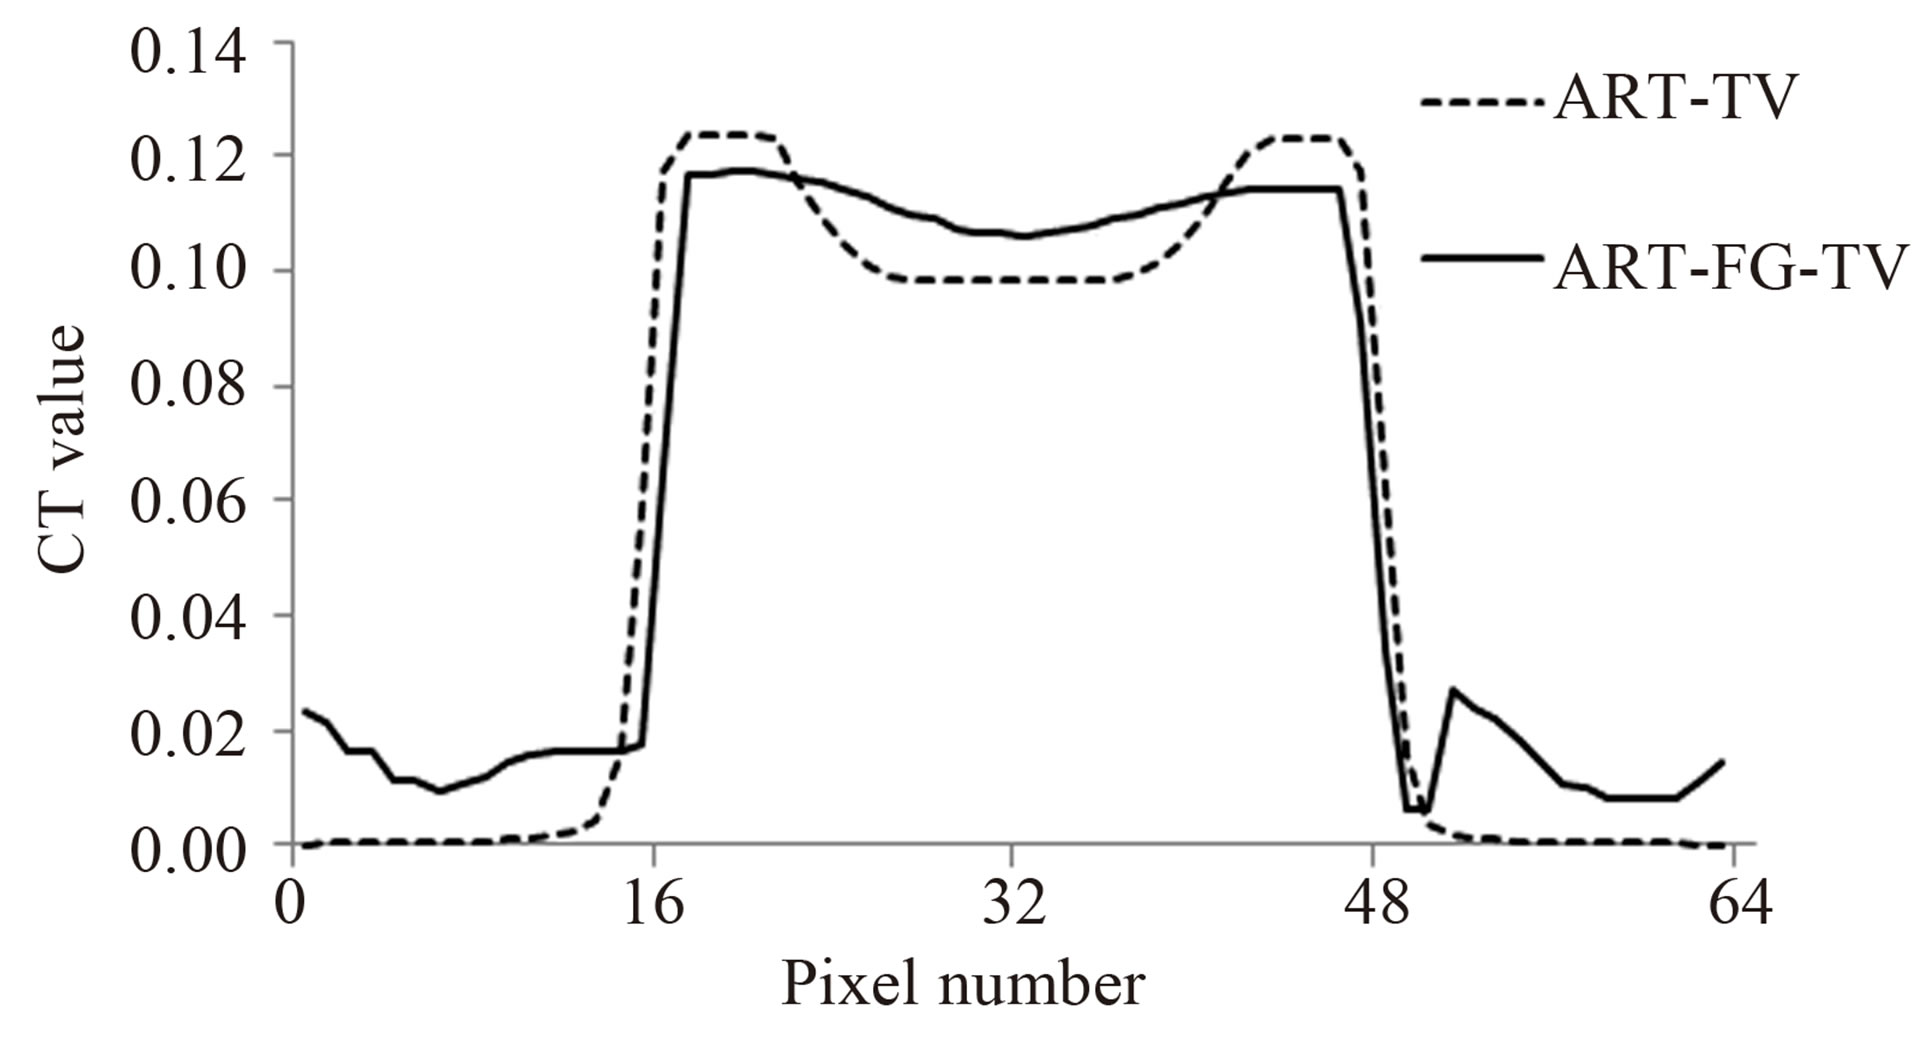
Figure 5. Profiles along the center line (dashed line in Figure 4) of CT images by ART-TV (dashed lines) and ARTFG-TV (solid line) methods.
The image in Figure 6(a) is identical to that in Figure 4(b), whereas the image in Figure 6(b) is reconstructed from the same data by FBP. The image profile along the center of each image (dashed line) is shown in Figure 6(c). The CT value by FBP is large at the edges of the cylinder but declines sharply toward the center. Meanwhile, the CT value by ART-FG-TV is fairly flat across the cylinder, demonstrating how ART-FG-TV can flatten an artifact.
The influence of α and θ on the image was investigated. The value of α was varied from 0.01 to 0.10 in steps of 0.01 and images were reconstructed. The artifacts are reduced more by using increasingly larger values of the parameter α (Figure 7). However, when α is larger than 0.05, the image does not converge. Changes in the value of the threshold θ did not noticeably affect the image of this sample.
In this method, the artifact reduction is done by referencing the higher-energy CT image. Measuring the X-ray with the photon counting detector, the data are obtained as the spectrums. As previously described, the measured spectrum is split into the energy bands of 10 keV. This is enabled by measuring the energy of each photon accurately by photon counting detector. With this accuracy of measuring the energy of photon, it is possible to evaluate the reduction of artifacts numerically.
 a) ART-FG-TV
 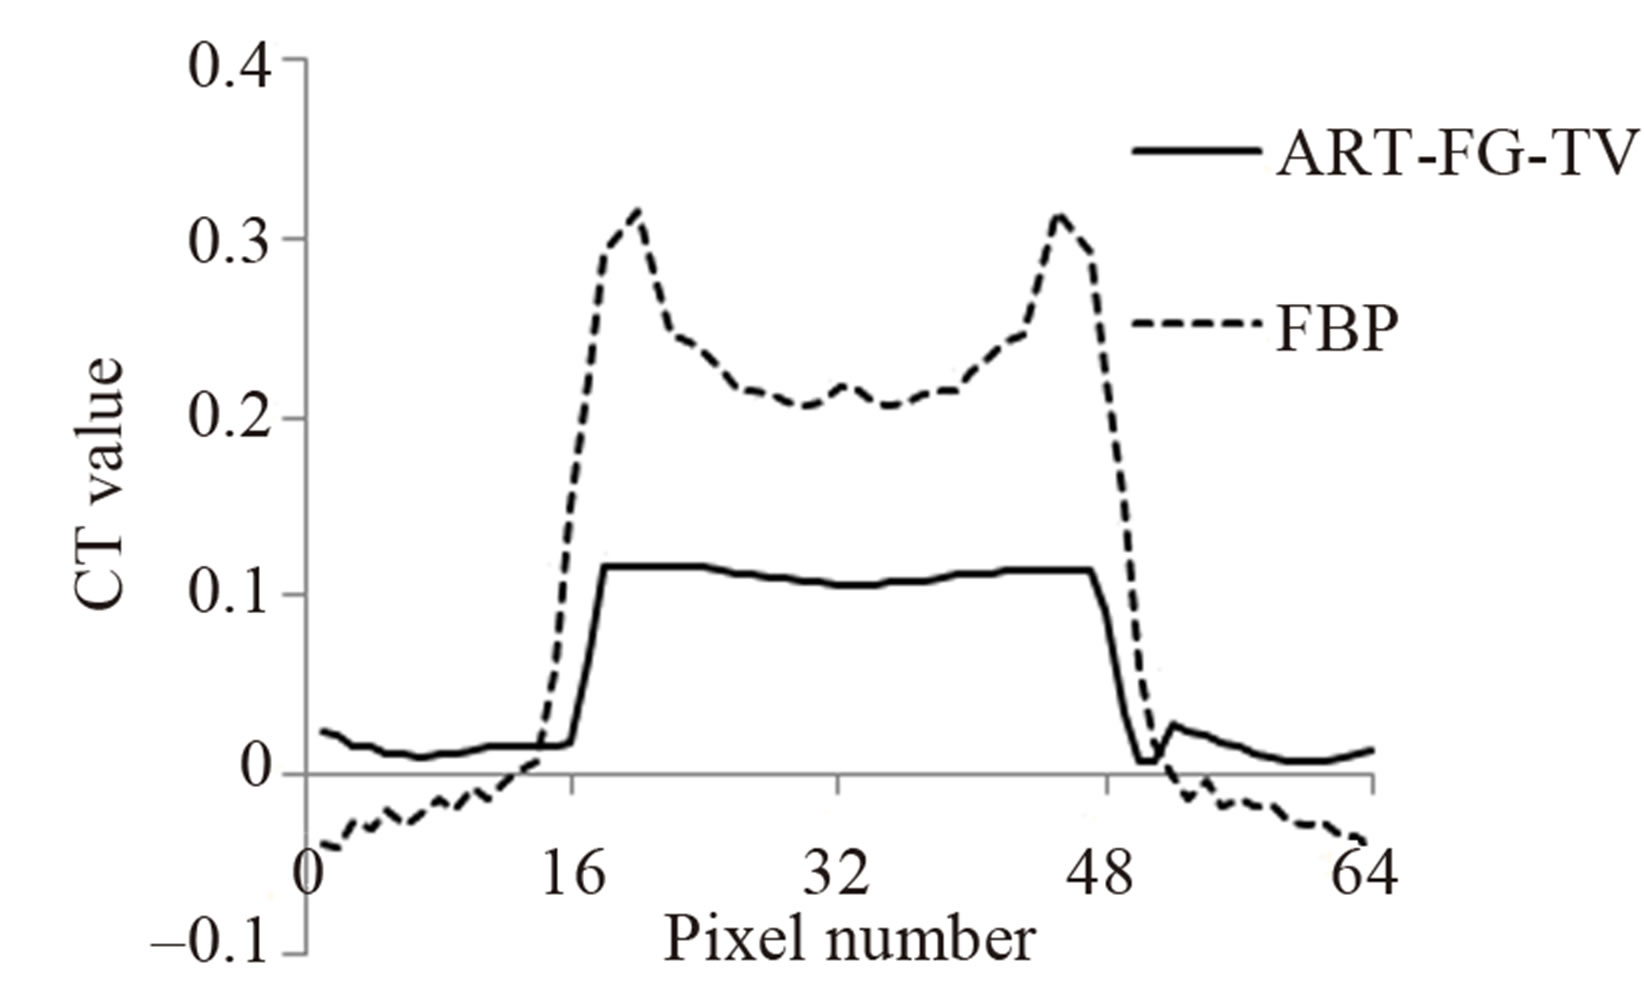 (b) FBP
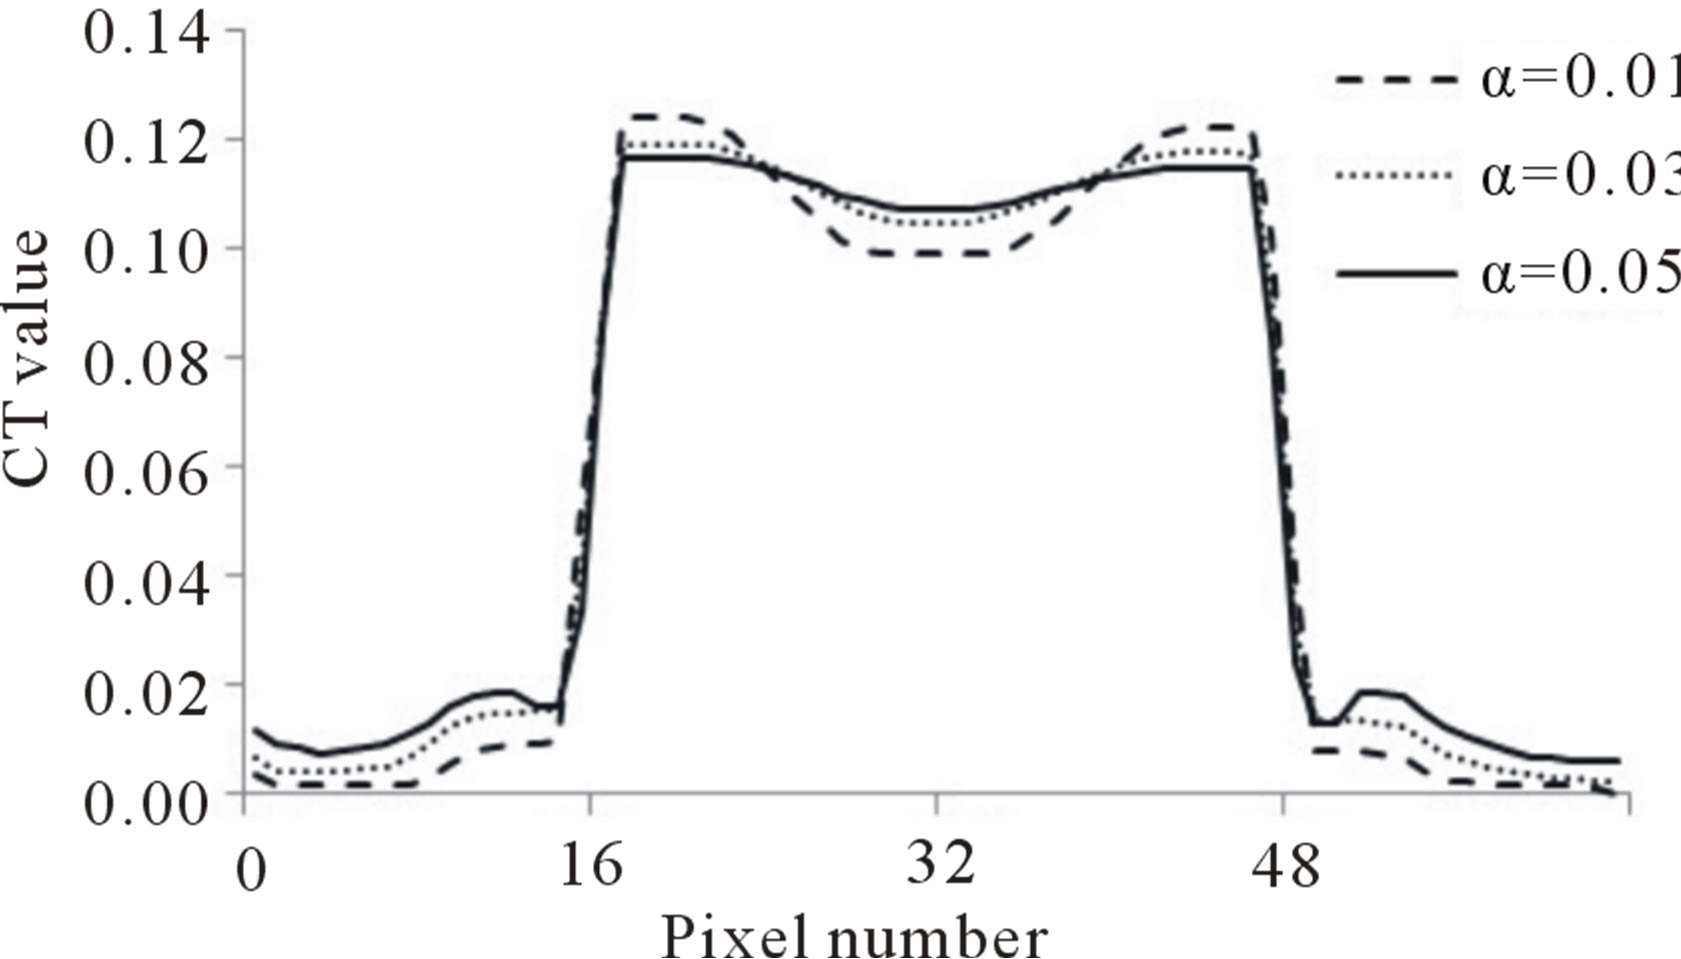
Figure 7. Image profile along the center of the images in the horizontal directions with ART-FG-TV, with varying the strength α from 0.01 to 0.05.
4. Conclusions
An ART-FG-TV algorithm is proposed as a method of reducing artifacts in CT images due to the nonlinear relationship between the attenuation and the material thickness. The method uses a high-energy CT image as a reference, and this CT image is available from arbitrary energy band of X-ray spectra. The technique relies on accurate energy measurements using a photon-counting detector.
The artifact in a CT image of a titanium sample at low energy was suppressed in CT value from 0.025 to 0.008 (20% to 7%). As a first step, it has been demonstrated that this method flattens the artifact. In the future, we will evaluate this method with samples of lighter elements. We will further evaluate the method using complex samples, and investigate the effects of the chosen parameters on the attenuation coefficient.
REFERENCES
- T. R. C. Johnson, B. Krauß, M. Sedlmair, M. Grasruck, H. Bruder, D. Morhard, C. Fink, S. Weckbach, M. Lenhard, B. Schmidt, T. Flohr, M. F. Reiser and C. R. Becker, “Material Differentiation by Dual Energy CT: Initial Experience,” European Radiology, Vol. 17, No. 6, 2007, pp. 1510-1517. doi:10.1007/s00330-006-0517-6
- R. T. Gupta, L. M. Ho, D. Marin, D. T. Boll, H. X. Barnhart and R. C. Nelson, “Dual-Energy CT for Characterization of Adrenal Nodules: Initial Experience,” American Journal of Roentgenology, Vol. 194, No. 6, 2010, pp. 1479-1483. doi:10.2214/AJR.09.3476
- A. Graser, T. R. C. Johnson, H. Chandarana and M. Macari, “Dual Energy CT: Preliminary Observations and Potential Clinical Applications in the Abdomen,” European radiology, Vol. 19, No. 1, 2009, pp. 13-23. doi:10.2214/AJR.09.3476
- K. Engelke, C. Libanati, Y. Liu, H. Wang, M. Austin, T. Fuerst, B. Stampa, W. Timm and H. K. Genant, “Quantitative Computed Tomography (QCT) of the Forearm Using General Purpose Spiral Whole-Body CT Scanners: Accuracy, Precision and Comparison with Dual-Energy X-Ray Absorptiometry (DXA),” Bone, Vol. 45, No. 1, 2009, pp. 110-118.
- G. Hides, R. Eliahou, M. Dovdevani, P. Coulon, L. Lemaitre, O. N. Gofrit, D. Pode and J. Sosna, “Determination of Renal Stone Composition with Dual-Energy CT: In Vivo Analysis and Comparison with X-Ray Diffraction,” Radiology, Vol. 257, No. 2, 2010, pp. 394-401. doi:10.1148/radiol.10100249
- B. Ruzsics, H. Lee, P. L. Zwerner, M. Gebregziabher, P. Costello and U. J. Schoepf, “Dual-Energy CT of the Heart for Diagnosing Coronary Artery Stenosis and Myocardial Ischemia-Initial Experience,” European Radiology, Vol. 18, No. 11, 2008, pp. 2414-2424. doi:10.1007/s00330-008-1022-x
- M. Torikoshi, T. Tsunoo, M. Sasaki, M. Endo, Y. Noda, Y. Ohno, T. Kohno, K. Hyodo, K. Uesugi and N. Yagi, “Electron Density Measurement with Dual-Energy X-Ray CT Using Synchrotron Radiation,” Physics in Medicine and Biology, Vol. 48, No. 5, 2003, pp. 673-685. doi:10.1088/0031-9155/48/5/308
- G. Zentai, “X-Ray Imaging for Homeland Security,” International Journal of Signal and Imaging Systems Engineering, Vol. 3, No. 1, 2010, pp. 13-20. doi:10.1504/IJSISE.2010.034628
- W. Zou, T. Nakashima, Y. Onishi, A. Koike, B. Shinomiya, H. Morii, Y. Neo, H. Mimura and T. Aoki, “Atomic Number and Electron Density Measurement Using a Conventional X-Ray Tube and a CdTe Detector,” Japanese Journal of Applied Physics, Vol. 47, No. 9, 2008, pp. 7317- 7323. doi:10.1143/JJAP.47.7317
- R. A. Brooks and G. D. Chiro, “Beam Hardening in X-Ray Reconstructive Tomography,” Physics in Medicine and Biology, Vol. 21, No. 3, 1976, pp. 390-398. doi:10.1088/0031-9155/21/3/004
- Van de Casteele, E. E. V. Casteele, D. V. Dyck, J. Sijbers and E. Raman, “An Energy-Based Beam Hardening Model in Tomography,” Physics in Medicine and Biology, Vol. 47, No. 23, 2002, pp. 4181-4190. doi:10.1088/0031-9155/47/23/305
- G. Matsumoto, Y. Imura, H. Morii, A. Miyake and T. Aoki, “Analysis of Artifact With X-Ray CT Using Energy Band by Photon Counting CdTe Detector,” Nuclear Instruments and Methods in Physics Research A, Vol. 621, No. 1-3, 2010, pp. 292-294. doi:10.1016/j.nima.2010.05.056
- E. Y. Sidky, C. Kao and X. Pan, “Accurate Image Reconstruction from Few-Views and Limited-Angle Data in Divergent-Beam CT,” Journal of X-Ray Science and Technology, Vol. 14, No. 2, 2006, pp. 119-139.
- X. Duan, J. Cheng, L. Zhang, Y. Xing, Z. Chen and Z. Zhao, “X-Ray Cargo Container Inspection System with Few-View Projection Imaging,” Nuclear Instruments and Methods in Physics Research A, Vol. 598, No. 2, 2009, pp. 439-444. doi:10.1016/j.nima.2008.08.151.
NOTES
*Corresponding author.