Journal of Analytical Sciences, Methods and Instrumentation
Vol.2 No.1(2012), Article ID:17802,6 pages DOI:10.4236/jasmi.2012.21009
Micro-Raman and SEM Analysis of Minerals from the Darhib Mine, Egypt
![]()
1Department of Chemistry, University of Antwerp, Antwerp, Belgium; 2Academy for Mineralogy, Antwerp, Belgium.
Email: {Giuliana.GattoRotondo, Larysa.Darchuk, Rene.VanGrieken}@ua.ac.be, M.Swaenen@skynet.be
Received September 19th, 2011; revised October 24th, 2011; accepted November 10th, 2011
Keywords: Minerals; Micro-Raman; SEM; Talc Mines
ABSTRACT
The Darhib mine is one of the several talc deposits in the Hamata area of southeastern Egypt. Several specimens of minerals coming from this mine were subjected to complementary investigation by micro-Raman spectrometry and scanning electron microscopy. The difficulty in their identification is the appearance of most of them: they are all very small and only visible under the mineral binocular microscope (×10 - ×40). They appear as small crystals in fissures and holes and a visual determination on colour and crystal gives only a guess of what kind of mineral it could be. Therefore, only after analyzing them by micro-Raman and scanning electron microscopy it was possible to identify their structure and they can be divided in three main groups: one is quite generic and several minerals of different species were identified, such as quartz, talc, mottramite and chrysocolla, very common in the talc mine (these ones are Si-based minerals); the other one is constituted by four samples which are Zn and/or Cu rich, which means minerals of the rosasite or aurichalcite groups; the last group is constituted by two samples containing mainly Pb.
1. Introduction
The Darhib talc mine, located in the Southern Eastern Desert (N24.00.680, E035.00.134, Height 593 m), is one of the largest talc deposits in Egypt together with the El Atshan and Atshan mines (Figure 1).
The rocks of such an area were probably subjected to metamorphisms so that serpentine, talc, tremolite and chlorite replaced the carbonates. Small lenses of sulphide consisting of pyrite, sphalerite, chalcopyrite, pyrrhotite and galena within the talc ore bodies may represent sulphide segregation in the original sediments before the metamorphism. Moreover, not far from the Darhib mine, at about 100 km, there is the Umm Samiuki deposit which is Zn and Cu rich, so that the sulphide may be enriched with such elements.
The objects of study are twelve minerals collected by a group of scientists from the Academy for Mineralogy, Antwerp, Belgium, in the Darhib mine.
The investigation performed by scanning electron microscopy (SEM) provides a way of visualising samples with excellent spatial resolution and a large depth of field. It reveals detailed information about the sample morphology that is not apparent when using optical microscopy. Although most SEMs are routinely fitted with energy-dispersive X-ray detection (EDX) equipment, and whilst this has proven to be a very valuable technique, it yields only elemental information, making the analysis of complex heterogeneous compounds particularly challenging. On the other hand, micro-Raman spectrometry (MRS) provides chemical, physical and structural information about the materials analyzed, even if the visual resolution is much poorer than in SEM/EDX. The combination of these two different techniques may result in unambiguous chemical and structural characterization of a wide range of samples at the micrometre level.
2. Materials and Methods
2.1. Samples
Several stones of about 1 - 2 cm2 were collected in the mine and carried to the laboratory. The most interesting crystals were chosen by using a binocular microscope with zoom system from 10× to 40×. The pictures of some samples are shown in Figure 2. They were removed with a sharp stainless needle and glued on a microscopic glass by a double side tape. A normal micromountsize crystal in the collection is ca. 0.5 - 1 mm.
The twelve samples were collected with this procedure and they are listed in Table 1. The crystals’ colours were identified by the Raman light microscope and they have different gradations of white, green and yellow. They were analyzed firstly by MRS and then covered by an
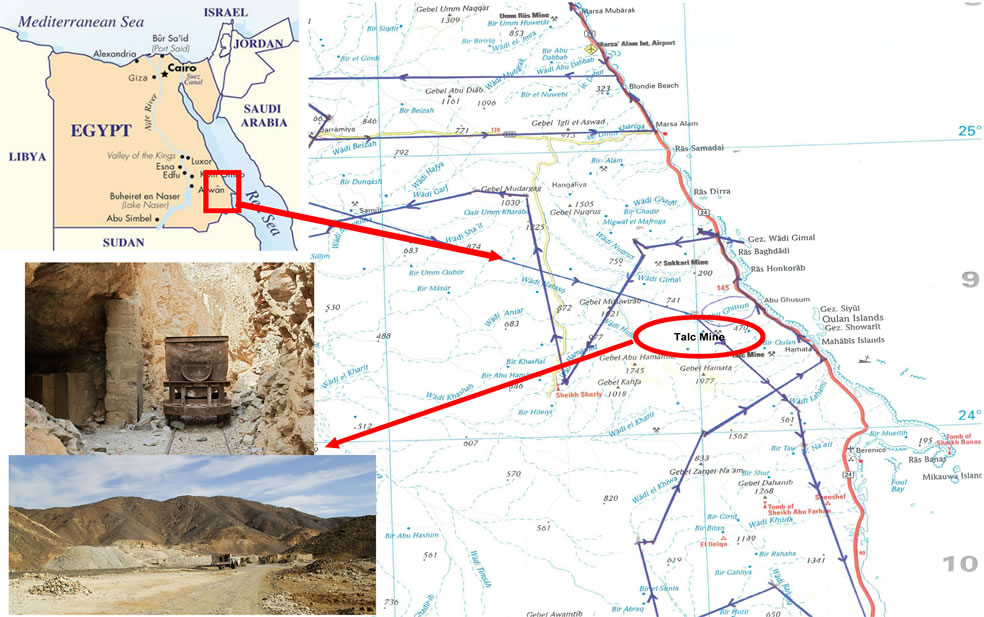
Figure 1. Map of Egypt and location of the Darhib mine.
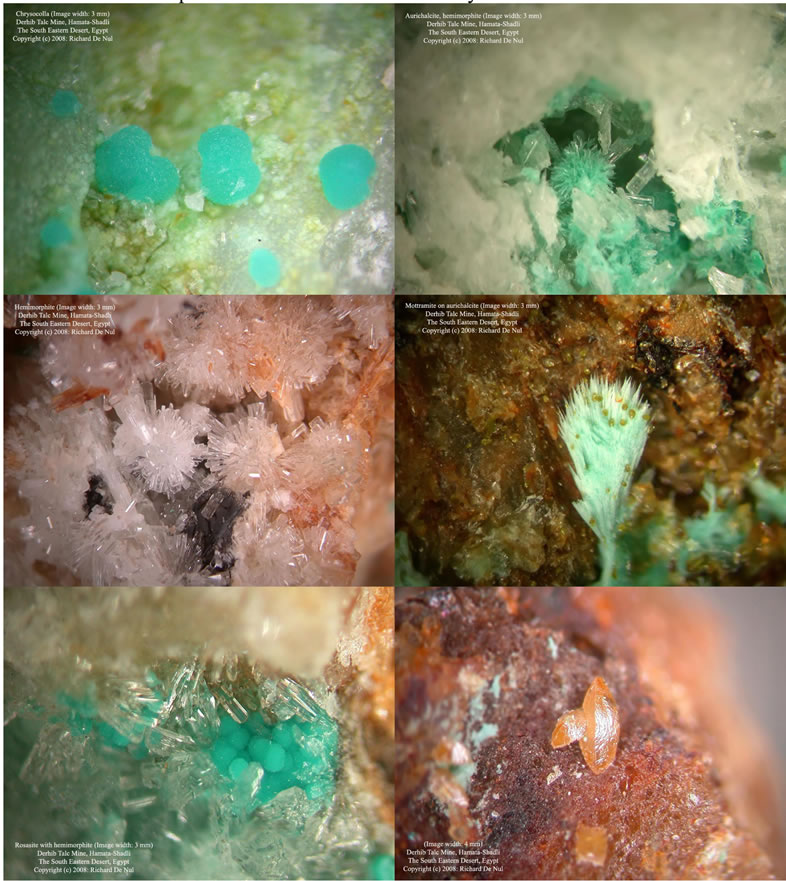
Figure 2. Pictures of chrysocolla, aurichalcite, hemimorfite, mottramite on aurichalcite, rosasite and wulfenite, respectively. Many thanks to Richard De Nul for the pictures.
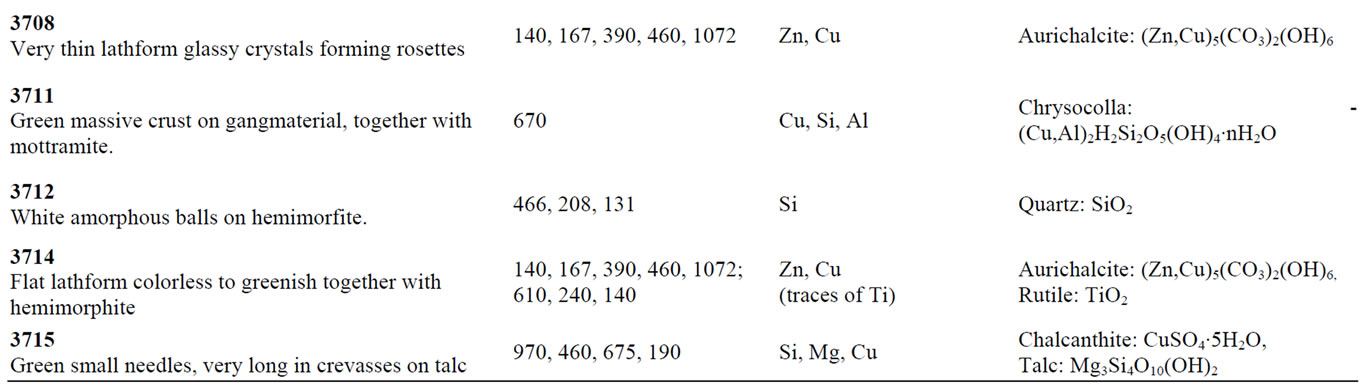

Table 1. The summary of the analyzed samples.
amorphous carbon coat to make them conductive enough to be analyzed by SEM.
About 10 - 15 points per sample were manually chosen for MRS and SEM analysis to have as much information as possible of the whole area of the crystals.
2.2. Raman Spectrometry
The samples were measured by a Renishaw InVia micro-Raman spectrometer (Renishaw, Wotton-under-Edge, UK) coupled with a Peltier cooled CCD detector. Excitation was provided by both 514.5 and 785 nm lasers in the range between 100 and 3200 cm–1 with a spectral resolution of 2 cm–1. Calibration was done by using the 520.5 cm–1 line of a silicon wafer. The acquisition time for each scan varied from 10 to 20 s; the number of accumulations varied from 1 to 5 and then they were summed in order to provide a better signal-to-noise ratio. Spectra were obtained by using 100× or 50× magnification objectives. Data acquisition was carried out with the WireTM and Spectracalc software packages from Renishaw (Renishaw,Wotton-under-Edge, UK) and GRAMS (Galactic Industries, Salem, NH, USA), respectively. Spectral analyses were performed by comparison with spectra from commercially available spectral library and literature spectra.
2.3. SEM
The identification of elements present in the minerals was carried out by using a computer controlled SEM/EDX (JEOL JSM 6300, Tokyo, Japan), coupled with a Si(Li) X-ray detector PGT (Princeton Gamma Tech, Princeton, NJ, USA) and equipped with a backscattered electron detector (BSE) and a secondary electron detector (SE), and super atmospheric thin window (I = 1 nA, tungsten filament). For most of the specimens a tension of 10 kV was applied. To check the presence of Mo (detected in Raman spectra) in the samples 3520 and 3705, a voltage of 30 kV was used in order to see the K line of Mo at 17.4 KeV and the lines Lα, Lβ1, Lβ2, Lγ1 of Pb. Such a procedure was necessary because, with 10 kV, the lines Lα Lβ1 of Mo overlap with the M of Pb around 2.3 KeV, so that it is not possible to be sure of Mo’s presence. Reference elemental intensities acquired from pure compounds (standards) are commonly used for calibrating SEM/EDX systems.
3. Results and Discussion
As mentioned before, the specimens are quite different from each other and this shows a very heterogeneous background of the collection area.
In Table 1, the summary of the analyzed samples is presented.
In the sample 3518 (Figure 3), we can see the bands typical of herbertsmithite or kapellasite, which is the metastable polymorph of herbertsmithite. As reported in Table 1, from the elemental analysis by SEM, Cu, Cl and Zn were found, but also traces of Mg which could show the presence of small quantities of haydeeite, i.e. the Mg analogue of kapellasite Cu3Mg(OH)6Cl2, mineral discovered in the Haydee copper mine [1] and also belonging to the group of atacamite [2]. There are no spectra of haydeeite in the rruff database [3].
Samples 3692 and 3715 (Figure 4) contain Cu, Mg, S, Ca and Si and they are composed mainly by two different crystals: the principal one in both samples is chalcanthite (CuSO4∙5H2O), whose main bands are detected at 975 and 460 cm–1, and the other one is talc whose bands are at 670 and 196 cm–1. Moreover, in sample 3692 we observe spectra where several additional bands are visible, corresponding to small crystals present into the main mineral as intrusion. The peak at 1125 cm–1 could correspond to huntite mineral [4], while the ones at 595 and 910 cm–1, appearing only in one spectrum, could correspond to the colourless mineral akermanite, belonging to the melilite group [5].
Samples 3696, 3711 and 3712 are very easily identifyable [3] respectively as mottramite, chrysocolla and quartz as shown in Figure 5 and in Table 1.
As mentioned, there are four samples (3524, 3702, 3708 and 3714) belonging to the group of Znand Cu-rich.
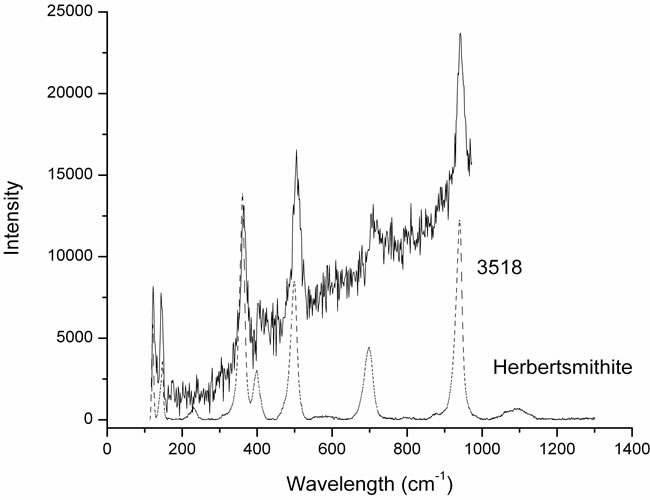
Figure 3. The mineral constituting sample 3518 is herbertsmithite and the color is light green.
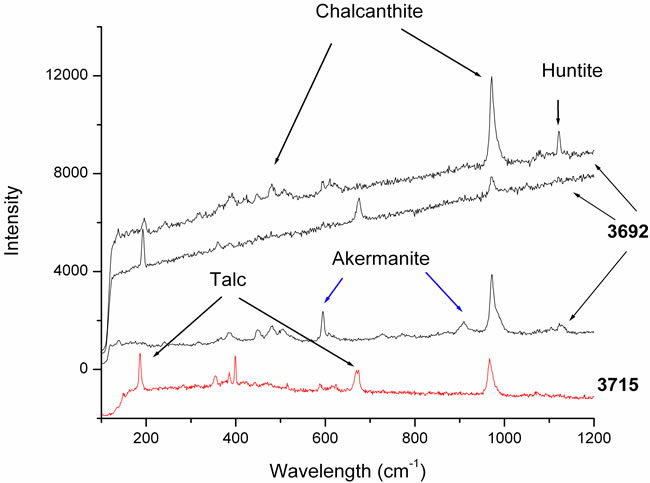
Figure 4. The lowest curve corresponds to the sample 3715 constituted by chalcanthite and talc. The other three upper curves are three spectra corresponding to different areas of sample 3692: bands of akermanite and huntite are visible, together with the chalcanthite and balc ones.
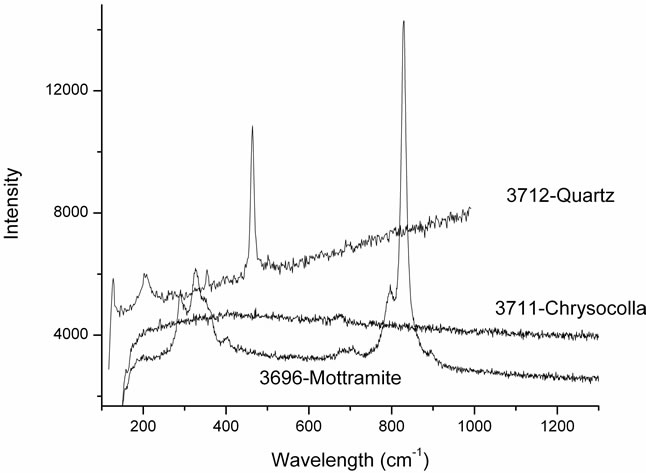
Figure 5. The spectra of the three samples show that those crystals are pure minerals of quartz, chrysocolla and mottramite.
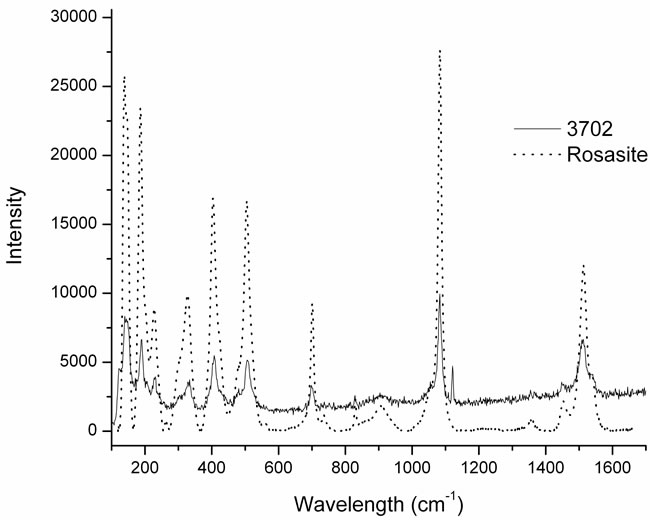
In particular the sample 3702 (Figure 6(a)) belongs to the rosasite group, while the other three samples (3524, 3708 and 3714) in Figure 6(b) belong to the aurichalcite group. In both groups we can observe the band at 1073 cm–1; that is the (CO3)2– symmetric stretching mode, typical of the carbonate block [6,7]. The bands at 140 and 167 cm–1 are assigned to the CuO and ZnO bending vibrations.
The specimens 3702 and 3708 are pure crystals respectively of rosasite and aurichalcite. On the contrary, the results of elemental composition for samples 3714 and 3524 indicate that Zn and Cu are the main components of the minerals, but traces of Ti were also detected. This is confirmed by the Raman analysis where we can see both the bands of aurichalcite and, at 610 cm–1, the main band of rutile.
 (a)
(a)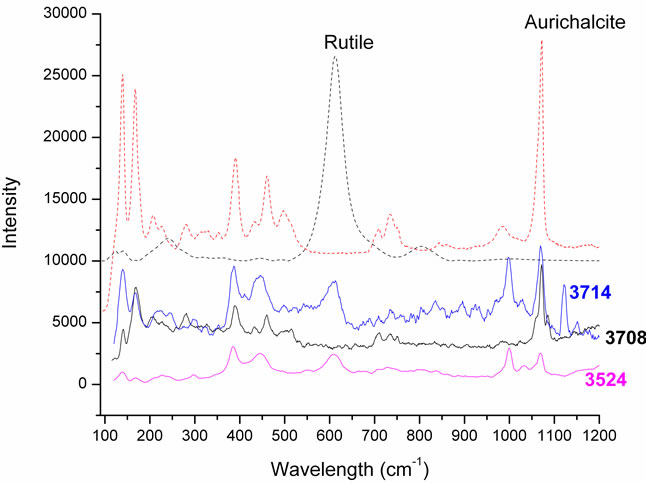 (b)
(b)
Figure 6. (a) The Raman spectra of sample 3702 and the standard of rosasite; (b) The spectra of the three crystals of the aurichalcite group with intrusions of rutile in samples 3714 and 3524 and, in dots, the standards of aurichalcite and rutile.
The other two analyzed samples (3520 and 3705) contain mainly Pb and Mo, but also traces of other elements as shown in Table 1. The Raman spectra in Figure 7 show very clear bands at 165, 313, 763, 866 cm–1 common to both samples, associable to wulfenite. In sample 3705 we see also bands at 1282, 1335, 1489, 1694 cm–1; both sets of peaks cannot berefered to any mineral because they are not available in the Raman database. From some representative literature [8,9], it seems that the medium band at 1694 cm−1 corresponds to ν(C=O) conjugated cyclic ketone group. The band at 1489 cm–1 was observed for moolooite [10,11] which is a Cu(II) oxalate found as a degradation product from the decay of malachite. The band at 1282 cm–1 cannot be identified because it could correspond to several groups, for example a stretching of NO2 [12] or to the stretching vibration
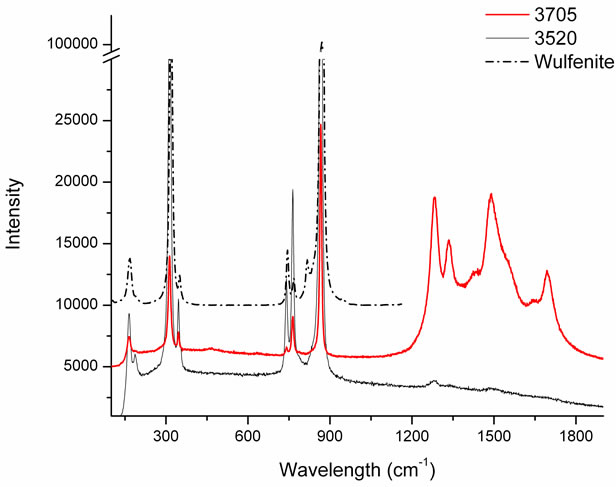
Figure 7. Sample 3520 is pure wulfenite, while sample 3705 is wulfenite plus some other mineral not identified containing traces of Ca, Cu, Si.
ν(C-OH) [13], or still to δ(CCH), ν(CC) [14]. The association with moolooite (Cu(C2O4)·0.5(H2O)) can explain the presence of Cu, but in conclusion these two samples remain not identified.
4. Conclusions
This mine is very special because of its primary minerals, combined with talc. This gives locally arise of several secondary minerals from copper, lead and zinc which are never mentioned before in technical reports of this mine. The final determination of these crystals was only possible by the use of sophisticated techniques.
Micro-Raman spectroscopy and SEM/EDX were used to identify the structure and the chemical composition of some of the minerals collected in the Darhib mine. Most of them were successfully recognized and, in particular, thanks to the transparent nature of some minerals, it was possible to detect several intrusions in the sample. Some very rare minerals were determined by Raman (Herbertsmithite, Huntite). One of the twelve specimens was partially identified because it was not possible to find the corresponding spectra in the commercial available Raman databases. In this mining area there is the possibility of the existence of new minerals. An attempt to analyze them by X-ray diffraction could be an option in order to identify it.
REFERENCES
- J. Schlüter and T. Malcherek, “Haydeeite, Cu3Mg(OH)6Cl2, a New Mineral from the Haydee Mine, Salar Grande, Atacama Desert, Chile,” Neues Jahrbuch für Mineralogie—Abhandlungen, Vol. 184, No. 1, 2007, pp. 39-43.
- R. H. Coleman, A. Sinclair and A. S. Wills, “Comparisons between Haydeeite, α-Cu3Mg(OD)6Cl2, and Kapellasite, α-Cu3Zn(OD)6Cl2, Isostructural S=1/2 Kagome Magnets,” Chemistry of Materials, Vol. 22, No. 20, 2010, pp. 5774-5779.
- http://rruff.inf
- B. E. Heetz and W. B. White, “Vibrational Spectra of the Alkaline Earth Double Carbonates,” American Mineralogist, Vol. 62, 1977, pp. 36-50.
- C. Fredericci, E. D. Zanotto and E. C. Ziemath, “Crystallization Mechanism and Properties of a Blast Furnace Slag Glass,” Journal of Non-Crystalline Solids, Vol. 273, No. 1-3, 2000, pp. 64-75. doi:10.1016/S0022-3093(00)00145-9
- R. L. Frost, “A Raman Spectroscopic Study of Selected Minerals of the Rosasite Group,” Journal of Raman Spectroscopy, Vol. 37, No. 9, 2006, pp. 910-921. doi:10.1002/jrs.1521
- R. L. Frost et al., “Aurichalcite—An SEM and Raman Spectroscopic Study,” Polyhedron, Vol. 26, No. 13, 2007, pp. 3291-3300. doi:10.1016/j.poly.2007.03.003
- R. L. Frost, A. J. Locke and W. N. Martens, “Synthesis and Raman Spectroscopic Characterisation of the Oxalate Mineral Wheatleyite Na2Cu2+(C2O4)2·2H2O,” Journal of Raman Spectroscopy, Vol. 39, No. 7, 2008, pp. 901-908. doi:10.1002/jrs.1932
- G. Jovanovski and O. Grupce, “Vibrational Study and Spectra-Structure Correlations in Mercury(II) Chlorasaccharinate,” Bulletin of the Chemists and Technologists of Macedonia, Vol. 21, No. 2, 2002, pp. 117-124.
- K. Osterrothova and J. Jehlicka, “Raman Spectroscopic Identification of Usnic Acid in Hydrothermal Minerals as a Potential Martian Analogue,” Spectrochimica Acta Part A, Vol. 73, No. 3, 2009, pp. 576-580. doi:10.1016/j.saa.2008.09.005
- H. G. M. Edwards, D. W. Farwell, R. Jenkins and M. R. D. Seaward, “Vibrational Raman Spectroscopic Studies of Calcium Oxalate Monohydrate and Dihydrate in Lichen Encrustations on Renaissance Frescoes,” Journal of Raman Spectroscopy, Vol. 23, No. 3, 1992, pp. 185-189. doi:10.1002/jrs.1250230310
- B. J. Short and J. C. Carter, “Ultraviolet Resonant Raman, Enhancements in the Detection of Explosives,” Lawrence Livermore National Laboratory Report LLNL-TH-413751, 2009.
- B. N. Mavrin, M. V. Koldaeva, R. M. Zakalukin and T. N. Turskaya, “Fourier-Raman Spectra of Alkali Metal and Thallium Hydrogen Phthalate Single Crystals,” 2005. http://arxiv.org/ftp/cond-mat/papers/0504/0504521.pdf
- V. L. Furer, I. I. Vandyukovab, A. E. Vandyukov, S. Fuchs, J. P. Majoral, A. M. Caminade and V. I. Kovalenko, “DFT Calculations of Structure and Vibrational Spectra of Dendron Built of Cyclotriphosphazene Core with Terminal Carbamate and Ester Groups,” Vibrational Spectroscopy, Vol. 54, No. 1, 2010, pp. 21-29. doi:10.1016/j.vibspec.2010.05.003