 American Journal of Analytical Chemistry, 2011, 2, 857-862 doi:10.4236/ajac.2011.28098 Published Online December 2011 (http://www.SciRP.org/journal/ajac) Copyright © 2011 SciRes. AJAC Determination of Compositions in Cosmetics by Multiple-Instrument Changming Zhang1*, Shaoqing Guo2, Changgen Huang1 1State Key Laboratory of Coal Conversion, Institute of Coal Chemistry, Chinese Academy of Sciences, Taiyuan, China 2Taiyuan University of Science and Technology, Taiyuan, China E-mail: zhangcm@sxicc.ac.cn Received January 21, 2011; revised April 12, 2011; accepted April 23, 2011 Abstract An analysis method based on multi-instruments analysis technique coupled solvent extraction to determine compositions of unknown cosmetic were established. The multi-instruments involve high-performance liquid chromatography (HPLC), X-ray diffraction (XRD) and Fourier transform infrared (FTIR). The cosmetic sample was separated and enriched into 4 fractions by the solvent extraction. The compounds were defined as mercuric ammonium chloride, liquid paraffin, etc. Keywords: Cosmetic, Analysis, Multi-Instruments, HPLC, FTIR 1. Introduction In modern life, there is more and more emphasis on pro- tecting and beautifying facial skin, especially for young women, and more and more types of cosmetic products could be found in cosmetics market. However, it is nec- essary to point out that some cosmetics used for a long -time may lead to damage of human health due to the presence of certain harmful substances. For example, there are a lot of reports about harmful substances being prohibited or restricted in cosmetics. They could be de- tected through instruments analysis, including carcino- gens-N-nitroso-diethanolamine [1], formaldehyde [2], preservatives [3] hormone [4], antibiotics [5], phenolies [6] and so on. Many methods to detect specific components [1, 2-6] and heavy metals of cosmetics were reported in lots of literature. For example electrochemical detector detec- tion (EC) [8], cold vapor atomic absorption spectrometry (CVAAS) [8,9], atomic emission spectroscopy (AES) [10], and inductively coupled plasma mass spectrometry (ICP-MS) [11,12], and so on. There are also some re- ports using capillary electrophoresis (CE) combining with inductively coupled plasma mass spectrometry (CE- ICPMS) [13,14] and capillary electrophoresis combining with UV-Vis detection for heavy metals speciation [15,16]. These methods have high sensitivity and low selectivity for detection of heavy metals; at the same time, most of these methods were used to determine the total amount of metal rather than the metal form. Majidi [13] and Gudzenko [15] reported the determination of methyl mercury and ethyl mercury, and Evans reported the determination of three forms of mercury including 3 CH , 25 CH and 613 CH [7]. In addition, there is no report about determination of the heavy metal form and simultaneous detection of multi-components in cosmet- ics. In literature [7-14], there is no report about determina- tion of the heavy metal form and this method established can analyze the form and content of heavy metal of cos- metic. Many methods were only used to detect a single com- ponent of cosmetic [1-6], and was not useful to defect many compounds. So the successful enrichment is to ensure instrument analysis. The enrichment principle of components is mainly based on the different solubility of components in solvents. If this component of sample has same group of solvent, then it may be easier to be dissolve and concentrate than the components. For example, when water was used as extraction reagent, the solubility alcohols were much higher than other no-coating OH- compounds, and then this fraction were mainly alcohol compounds. The present analysis methods and the treatment of samples have some characteristics; this has not been re- ported and will be a reference for related analysis. 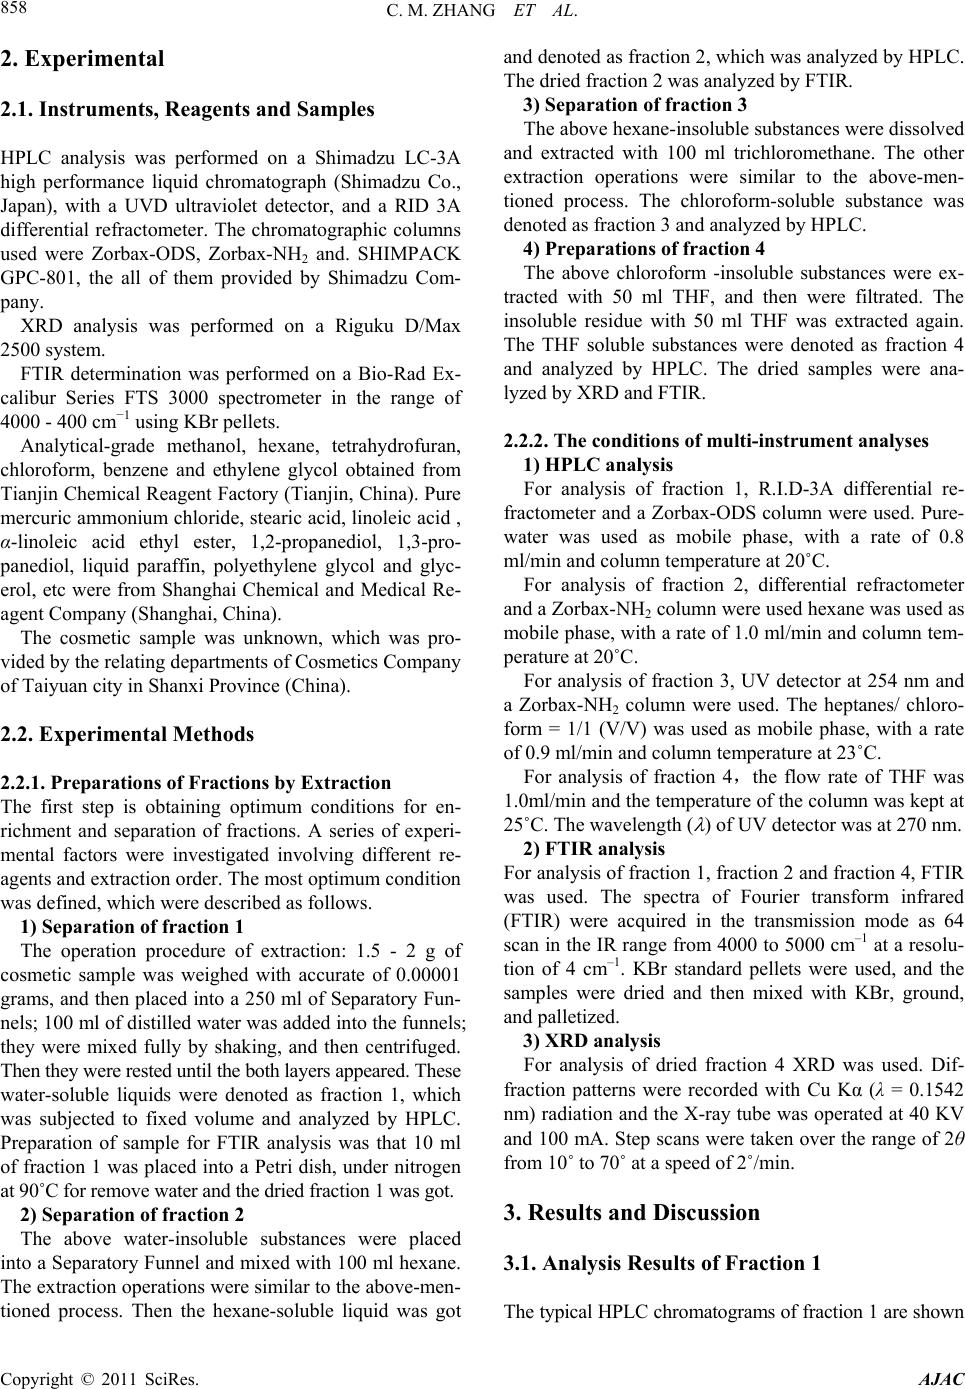 C. M. ZHANG ET AL. 858 2. Experimental 2.1. Instruments, Reagents and Samples HPLC analysis was performed on a Shimadzu LC-3A high performance liquid chromatograph (Shimadzu Co., Japan), with a UVD ultraviolet detector, and a RID 3A differential refractometer. The chromatographic columns used were Zorbax-ODS, Zorbax-NH2 and. SHIMPACK GPC-801, the all of them provided by Shimadzu Com- pany. XRD analysis was performed on a Riguku D/Max 2500 system. FTIR determination was performed on a Bio-Rad Ex- calibur Series FTS 3000 spectrometer in the range of 4000 - 400 cm−1 using KBr pellets. Analytical-grade methanol, hexane, tetrahydrofuran, chloroform, benzene and ethylene glycol obtained from Tianjin Chemical Reagent Factory (Tianjin, China). Pure mercuric ammonium chloride, stearic acid, linoleic acid , α-linoleic acid ethyl ester, 1,2-propanediol, 1,3-pro- panediol, liquid paraffin, polyethylene glycol and glyc- erol, etc were from Shanghai Chemical and Medical Re- agent Company (Shanghai, China). The cosmetic sample was unknown, which was pro- vided by the relating departments of Cosmetics Company of Taiyuan city in Shanxi Province (China). 2.2. Experimental Methods 2.2.1. Preparations of Fractions by Extraction The first step is obtaining optimum conditions for en- richment and separation of fractions. A series of experi- mental factors were investigated involving different re- agents and extraction order. The most optimum condition was defined, which were described as follows. 1) Separation of fraction 1 The operation procedure of extraction: 1.5 - 2 g of cosmetic sample was weighed with accurate of 0.00001 grams, and then placed into a 250 ml of Separatory Fun- nels; 100 ml of distilled water was added into the funnels; they were mixed fully by shaking, and then centrifuged. Then they were rested until the both layers appeared. These water-soluble liquids were denoted as fraction 1, which was subjected to fixed volume and analyzed by HPLC. Preparation of sample for FTIR analysis was that 10 ml of fraction 1 was placed into a Petri dish, under nitrogen at 90˚C for remove water and the dried fraction 1 was got. 2) Separation of fraction 2 The above water-insoluble substances were placed into a Separatory Funnel and mixed with 100 ml hexane. The extraction operations were similar to the above-men- tioned process. Then the hexane-soluble liquid was got and denoted as fraction 2, which was analyzed by HPLC. The dried fraction 2 was analyzed by FTIR. 3) Separation of fraction 3 The above hexane-insoluble substances were dissolved and extracted with 100 ml trichloromethane. The other extraction operations were similar to the above-men- tioned process. The chloroform-soluble substance was denoted as fraction 3 and analyzed by HPLC. 4) Preparations of fraction 4 The above chloroform -insoluble substances were ex- tracted with 50 ml THF, and then were filtrated. The insoluble residue with 50 ml THF was extracted again. The THF soluble substances were denoted as fraction 4 and analyzed by HPLC. The dried samples were ana- lyzed by XRD and FTIR. 2.2.2. The conditions of multi-instrument analyses 1) HPLC analysis For analysis of fraction 1, R.I.D-3A differential re- fractometer and a Zorbax-ODS column were used. Pure- water was used as mobile phase, with a rate of 0.8 ml/min and column temperature at 20˚C. For analysis of fraction 2, differential refractometer and a Zorbax-NH2 column were used hexane was used as mobile phase, with a rate of 1.0 ml/min and column tem- perature at 20˚C. For analysis of fraction 3, UV detector at 254 nm and a Zorbax-NH2 column were used. The heptanes/ chloro- form = 1/1 (V/V) was used as mobile phase, with a rate of 0.9 ml/min and column temperature at 23˚C. For analysis of fraction 4,the flow rate of THF was 1.0ml/min and the temperature of the column was kept at 25˚C. The wavelength ( ) of UV detector was at 270 nm. 2) FTIR analysis For analysis of fraction 1, fraction 2 and fraction 4, FTIR was used. The spectra of Fourier transform infrared (FTIR) were acquired in the transmission mode as 64 scan in the IR range from 4000 to 5000 cm–1 at a resolu- tion of 4 cm–1. KBr standard pellets were used, and the samples were dried and then mixed with KBr, ground, and palletized. 3) XRD analysis For analysis of dried fraction 4 XRD was used. Dif- fraction patterns were recorded with Cu Kα (λ = 0.1542 nm) radiation and the X-ray tube was operated at 40 KV and 100 mA. Step scans were taken over the range of 2θ from 10˚ to 70˚ at a speed of 2˚/min. 3. Results and Discussion 3.1. Analysis Results of Fraction 1 The typical HPLC chromatograms of fraction 1 are shown Copyright © 2011 SciRes. AJAC 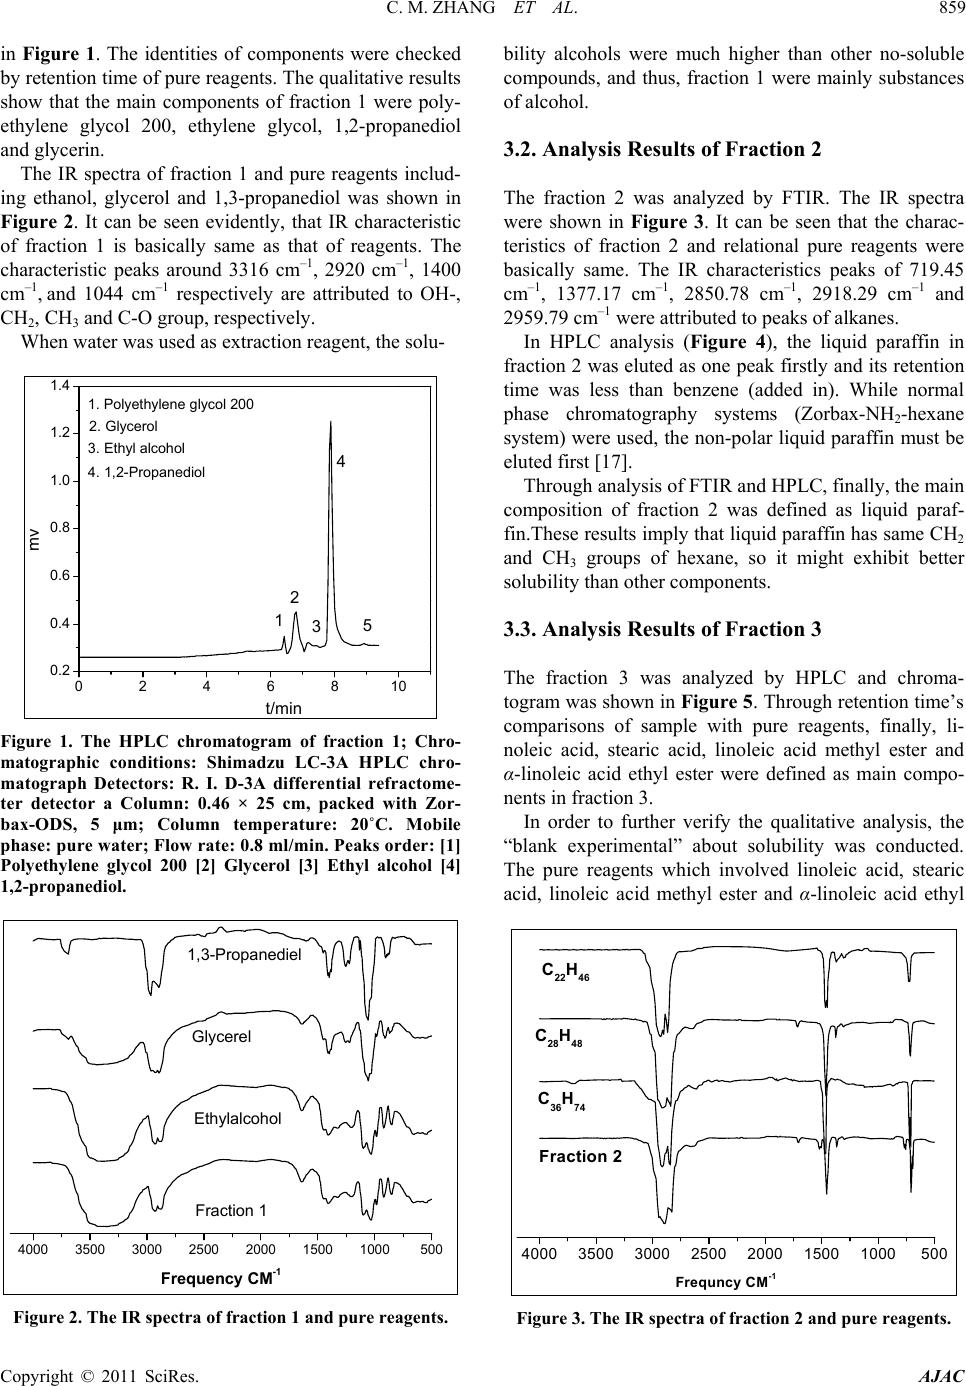 C. M. ZHANG ET AL.859 in Figure 1. The identities of components were checked by retention time of pure reagents. The qualitative results show that the main components of fraction 1 were poly- ethylene glycol 200, ethylene glycol, 1,2-propanediol and glycerin. The IR spectra of fraction 1 and pure reagents includ- ing ethanol, glycerol and 1,3-propanediol was shown in Figure 2. It can be seen evidently, that IR characteristic of fraction 1 is basically same as that of reagents. The characteristic peaks around 3316 cm–1, 2920 cm–1, 1400 cm–1, and 1044 cm–1 respectively are attributed to OH-, CH2, CH3 and C-O group, respectively. When water was used as extraction reagent, the solu- 0246810 0.2 0.4 0.6 0.8 1.0 1.2 1.4 4. 1,2-Propaned iol 3. Ethyl alc ohol 2. Glycerol 1. Polyethylen e glycol 200 5 4 3 2 1 mv t/min Figure 1. The HPLC chromatogram of fraction 1; Chro- matographic conditions: Shimadzu LC-3A HPLC chro- matograph Detectors: R. I. D-3A differential refractome- ter detector a Column: 0.46 × 25 cm, packed with Zor- bax-ODS, 5 μm; Column temperature: 20˚C. Mobile phase: pure water; Flow rate: 0.8 ml/min. Peaks order: [1] Polyethylene glycol 200 [2] Glycerol [3] Ethyl alcohol [4] 1,2-propanediol. 4000 3500 3000 2500 2000 1500 1000500 1,3-Propanediel Glycerel Ethylalcohol Fraction 1 Frequency CM-1 Figure 2. The IR spectra of fraction 1 and pure reagents. bility alcohols were much higher than other no-soluble compounds, and thus, fraction 1 were mainly substances of alcohol. 3.2. Analysis Results of Fraction 2 The fraction 2 was analyzed by FTIR. The IR spectra were shown in Figure 3. It can be seen that the charac- teristics of fraction 2 and relational pure reagents were basically same. The IR characteristics peaks of 719.45 cm–1, 1377.17 cm–1, 2850.78 cm–1, 2918.29 cm–1 and 2959.79 cm–1 were attributed to peaks of alkanes. In HPLC analysis (Figure 4), the liquid paraffin in fraction 2 was eluted as one peak firstly and its retention time was less than benzene (added in). While normal phase chromatography systems (Zorbax-NH2-hexane system) were used, the non-polar liquid paraffin must be eluted first [17]. Through analysis of FTIR and HPLC, finally, the main composition of fraction 2 was defined as liquid paraf- fin.These results imply that liquid paraffin has same CH2 and CH3 groups of hexane, so it might exhibit better solubility than other components. 3.3. Analysis Results of Fraction 3 The fraction 3 was analyzed by HPLC and chroma- togram was shown in Figure 5. Through retention time’s comparisons of sample with pure reagents, finally, li- noleic acid, stearic acid, linoleic acid methyl ester and α-linoleic acid ethyl ester were defined as main compo- nents in fraction 3. In order to further verify the qualitative analysis, the “blank experimental” about solubility was conducted. The pure reagents which involved linoleic acid, stearic acid, linoleic acid methyl ester and α-linoleic acid ethyl 4000 3500 3000 2500 2000 1500 1000500 C22H46 C28H48 C36H74 Fraction 2 Frequncy CM-1 Figure 3. The IR spectra of fraction 2 and pure reagents. Copyright © 2011 SciRes. AJAC 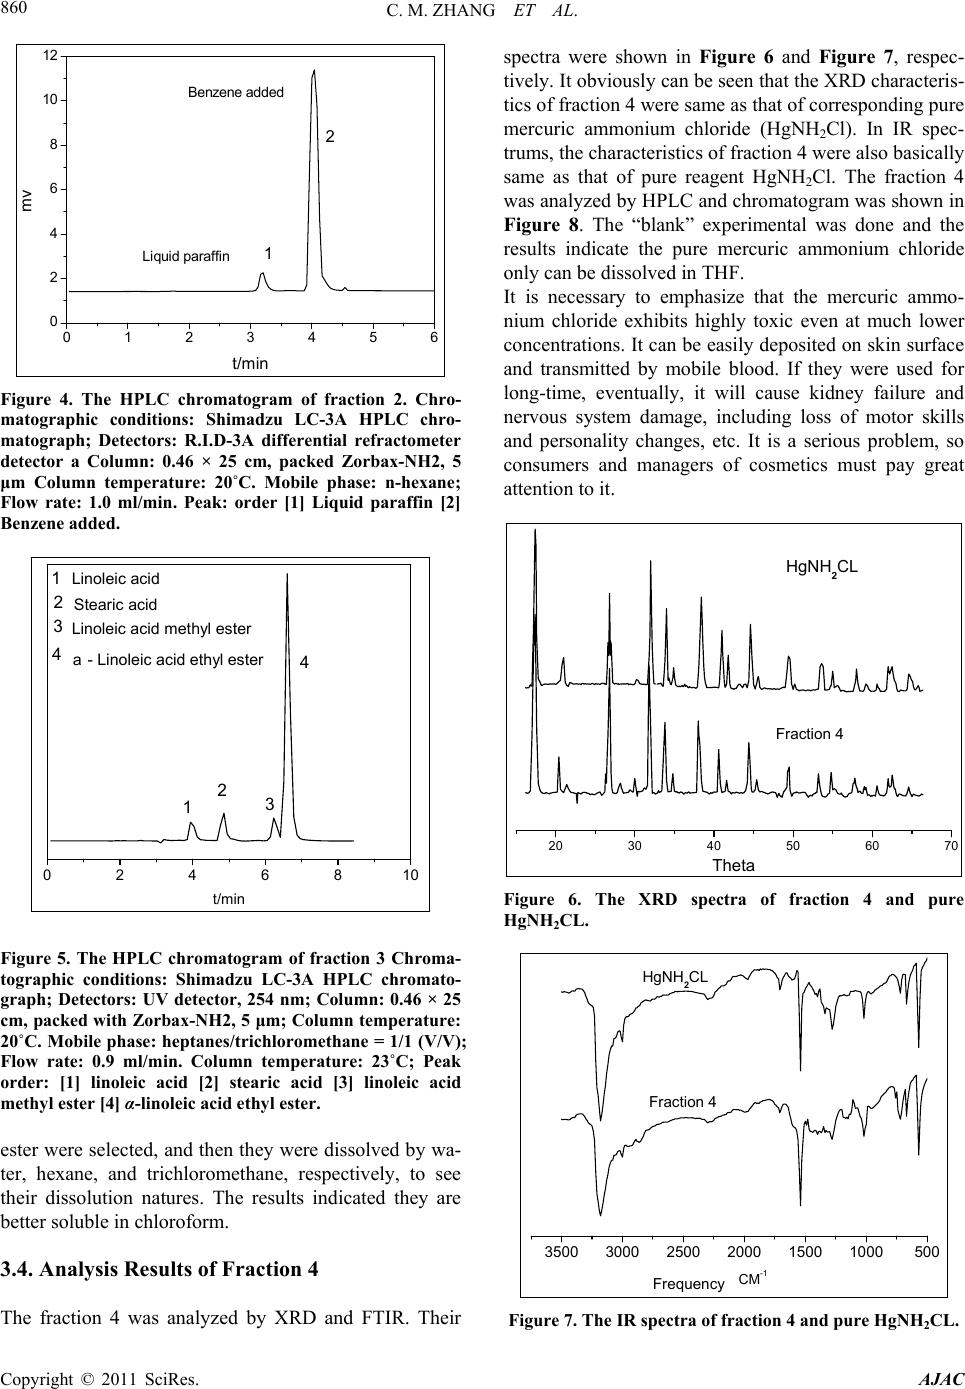 C. M. ZHANG ET AL. 860 0123456 0 2 4 6 8 10 12 Benzene added Liquid paraffin 2 1 mv t/min Figure 4. The HPLC chromatogram of fraction 2. Chro- matographic conditions: Shimadzu LC-3A HPLC chro- matograph; Detectors: R.I.D-3A differential refractometer detector a Column: 0.46 × 25 cm, packed Zorbax-NH2, 5 μm Column temperature: 20˚C. Mobile phase: n-hexane; Flow rate: 1.0 ml/min. Peak: order [1] Liquid paraffin [2] Benzene added. 0246810 3 2 1 a- Linoleic acid ethyl ester 4 2 1 Linoleic acid methyl ester Stearic acid Linoleic acid 4 3 t/min Figure 5. The HPLC chromatogram of fraction 3 Chroma- tographic conditions: Shimadzu LC-3A HPLC chromato- graph; Detectors: UV detector, 254 nm; Column: 0.46 × 25 cm, packed with Zorbax-NH2, 5 μm; Column temperature: 20˚C. Mobile phase: heptanes/trichloromethane = 1/1 (V/V); Flow rate: 0.9 ml/min. Column temperature: 23˚C; Peak order: [1] linoleic acid [2] stearic acid [3] linoleic acid methyl ester [4] α-linoleic acid ethyl ester. ester were selected, and then they were dissolved by wa- ter, hexane, and trichloromethane, respectively, to see their dissolution natures. The results indicated they are better soluble in chloroform. 3.4. Analysis Results of Fraction 4 The fraction 4 was analyzed by XRD and FTIR. Their spectra were shown in Figure 6 and Figure 7, respec- tively. It obviously can be seen that the XRD characteris- tics of fraction 4 were same as that of corresponding pure mercuric ammonium chloride (HgNH2Cl). In IR spec- trums, the characteristics of fraction 4 were also basically same as that of pure reagent HgNH2Cl. The fraction 4 was analyzed by HPLC and chromatogram was shown in Figure 8. The “blank” experimental was done and the results indicate the pure mercuric ammonium chloride only can be dissolved in THF. It is necessary to emphasize that the mercuric ammo- nium chloride exhibits highly toxic even at much lower concentrations. It can be easily deposited on skin surface and transmitted by mobile blood. If they were used for long-time, eventually, it will cause kidney failure and nervous system damage, including loss of motor skills and personality changes, etc. It is a serious problem, so consumers and managers of cosmetics must pay great attention to it. 20 30 40 50 60 70 Fraction 4 HgNH2CL Theta Figure 6. The XRD spectra of fraction 4 and pure HgNH2CL. 3500 3000 2500 2000 1500 1000500 Fraction 4 HgNH2CL CM-1 Frequency Figure 7. The IR spectra of fraction 4 and pure HgNH2CL. Copyright © 2011 SciRes. AJAC 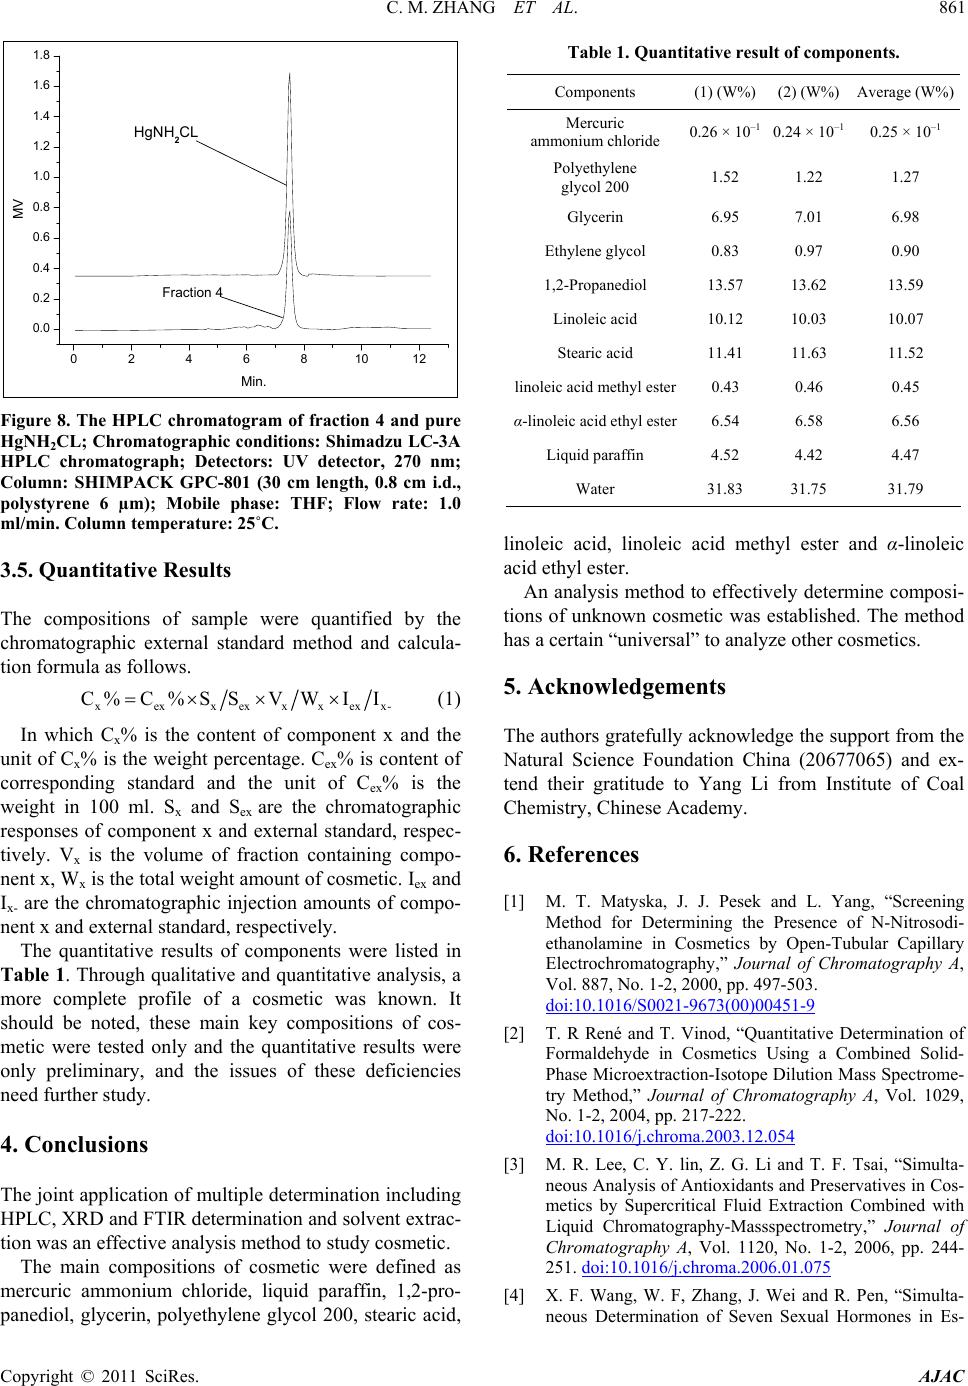 C. M. ZHANG ET AL.861 024681012 0.0 0.2 0.4 0.6 0.8 1.0 1.2 1.4 1.6 1.8 Fraction 4 HgNH2CL MV Min. Figure 8. The HPLC chromatogram of fraction 4 and pure HgNH2CL; Chromatographic conditions: Shimadzu LC-3A HPLC chromatograph; Detectors: UV detector, 270 nm; Column: SHIMPACK GPC-801 (30 cm length, 0.8 cm i.d., polystyrene 6 µm); Mobile phase: THF; Flow rate: 1.0 ml/min. Column temperature: 25˚C. 3.5. Quantitative Results The compositions of sample were quantified by the chromatographic external standard method and calcula- tion formula as follows. xexxexxxex C%C %SSVWII x- (1) In which Cx% is the content of component x and the unit of Cx% is the weight percentage. Cex% is content of corresponding standard and the unit of Cex% is the weight in 100 ml. Sx and Sex are the chromatographic responses of component x and external standard, respec- tively. Vx is the volume of fraction containing compo- nent x, Wx is the total weight amount of cosmetic. Iex and Ix- are the chromatographic injection amounts of compo- nent x and external standard, respectively. The quantitative results of components were listed in Table 1. Through qualitative and quantitative analysis, a more complete profile of a cosmetic was known. It should be noted, these main key compositions of cos- metic were tested only and the quantitative results were only preliminary, and the issues of these deficiencies need further study. 4. Conclusions The joint application of multiple determination including HPLC, XRD and FTIR determination and solvent extrac- tion was an effective analysis method to study cosmetic. The main compositions of cosmetic were defined as mercuric ammonium chloride, liquid paraffin, 1,2-pro- panediol, glycerin, polyethylene glycol 200, stearic acid, Table 1. Quantitative result of components. Components (1) (W%) (2) (W%) Average (W%) Mercuric ammonium chloride 0.26 × 10⁻¹ 0.24 × 10⁻¹ 0.25 × 10⁻¹ Polyethylene glycol 200 1.52 1.22 1.27 Glycerin 6.95 7.01 6.98 Ethylene glycol 0.83 0.97 0.90 1,2-Propanediol 13.57 13.62 13.59 Linoleic acid 10.12 10.03 10.07 Stearic acid 11.41 11.63 11.52 linoleic acid methyl ester0.43 0.46 0.45 α-linoleic acid ethyl ester6.54 6.58 6.56 Liquid paraffin 4.52 4.42 4.47 Water 31.83 31.75 31.79 linoleic acid, linoleic acid methyl ester and α-linoleic acid ethyl ester. An analysis method to effectively determine composi- tions of unknown cosmetic was established. The method has a certain “universal” to analyze other cosmetics. 5. Acknowledgements The authors gratefully acknowledge the support from the Natural Science Foundation China (20677065) and ex- tend their gratitude to Yang Li from Institute of Coal Chemistry, Chinese Academy. 6. References [1] M. T. Matyska, J. J. Pesek and L. Yang, “Screening Method for Determining the Presence of N-Nitrosodi- ethanolamine in Cosmetics by Open-Tubular Capillary Electrochromatography,” Journal of Chromatography A, Vol. 887, No. 1-2, 2000, pp. 497-503. doi:10.1016/S0021-9673(00)00451-9 [2] T. R René and T. Vinod, “Quantitative Determination of Formaldehyde in Cosmetics Using a Combined Solid- Phase Microextraction-Isotope Dilution Mass Spectrome- try Method,” Journal of Chromatography A, Vol. 1029, No. 1-2, 2004, pp. 217-222. doi:10.1016/j.chroma.2003.12.054 [3] M. R. Lee, C. Y. lin, Z. G. Li and T. F. Tsai, “Simulta- neous Analysis of Antioxidants and Preservatives in Cos- metics by Supercritical Fluid Extraction Combined with Liquid Chromatography-Massspectrometry,” Journal of Chromatography A, Vol. 1120, No. 1-2, 2006, pp. 244- 251. doi:10.1016/j.chroma.2006.01.075 [4] X. F. Wang, W. F, Zhang, J. Wei and R. Pen, “Simulta- neous Determination of Seven Sexual Hormones in Es- Copyright © 2011 SciRes. AJAC  C. M. ZHANG ET AL. Copyright © 2011 SciRes. AJAC 862 sential Oil by Performance Liquid Chromatography with Diode and Fluorescence Detectors,” Chinese Journal of Chromatography, Vol. 27, No. 3, 2009, pp. 328-332. [5] Q. Zhang, C. Wang, X. Wang, T. Wu and Q. Ma, “De- termination of Common Antibiotics and Metronidazole in Cosmetics by Ultra Performance Liquid Chromatogra- phy-Tandem Mass Spectrometry,” Chinese Journal of Chromatography, Vol. 27, No. 5, 2009, pp. 237- 239. [6] M. Padilla, M. Palma and C. G. Barroso, “Determination of Phenolics in Cosmetic Creams and Similar Emul- sions,” Journal of Chromatography A, Vol. 1091, No. 1-2, 2005, pp. 83-88. [7] O. Evans and G. D. McKee, “Determination of Mercury (L1) and Organ Mercury Compounds by Reversed-Phase Liquid Chromatography with Reductive Electrochemical Detection,” Analyst, Vol. 113, 1988, pp. 243-246. doi:10.1039/an9881300243 [8] M. Fujita and E. Takabatake, “Continuous Flow Reduc- ing Vessel in Determination of Mercuric Compounds by Liquid Chromatography/Cold Vapor Atomic Absorption Spectrometry,” Analatical Chemistry, Vol. 55, 1983, pp. 454-457. doi:10.1021/ac00254a011 [9] S. E Birnie, “Automated Continuous Monitoring of Inor- ganic and Total Mercury in Wastewater and Other Waters by Flow-Injection Analysis and Cold-Vapor Atomic Ab- sorption Spectrometry,” Journal of Automatic Chemistry, Vol. 10, No. 3, 1988, pp. 140-143. doi:10.1155/S1463924688000264 [10] J. M. F. Costa-Fernandez and L. R. A. Pereiro-Garcia, “Direct Coupling of High-Performance Liquid Chroma- tography to Microwave-Induced Plasma Atomic Emis- sion Spectrometry via Volatile-Species Generation and Its Application to Mercury and Arsenic Speciation,” Journal of Analytical Atomic Spectrometry, Vol. 10, 1995, pp. 1019-1025. doi:10.1039/ja9951001019 [11] N. Lewen, S. Mathew, M. Schenkenberger and T. Rag- lione, “A Rapid ICP-MS Screen for Heavy Metals in Pharmaceutical Compounds,” Journal of Pharmaceutical and Biomedical Analysis, Vol. 35, No. 4, 2004, pp. 739- 752. doi:10.1016/j.jpba.2004.02.023 [12] B. Passariello, M. Barbaro, S. Quaresima and A. Cas- ciello and A. Marabini, “A Determination of Mercury by Inductively Coupled Plasma-Mass Spectrometry,” Mi- crochemical Journal,Vol. 54, No. 4, 1996, pp. 348-354. doi:10.1006/mchj.1996.0110 [13] V. Majidi and N. J. MillerIhlib, “Two Simple Interface Designs for Capillary Electrophoresis-Inductively Cou- pled Plasma Mass Spectrometry,” Analyst, Vol. 123, 1998, pp. 803-808. doi:10.1039/a707770j [14] T. H. Lee and S. J. Jiang, “Determination of Mer- cury Compounds by Capillary Electrophoresis Inductively Coupled Plasma Mass Spectrometry with Microconcen- tric Nebulization,” Analytica Chimica Acta, Vol. 413, No. 1-2, 2000, pp. 197-205. doi:10.1016/S0003-2670(00)00807-2 [15] L. V. Gudzenko, R. P. Pantaler and A. B. Blank, “Deter- mination of Arsenic with Michler’s Thioketone,” Journal of Analytical Chemistry, Vol. 56, No. 8, 2001, pp. 721-723. doi:10.1023/A:1016729525970 [16] E. P. C. Lai, W. Zhang, X. Trier, A. Georgi, S. Kowalski, S. Kennedy, T. M. Muslim and E. Dabek-Zlotorzynska, “Speciation of Mercury at ng/ml Concentration Levels by Capillary Electrophoresis with Amperometric Detection,” Analytica Chimica Acta, Vol. 364, No. 1-3, 1998, pp. 63-74. doi:10.1016/S0003-2670(98)00147-0 [17] C. M. Zhang, A. Y. Li,Y. Li and L. M. Zhang, “Instru- mental Analysis and Systematic Investigation of Heavy Oils from Coal I. Analysis of Hydrocarbon Class Com- position,” Chinese Journal of Chromatography, Vol. 17, No. 4, 1999, pp. 372-375.
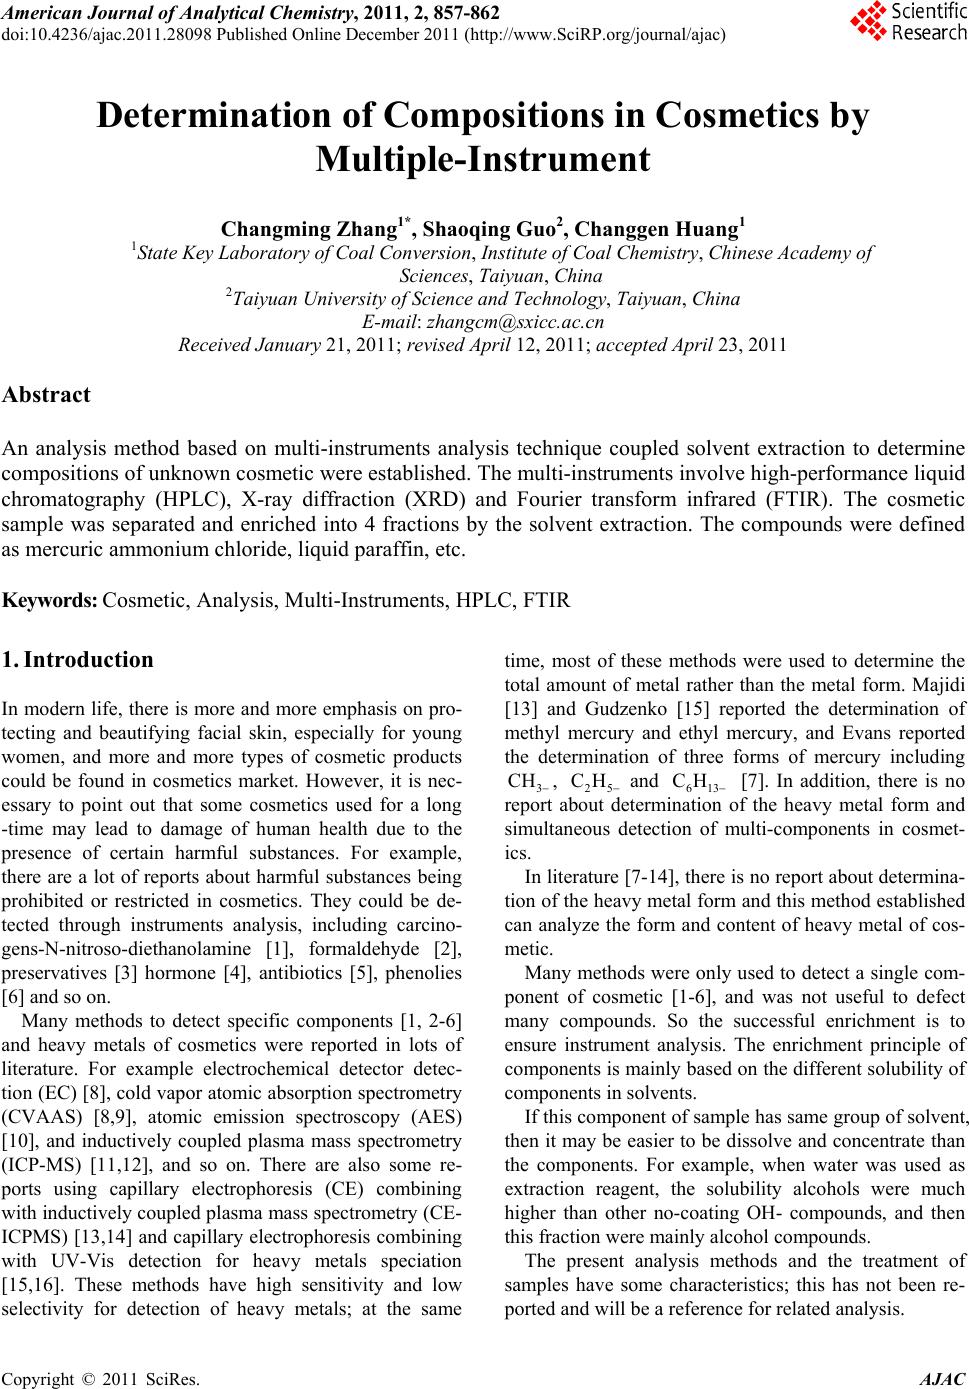
|