 Optics and Photonics Journal, 2011, 1, 155-166 doi:10.4236/opj.2011.14026 Published Online December 2011 (http://www.SciRP.org/journal/opj) Copyright © 2011 SciRes. OPJ Electron-Irradiation and Photo-Excitation Darkening and Bleaching of Yb Doped Silica Fibers: Comparison Alexander V. Kir’yanov Centro de Investigaciones en Optica, Leon, Mexico E-mail: kiryanov@cio.mx Received September 25, 2011; revised October 28, 2011; accepted November 10, 2011 Abstract We report a comparative experimental study of the attenuation spectra transformations for a series of Yb doped alumino-germano silicate fibers with different contents of Yb3+ dopants, which arise as the result of irradiation either by a beam of high-energy electrons or by resonant (into the 977 nm absorption peak of Yb3+ ions) optical pumping. The experimental data obtained reveal that in the two circumstances, substantial and complex but different in appearance changes occur within the resonant absorption band of Yb3+ ions and in the off-resonance background loss of the fibers. Possible mechanisms responsible for these spectral changes are discussed. Keywords: Ytterbium Doped Silica Fibers, Photodarkening, Electron Irradiation 1. Introduction Yb3+ doped silica fibers (YFs) with different core glass hosts co-doped with aluminum, germanium, or phos- phorous have been of considerable interest during the past decades as extremely effective media for fiber lasers for the spectral region 1.0 - 1.1 µm when pumped at 0.9 - 1.0 µm wavelengths. A variety of diode-pumping con- figurations (core and cladding) and pump wavelengths were extensively examined so far which resulted in rec- ognition of optimal arrangements for multi-watt release from YF based lasers with high optical efficiency ~70 - 75% and perfect beam quality [1,2]. However, in spite of remarkable progress in the field, there remain certain obstacles that limit the performance of YF based lasers, one of them being the photodarkening (PD) effect [3], i.e. long-term (minutes to hours) degradation of laser power from units to tens %. This hardly mitigated disadvantage becomes notable when dealing with a laser based on heavily-doped YF where high Yb3+ population inversion is created, either at high-power continuous-wave or mod- erate-power pulsed lasing. A number of studies during the past years were aimed to understand the PD phenom- enon which has remained unclear, although a few hypo- theses have been proposed for its explanation [4-12]. Meanwhile, on one hand, the characterization procedures have been specified to quantify the PD phenomenon in YFs [9,10], allowing a proper choice among YFs for a certain application. And on the other hand, some ways to enhance resistance of YFs to PD or at least to minimize its consequences have been suggested [13,14]. In the meantime, a few studies aimed at the charac- terization of susceptibility of YFs having different che- mical compositions under such irradiations as x-rays, quanta, and UV have been reported recently [15-17]. The main motivation for these works was an inspection of resistance of YF employed in telecommunications and space technologies to harmful environments. In many cases, the excess loss spectra induced in YFs resemble the ones, characteristic for PD at resonant pumping into Yb3+ resonant-absorption (0.9 µm - 1.0 µm) band. This interesting fact undoubtedly deserves attention and veri- fication by an experiment where YF would be subjected to other types of irradiation (say, by high-energy elec- trons) and the result of this be directly compared with the PD consequences in the same YF. Here we report on two sets of experiments where sus- ceptibility of YFs with similar alumino-germano (Al,Ge) silicate glass core but with different Yb3+ ions’ concen- trations is inspected under irradiation either by an elec- tron beam or by resonant (into Yb3+ resonant band) opti- cal pumping. For both circumstances, qualitatively simi- lar trends are revealed: Strong and monotonous changes in attenuation loss of the fibers in VIS (darkening) ac- companied by more complex transformations (an initial decrease followed by increase) within the resonant ab-  A. V. KIR’YANOV 156 sorption band of Yb3+ ions upon dose (the case of elec- tron irradiation) or time (the case of optical pumping at 977-nm wavelength). However, these trends are shown to be peculiar in details. Below, we compare and discuss the experimental data obtained and propose preliminary explanations. 2. Experimental Arrangement 2.1. Fibers Characterization YFs inspected in these experiments were drawn from Al,Ge co-doped silicate glass preforms fabricated using the MCVD and solution-doping processes. The atenua- tion spectra in a pristine (as-received) state of the fibers are shown in Figure 1(a). The concentrations of Yb3+ ions through a set of these YFs differed by more than an order of magnitude, so there were expected differences in the consequences of electron irradiation (further-e-irra- diation) and optical pumping at 977 nm wavelength (fur- ther-OP) on the fibers’ posterior properties. The fiber sam- ples, having correspondingly the lowest, the intermediate, and the highest Yb3+ doping level, are referred further to as YF-1, YF-2, and YF-3. 2.2. Experimental Methods A controllable linear accelerator of the LU type which sources mono-energetic (~6 MeV) electrons was used in experiments where a pulsed (~5-µs) e-irradiation mode has been realized. The experiments were conducted at room temperature. YF samples were irradiated by plac- ing them in the accelerator chamber during various time intervals, which provided growing irradiation doses. In- dices “1”, “2”, and “3” label, on some of the figures be- low, doses 2 × 10¹², 1 × 10¹³, and 5 × 1013 cm-2, respec- tively. The irradiated fibers were leaved for 10 days in advance to the measurements to avoid possible short- living instabilities in the host glass, known for the fibers containing Al and Ge. Notice that ionization, i.e. the production of irradiation-excited carriers by an electron beam within a fiber’s volume, plays the main role in the spectral transformations being reported. This is because high-energy primary electrons are virtually non-dissi- pating at the propagation through the fibers with an outer diameter of 125 µm. Meanwhile, some contribution in ionization might be produced by γ-quanta born at inelas- tic scattering of high-energy electrons propagating throu- gh the host glass. Experiments on OP of YF at 977 nm were made by a similar way as described in Ref. [8]. YF samples were pumped using a standard 300 mW 977 nm laser diode (LD). The pump light was launched from the LD to SMF-28 fiber through a splice and then through one more splice to an YF sample. The end of the latter was spliced to another piece of SMF-28 fiber that was con- nected to an optical spectrum analyzer (OSA) for the transmission spectra measurements. In these experiments, we dealt with short pieces of YFs, of a cm range, to en- sure no-lasing conditions and negligible contribution of amplified spontaneous emission of Yb3+. The optical transmission spectra of the YF samples were obtained using a white-light source with a fiber output and the OSA turned to a 1 nm resolution. These spectra were recorded for a spectral range 400 nm - 1200 nm, where the most interesting spectral transformations occur as the result of e-irradiation or OP. The output of the white-light source was spliced to a fiber set containing (a) (b) Fi gur e 1. ( a) A ttenuation (small-signal absorption) spectra of fibers w ith low (YF-1), i ntermediate (YF-2), and high (YF-3) Yb3+ contents: curves 1, 2, and 3, respectively; (b) Fluorescence spectra of the fibers at resonant 977 nm excitation (pump power—300 mW). Labeling of curves 1, 2, and 3 is the same as in figure (a). Inset in figure (b) shows “cooperative” fluorescence in VIS. Copyright © 2011 SciRes. OPJ 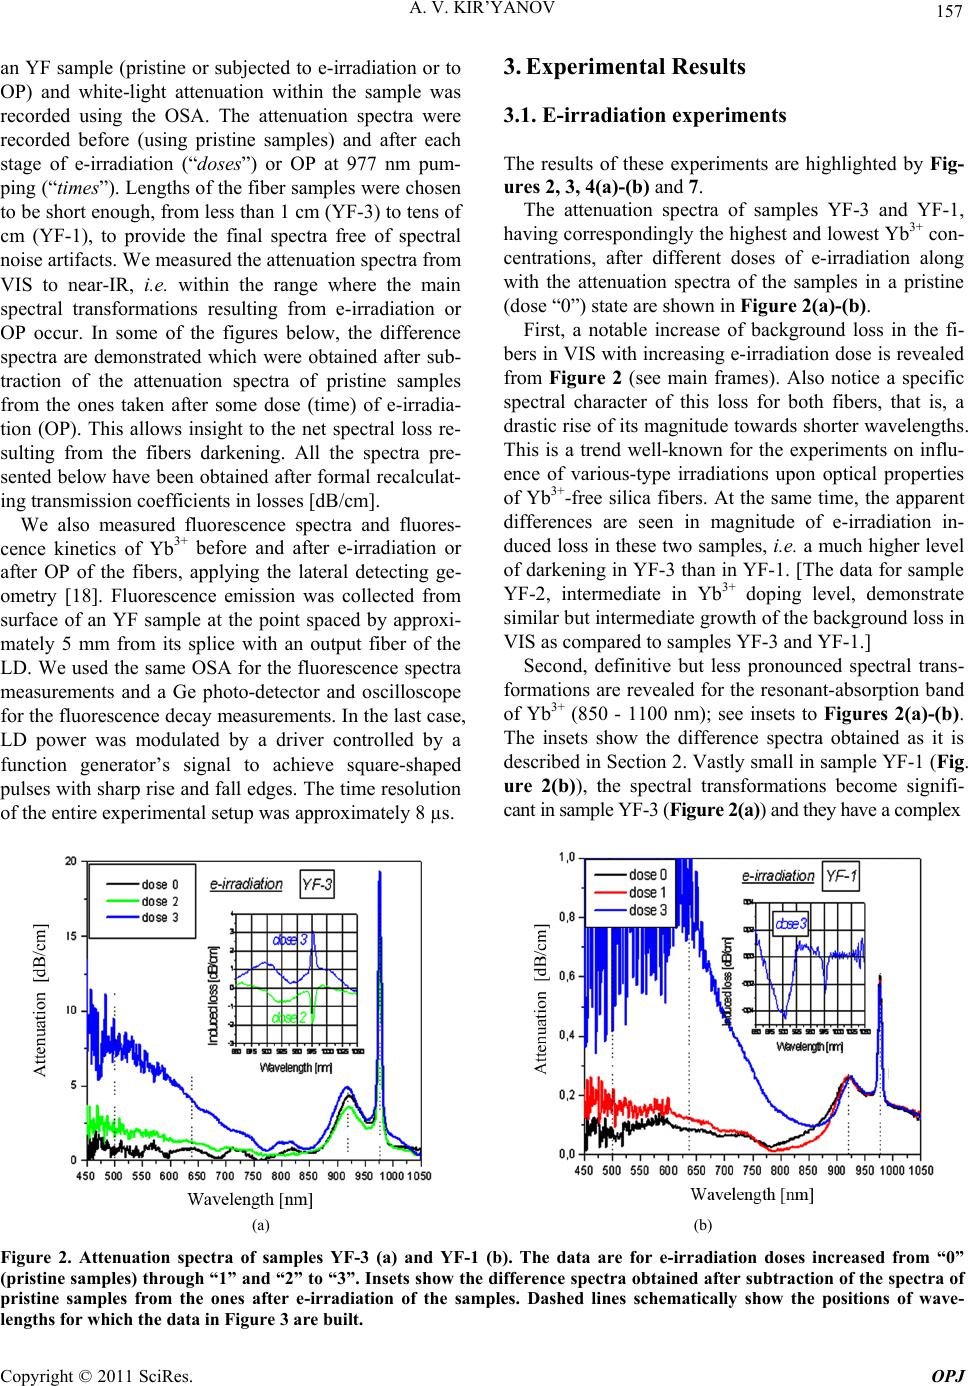 157 A. V. KIR’YANOV an YF sample (pristine or subjected to e-irradiation or to OP) and white-light attenuation within the sample was recorded using the OSA. The attenuation spectra were recorded before (using pristine samples) and after each stage of e-irradiation (“doses”) or OP at 977 nm pum- ping (“times”). Lengths of the fiber samples were chosen to be short enough, from less than 1 cm (YF-3) to tens of cm (YF-1), to provide the final spectra free of spectral noise artifacts. We measured the attenuation spectra from VIS to near-IR, i.e. within the range where the main spectral transformations resulting from e-irradiation or OP occur. In some of the figures below, the difference spectra are demonstrated which were obtained after sub- traction of the attenuation spectra of pristine samples from the ones taken after some dose (time) of e-irradia- tion (OP). This allows insight to the net spectral loss re- sulting from the fibers darkening. All the spectra pre- sented below have been obtained after formal recalculat- ing transmission coefficients in losses [dB/cm]. We also measured fluorescence spectra and fluores- cence kinetics of Yb3+ before and after e-irradiation or after OP of the fibers, applying the lateral detecting ge- ometry [18]. Fluorescence emission was collected from surface of an YF sample at the point spaced by approxi- mately 5 mm from its splice with an output fiber of the LD. We used the same OSA for the fluorescence spectra measurements and a Ge photo-detector and oscilloscope for the fluorescence decay measurements. In the last case, LD power was modulated by a driver controlled by a function generator’s signal to achieve square-shaped pulses with sharp rise and fall edges. The time resolution of the entire experimental setup was approximately 8 µs. 3. Experimental Results 3.1. E-irradiation experiments The results of these experiments are highlighted by Fig- ures 2, 3, 4(a)-(b) and 7. The attenuation spectra of samples YF-3 and YF-1, having correspondingly the highest and lowest Yb3+ con- centrations, after different doses of e-irradiation along with the attenuation spectra of the samples in a pristine (dose “0”) state are shown in Figure 2(a )- (b ). First, a notable increase of background loss in the fi- bers in VIS with increasing e-irradiation dose is revealed from Figure 2 (see main frames). Also notice a specific spectral character of this loss for both fibers, that is, a drastic rise of its magnitude towards shorter wavelengths. This is a trend well-known for the experiments on influ- ence of various-type irradiations upon optical properties of Yb3+-free silica fibers. At the same time, the apparent differences are seen in magnitude of e-irradiation in- duced loss in these two samples, i.e. a much higher level of darkening in YF-3 than in YF-1. [The data for sample YF-2, intermediate in Yb3+ doping level, demonstrate similar but intermediate growth of the background loss in VIS as compared to samples YF-3 and YF-1.] Second, definitive but less pronounced spectral trans- formations are revealed for the resonant-absorption band of Yb3+ (850 - 1100 nm); see insets to Figures 2(a)-(b). The insets show the difference spectra obtained as it is described in Section 2. Vastly small in sample YF-1 (Fig. ure 2(b)), the spectral transformations become signifi- cant in sample YF-3 (Figure 2(a)) and they have a complex (a) (b) Figure 2. Attenuation spectra of samples YF-3 (a) and YF-1 (b). The data are for e-irradiation doses increased from “0” (pristine samples) through “1” and “2” to “3”. Insets show the difference spectra obtained after subtraction of the spectra of pristine samples from the ones after e-irradiation of the samples. Dashed lines schematically show the positions of wave- lengths for which the data in Figure 3 are built. Copyright © 2011 SciRes. OPJ 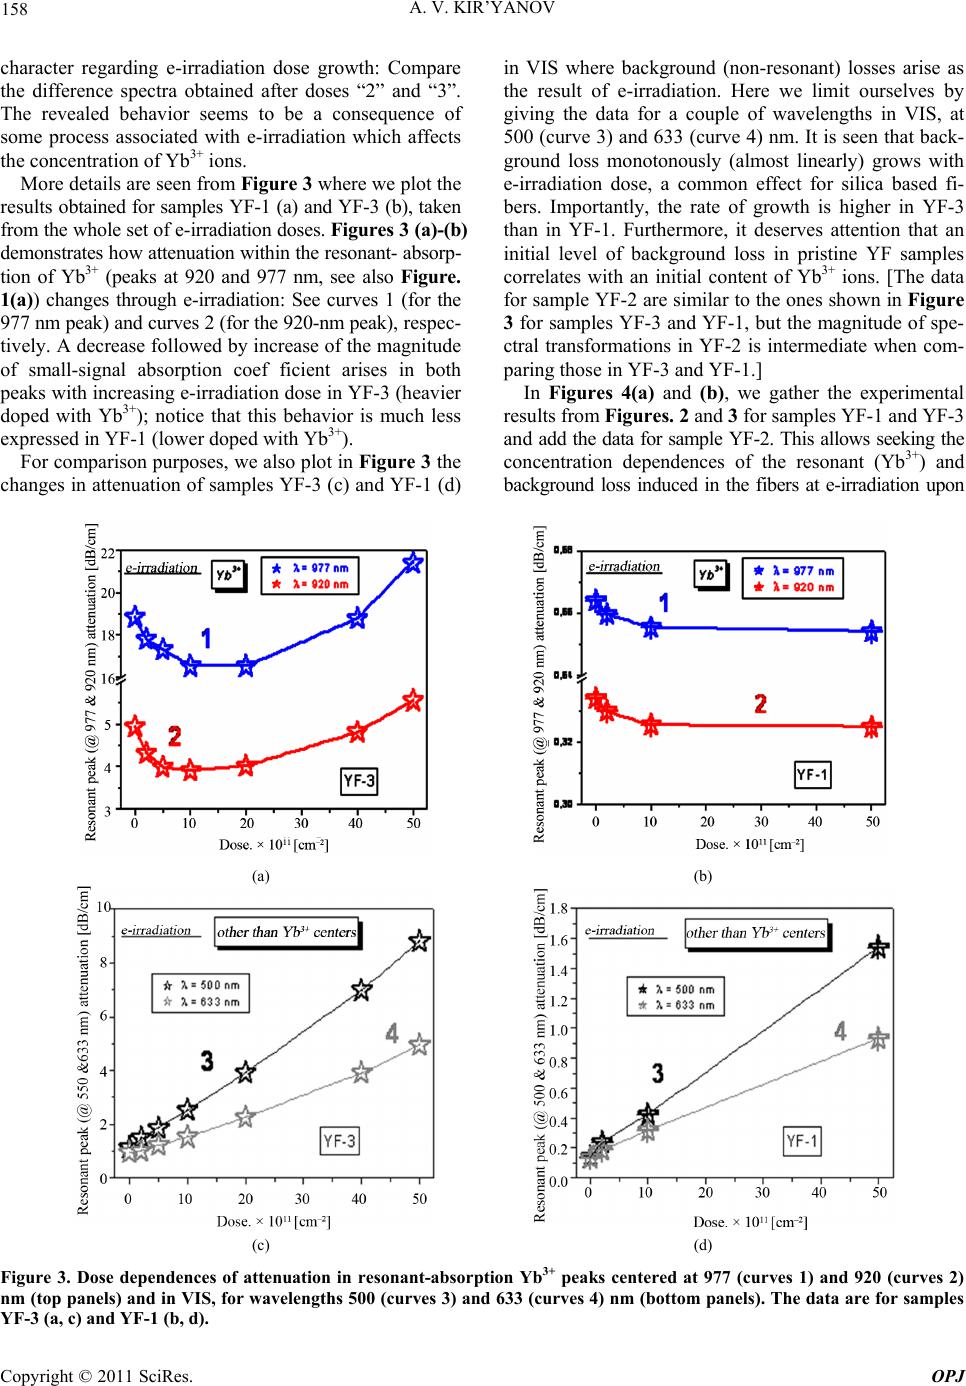 A. V. KIR’YANOV 158 character regarding e-irradiation dose growth: Compare the difference spectra obtained after doses “2” and “3”. The revealed behavior seems to be a consequence of some process associated with e-irradiation which affects the concentration of Yb3+ ions. More details are seen from Figure 3 where we plot the results obtained for samples YF-1 (a) and YF-3 (b), taken from the whole set of e-irradiation doses. Figures 3 (a)-(b) demonstrates how attenuation within the resonant- absorp- tion of Yb3+ (peaks at 920 and 977 nm, see also Figure. 1(a)) changes through e-irradiation: See curves 1 (for the 977 nm peak) and curves 2 (for the 920-nm peak), respec- tively. A decrease followed by increase of the magnitude of small-signal absorption coef ficient arises in both peaks with increasing e-irradiation dose in YF-3 (heavier doped with Yb3+); notice that this behavior is much less expressed in YF-1 (lower doped with Yb3+). For comparison purposes, we also plot in Figure 3 the changes in attenuation of samples YF-3 (c) and YF-1 (d) in VIS where background (non-resonant) losses arise as the result of e-irradiation. Here we limit ourselves by giving the data for a couple of wavelengths in VIS, at 500 (curve 3) and 633 (curve 4) nm. It is seen that back- ground loss monotonously (almost linearly) grows with e-irradiation dose, a common effect for silica based fi- bers. Importantly, the rate of growth is higher in YF-3 than in YF-1. Furthermore, it deserves attention that an initial level of background loss in pristine YF samples correlates with an initial content of Yb3+ ions. [The data for sample YF-2 are similar to the ones shown in Figure 3 for samples YF-3 and YF-1, but the magnitude of spe- ctral transformations in YF-2 is intermediate when com- paring those in YF-3 and YF-1.] In Figures 4(a) and (b), we gather the experimental results from Figures. 2 and 3 for samples YF-1 and YF-3 and add the data for sample YF-2. This allows seeking the concentration dependences of the resonant (Yb3+) and background loss induced in the fibers at e-irradiation upon (a) (b) (c) (d) Figure 3. Dose dependences of attenuation in resonant-absorption Yb3+ peaks centered at 977 (curves 1) and 920 (curves 2) nm (top panels) and in VIS, for wavelengths 500 (curves 3) and 633 (curves 4) nm (bottom panels). The data are for samples YF-3 (a, c) and YF-1 (b, d). Copyright © 2011 SciRes. OPJ 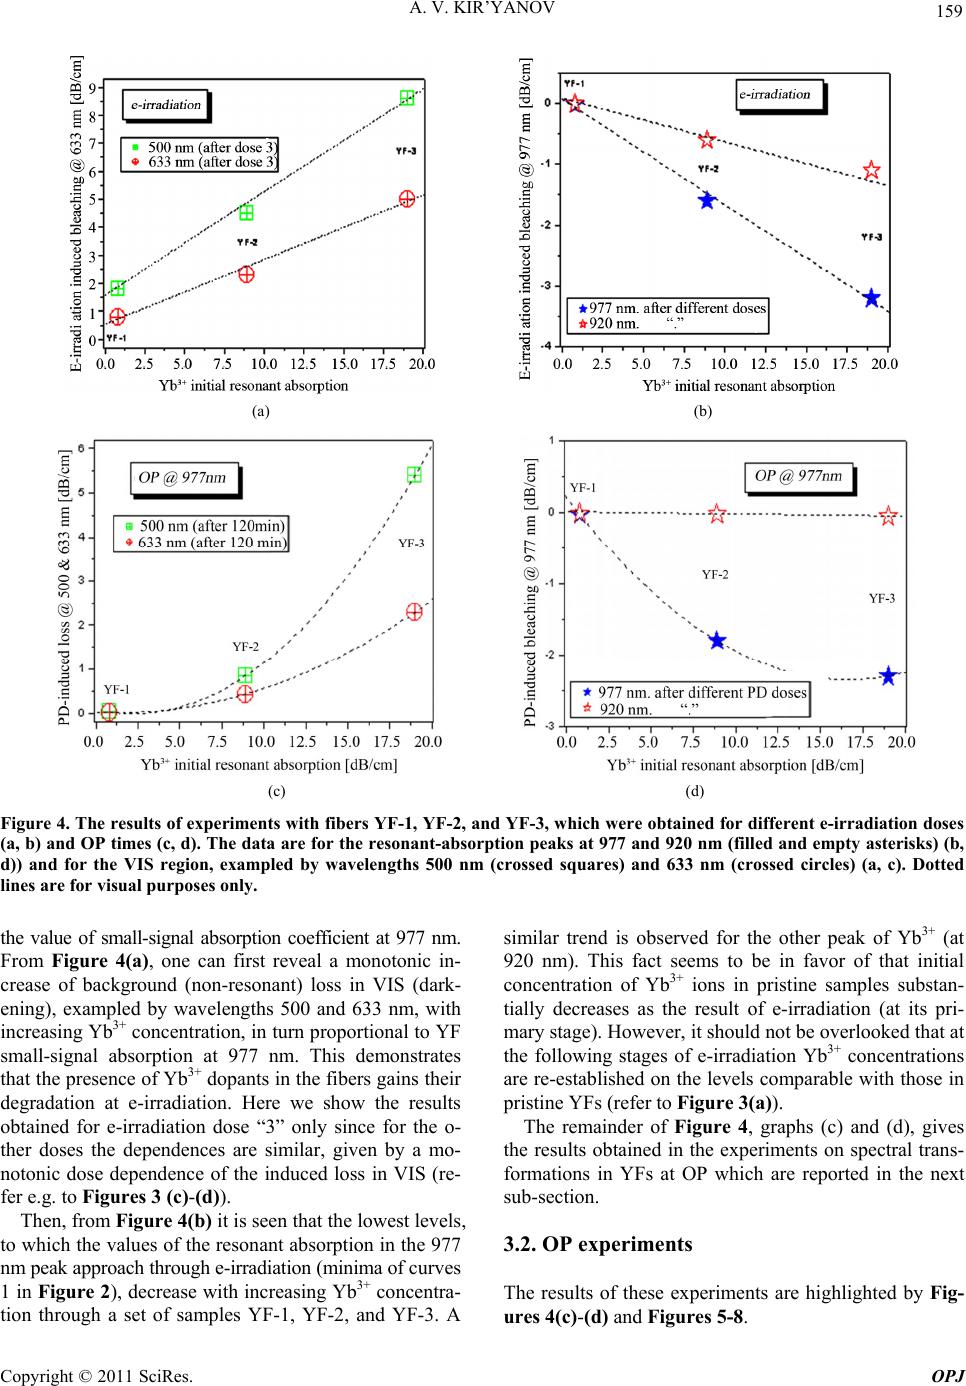 159 A. V. KIR’YANOV (a) (b) (c) (d) Figure 4. The results of experiments with fibers YF-1, YF-2, and YF-3, which were obtained for differe nt e-irradiation doses (a, b) and OP times (c, d). The data are for the resonant-absorption peaks at 977 and 920 nm (filled and empty asterisks) (b, d)) and for the VIS region, exampled by wavelengths 500 nm (crossed squares) and 633 nm (crossed circles) (a, c). Dotted lines are for visual purposes only. the value of small-signal absorption coefficient at 977 nm. From Figure 4(a), one can first reveal a monotonic in- crease of background (non-resonant) loss in VIS (dark- ening), exampled by wavelengths 500 and 633 nm, with increasing Yb3+ concentration, in turn proportional to YF small-signal absorption at 977 nm. This demonstrates that the presence of Yb3+ dopants in the fibers gains their degradation at e-irradiation. Here we show the results obtained for e-irradiation dose “3” only since for the o- ther doses the dependences are similar, given by a mo- notonic dose dependence of the induced loss in VIS (re- fer e.g. to Figures 3 (c)-(d)). Then, from Figure 4(b) it is seen that the lowest levels, to which the values of the resonant absorption in the 977 nm peak approach through e-irradiation (minima of curves 1 in Figure 2), decrease with increasing Yb3+ concentra- tion through a set of samples YF-1, YF-2, and YF-3. A similar trend is observed for the other peak of Yb3+ (at 920 nm). This fact seems to be in favor of that initial concentration of Yb3+ ions in pristine samples substan- tially decreases as the result of e-irradiation (at its pri- mary stage). However, it should not be overlooked that at the following stages of e-irradiation Yb3+ concentrations are re-established on the levels comparable with those in pristine YFs (refer to Figure 3(a)). The remainder of Figure 4, graphs (c) and (d), gives the results obtained in the experiments on spectral trans- formations in YFs at OP which are reported in the next sub-section. 3.2. OP experiments The results of these experiments are highlighted by Fig- ures 4(c)-(d) and Figures 5-8. Copyright © 2011 SciRes. OPJ  A. V. KIR’YANOV 160 We limit ourselves by reporting here the results of OP experiments for sample YF-3 mainly (see Figures 5-7 below), having the highest content of Yb3+ ions in a pris- tine state. Meanwhile, we summarize all of the results (for samples YF-1, YF-2, and YF-3) in Figure 4(c)-(d). Figure 5 shows the attenuation spectra of sample YF-3 (having a short length of 0.8 cm) after 40 and 120 min. of OP. LD power was fixed in these experiments at approximately 300 mW, providing the highest attainable level of Yb3+ population inversion. For comparison, the Figure 5. Attenuation (small-signal absorption) spectra of fiber sample YF-3 after OP @ 977 nm. The data are for a pristine sample (curve 1: “0 min”) and for photo darkened samples (curves 2 and 3, obtained after 40 and 150 min of OP, respectively). Dashed lines show the positions of wave- lengths for which the data in Figure 6 are built. attenuation spectrum of a pristine (0 min) sample YF-3 is shown in Figure 5, too. Once compared with the ate- nuation spectra after e-irradiation (refer to Figure 2(a)), these spectra are seen to be similar in appearance. That is,a substantial increase of background loss arises in VIS with increasing OP time (the PD effect). Notice that the spectral signature of PD resembles the one at darkening after e-irradiation (refer to Figure 2). The spectral changes that occur within the resonant (Yb3+) absorption band at PD of are discussed below; see Figure 7. In Figure 6(a), we demonstrate the results of the ex- periments with sample YF-3, obtained at increasing OP time. Their representation is similar to the one used at the description of experiments on e-irradiation, see Figure 3(a). From Figure 6(a), it is seen how attenuations in the two absorption peaks of Yb3+ ions (at 977 and 920 nm) change through OP; see curves 1 and 2, respectively. The time dependence of OP induced changes at 977 nm re- sembles the dose dependence at e-irradiation of sample YF-3 (see curve 1 in Figure 3(a)). However, curve 1 in Figure 6(a) has an “asymmetric” shape versus OP time, differing from a “symmetric” shape of the dose depend- ence at e-irradiation given by curve 1 in Figure 3(a). Furthermore, the time dependence of OP induced changes at 920 nm, see curve 2 in Figure 6(a), is seen to be very weak, being completely different from curve 2 in Figure 3(a) (e-irradiation). Therefore, we can propose that somewhat different mechanisms are involved in these two (e-irradiation and OP) treatments of the fibers which are responsible for the induced changes within the reso- nant-absorption band of Yb3+ at 977 and 920 nm. (a) (b) Figure 6. Dose dependences of attenuation in resonant-absorption (Yb3+) peaks centered at 977 (curve 1) and 920 (curve 2) nm (a) and in VIS, for wavelengths 500 (curve 3) and 633 (curve 4) nm (b). The data are for sample YF-3. Copyright © 2011 SciRes. OPJ  161 A. V. KIR’YANOV In Figure 6(b), we demonstrate the results of all of the spectral transformations that occur in sample YF-3 in VIS, where non-resonant background loss arises as the result of OP. This can be also seen by referring to Figure 5 and compared with the results of e-irradiation shown in Figure 3(c). Again, we provide in Figure 6(b) the data for a couple of wavelengths only, 500 (curves 3) and 633 (curves 4) nm, as the representatives. In contrast to the dose dependences at e-irradiation, long-term OP at the resonant wavelength 977 nm results in completely dif- ferent dynamics of background loss with time. Indeed, it is essentially nonlinear in time: There is a short time in- terval in the beginning (few minutes) where PD increases dramatically while in the remainder of OP (tens of min- utes) PD slows down and tends to saturate. Note that the described time dependences are very similar to the ones commonly met at PD experiments with YFs at 633-nm probing (a He-Ne laser). Let’s now consider the results shown in Figures 7 and 8 where we make insight to the difference spectra. Figure 7 allows a direct comparison of the attenuation spectra for sample YF-3 after dose “3” of e-irradiation (curve 1) and after 2 hours of OP (curve 2). The spectra look qualitatively similar which could validate the mechanisms that stand behind the spectral transforma- tions to be basically similar. At the same time, if one spectrum is formally subtracted from another, the result (curve 3 in Figure 7) shows a definitive difference. That is, apart from the difference in the background loss which ought to be present in anyway, there is a feature within the Yb3+ resonant band: Although no deviation from a “plain” behavior of curve 3 is seen nearby 920 nm peak of Yb3+, there is a well-pronounced 977 nm Figure 7. Difference attenuation spectra after dose “3” of e-irradiation (curve 1) and after 2 hours of OP at 977 nm (pump power is 300 mW) (curve 2); curve 3 is the differ- ence of spectra 1 and 2. The data are for sample YF-3. peak (it is marked by a dotted ring on Figure 7). This detail seems to be important because it lightens non- homogeneity within the Yb3+ resonant-absorption band nearby 977 nm, present at long-term OP but not—at e-irradiation of the fiber. This becomes more apparent when an analysis of the results of OP-induced PD of the other samples, YF-1 and YF-2, has been made. Indeed, from Figures 8 (a)-(b), where we plot the difference spectra obtained for these fibers, a firm spectral detail is seen to appear exactly within the 977 nm peak of Yb3+ ions (it is marked by a dotted ring in plots (a) and (b)). This fact can be inter- preted as follows: At OP-induced PD, that is, at rising of background loss tailing from VIS towards near-IR (see the left part of Figures 8(a)-(b)), drastic decreasing of the resonant absorption occurs within a narrow 977-nm peak. Some more assertions on this feature are made in the Discussion section. In Figures 4(c)-(d), we gather the results of OP experi- ments for an entire set of YF samples, seeking the concen- tration dependences of the resonant (within the Yb3+ band) and background non-resonant spectral transformations. In contrast to the results of e-irradiation (refer to Fig- ures 4(a)-(b)), one can firstly reveal essentially nonlin- ear growth of background loss at wavelengths 500 and 633 nm with increasing Yb3+ concentration (Figure 4(c)). Obviously, it is different from linear growth of back- ground loss at e-irradiation of the fibers (Figure 4(a)). Secondly, it is seen that instead of a linear decrease of resonant absorption peaks at 977 and 920 nm with dose, occurring at primary stages of e-irradiation (see Figure 4(b)), a strongly nonlinear law is seen to fit a decrease of the resonant absorption peak at 977 nm while almost no change to be present at 920 nm; see Figure 4(d ). Hence, the situation with OP induced spectral trans- formations in our YFs is more complex and curious at first glance. The 977 nm peak is strongly affected by OP, not the 920 nm one. This can be explained by the pres- ence in the fibers of centers others than Yb3+ dopants, but closely related to them and spectrally matching them nearby 977 nm. Moreover, partial weight of such centers in YF core ought to increase with increasing Yb3+ ions concentration. The nonlinear behavior of non-resonant background loss versus OP time, revealed above (see Figure 6(b) ), seems to be a closely related phenomenon. It should be noted that at further exposure of YFs to OP an initial state of the resonant absorption peaks tends to restore (Figure 6(a)), thus demonstrating the behavior quite similar to e-irradiation of the fibers (Figure 3(a)). 3.3. Fluorescence Measurements The fluorescence spectra obtained for pristine samples Copyright © 2011 SciRes. OPJ 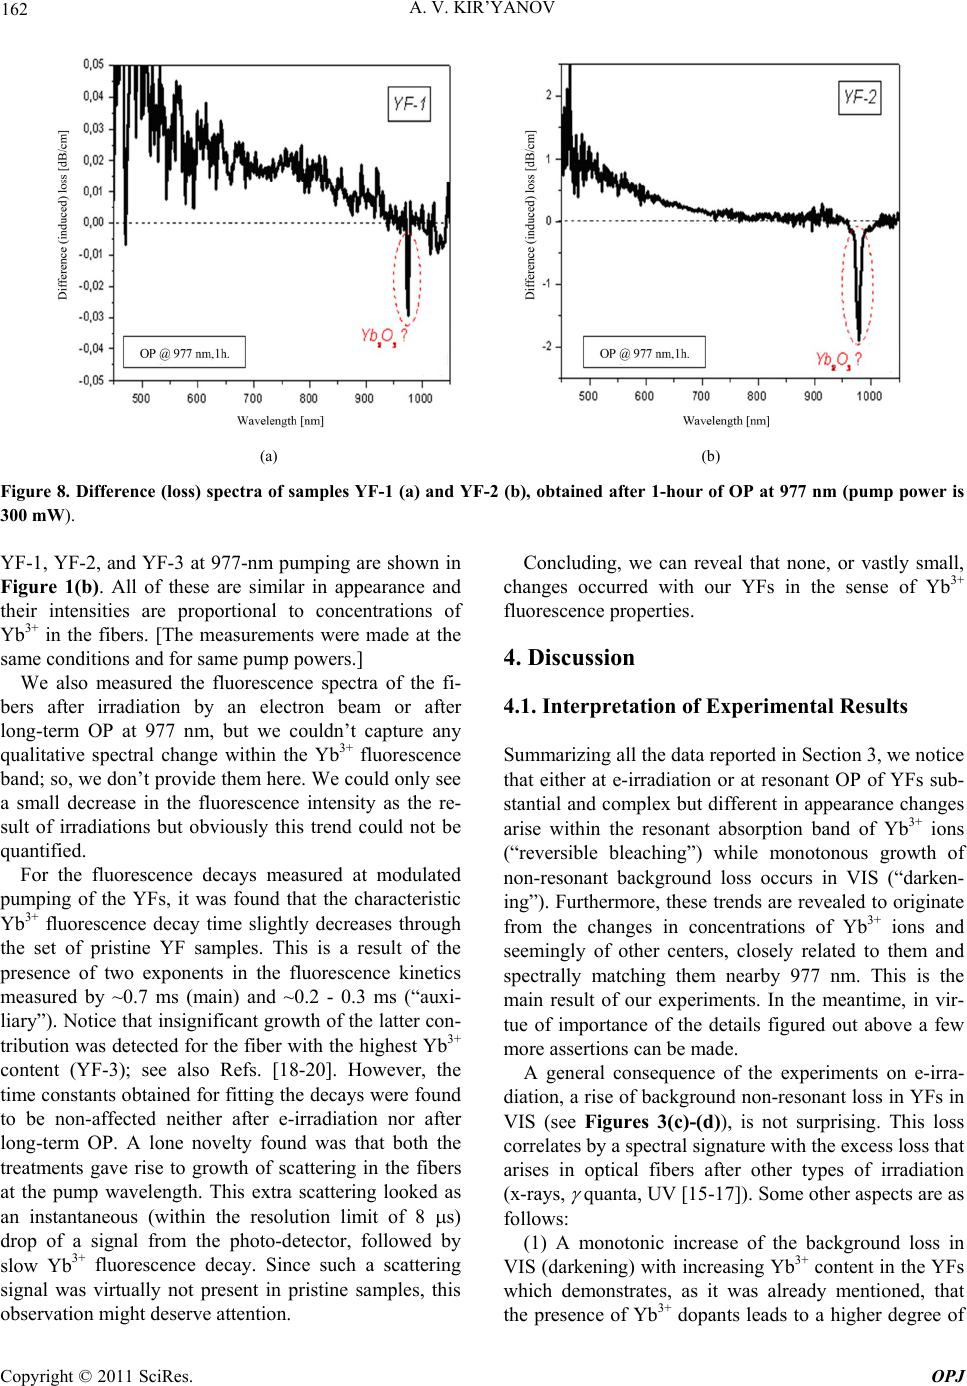 A. V. KIR’YANOV 162 (a) (b) Figure 8. Difference (loss) spectra of samples YF-1 (a) and YF-2 (b), obtained after 1-hour of OP at 977 nm (pump power is 300 mW). YF-1, YF-2, and YF-3 at 977-nm pumping are shown in Figure 1(b). All of these are similar in appearance and their intensities are proportional to concentrations of Yb3+ in the fibers. [The measurements were made at the same conditions and for same pump powers.] We also measured the fluorescence spectra of the fi- bers after irradiation by an electron beam or after long-term OP at 977 nm, but we couldn’t capture any qualitative spectral change within the Yb3+ fluorescence band; so, we don’t provide them here. We could only see a small decrease in the fluorescence intensity as the re- sult of irradiations but obviously this trend could not be quantified. For the fluorescence decays measured at modulated pumping of the YFs, it was found that the characteristic Yb3+ fluorescence decay time slightly decreases through the set of pristine YF samples. This is a result of the presence of two exponents in the fluorescence kinetics measured by ~0.7 ms (main) and ~0.2 - 0.3 ms (“auxi- liary”). Notice that insignificant growth of the latter con- tribution was detected for the fiber with the highest Yb3+ content (YF-3); see also Refs. [18-20]. However, the time constants obtained for fitting the decays were found to be non-affected neither after e-irradiation nor after long-term OP. A lone novelty found was that both the treatments gave rise to growth of scattering in the fibers at the pump wavelength. This extra scattering looked as an instantaneous (within the resolution limit of 8 s) drop of a signal from the photo-detector, followed by slow Yb3+ fluorescence decay. Since such a scattering signal was virtually not present in pristine samples, this observation might deserve attention. Concluding, we can reveal that none, or vastly small, changes occurred with our YFs in the sense of Yb3+ fluorescence properties. 4. Discussion 4.1. Interpretation of Experimental Results Summarizing all the data reported in Section 3, we notice that either at e-irradiation or at resonant OP of YFs sub- stantial and complex but different in appearance changes arise within the resonant absorption band of Yb3+ ions (“reversible bleaching”) while monotonous growth of non-resonant background loss occurs in VIS (“darken- ing”). Furthermore, these trends are revealed to originate from the changes in concentrations of Yb3+ ions and seemingly of other centers, closely related to them and spectrally matching them nearby 977 nm. This is the main result of our experiments. In the meantime, in vir- tue of importance of the details figured out above a few more assertions can be made. A general consequence of the experiments on e-irra- diation, a rise of background non-resonant loss in YFs in VIS (see Figures 3(c)-(d)), is not surprising. This loss correlates by a spectral signature with the excess loss that arises in optical fibers after other types of irradiation (x-rays, quanta, UV [15-17]). Some other aspects are as follows: (1) A monotonic increase of the background loss in VIS (darkening) with increasing Yb3+ content in the YFs which demonstrates, as it was already mentioned, that the presence of Yb3+ dopants leads to a higher degree of Copyright © 2011 SciRes. OPJ 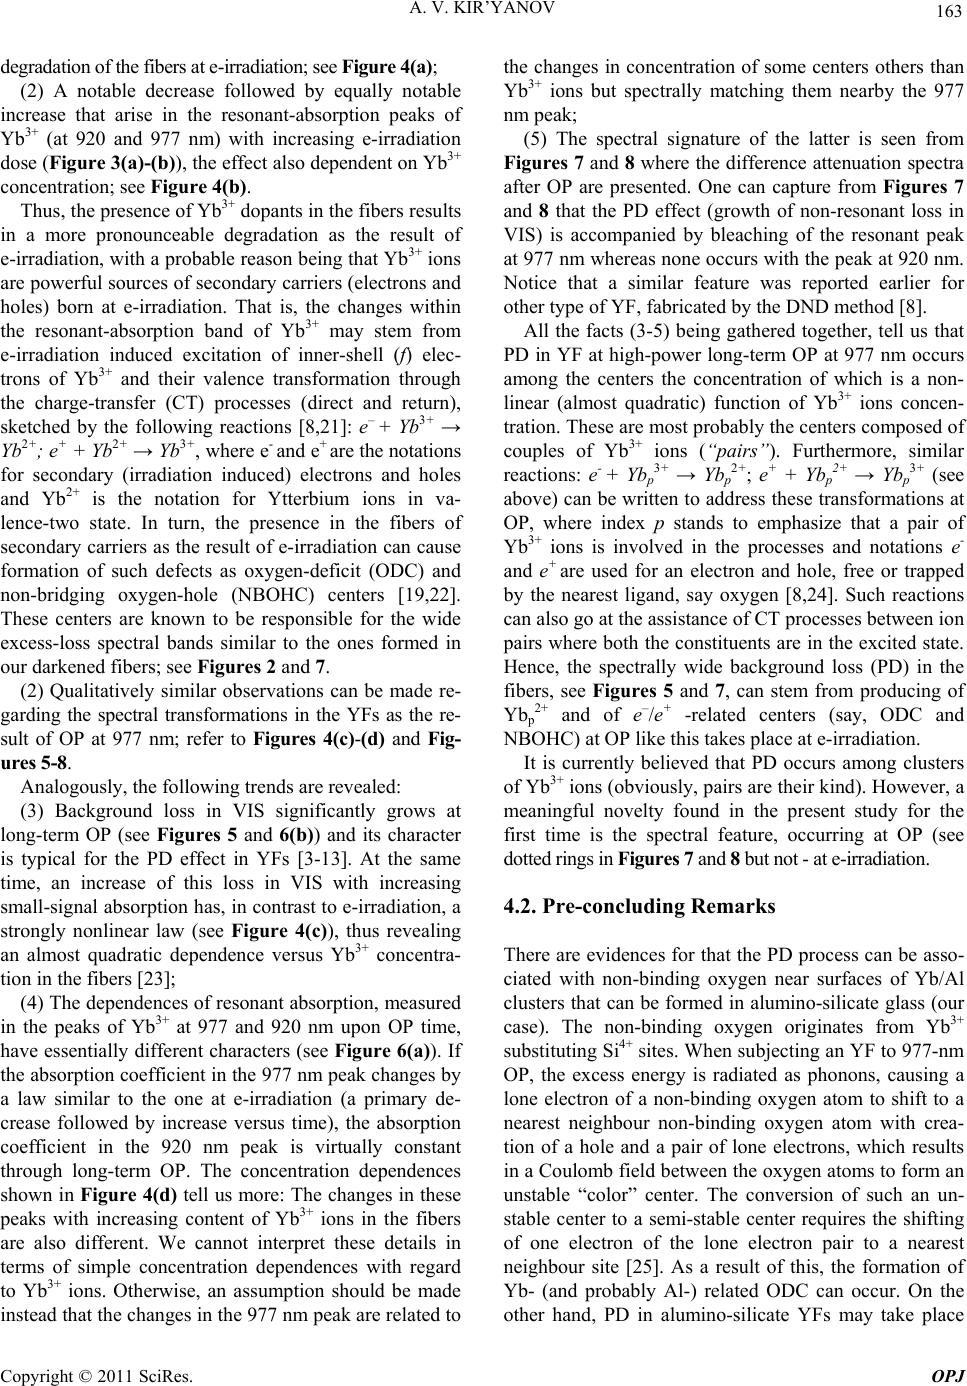 163 A. V. KIR’YANOV degradation of the fibers at e-irradiation; see Figure 4(a); (2) A notable decrease followed by equally notable increase that arise in the resonant-absorption peaks of Yb3+ (at 920 and 977 nm) with increasing e-irradiation dose (Figure 3(a)-(b)), the effect also dependent on Yb3+ concentration; see Figure 4(b). Thus, the presence of Yb3+ dopants in the fibers results in a more pronounceable degradation as the result of e-irradiation, with a probable reason being that Yb3+ ions are powerful sources of secondary carriers (electrons and holes) born at e-irradiation. That is, the changes within the resonant-absorption band of Yb3+ may stem from e-irradiation induced excitation of inner-shell (f) elec- trons of Yb3+ and their valence transformation through the charge-transfer (CT) processes (direct and return), sketched by the following reactions [8,21]: e– + Yb3+ → Yb2+; e+ + Yb2+ → Yb3+, where e- and e+ are the notations for secondary (irradiation induced) electrons and holes and Yb2+ is the notation for Ytterbium ions in va- lence-two state. In turn, the presence in the fibers of secondary carriers as the result of e-irradiation can cause formation of such defects as oxygen-deficit (ODC) and non-bridging oxygen-hole (NBOHC) centers [19,22]. These centers are known to be responsible for the wide excess-loss spectral bands similar to the ones formed in our darkened fibers; see Figures 2 and 7. (2) Qualitatively similar observations can be made re- garding the spectral transformations in the YFs as the re- sult of OP at 977 nm; refer to Figures 4(c)-(d) and Fig- ures 5-8. Analogously, the following trends are revealed: (3) Background loss in VIS significantly grows at long-term OP (see Figures 5 and 6(b)) and its character is typical for the PD effect in YFs [3-13]. At the same time, an increase of this loss in VIS with increasing small-signal absorption has, in contrast to e-irradiation, a strongly nonlinear law (see Figure 4(c)), thus revealing an almost quadratic dependence versus Yb3+ concentra- tion in the fibers [23]; (4) The dependences of resonant absorption, measured in the peaks of Yb3+ at 977 and 920 nm upon OP time, have essentially different characters (see Figure 6(a)). If the absorption coefficient in the 977 nm peak changes by a law similar to the one at e-irradiation (a primary de- crease followed by increase versus time), the absorption coefficient in the 920 nm peak is virtually constant through long-term OP. The concentration dependences shown in Figure 4(d) tell us more: The changes in these peaks with increasing content of Yb3+ ions in the fibers are also different. We cannot interpret these details in terms of simple concentration dependences with regard to Yb3+ ions. Otherwise, an assumption should be made instead that the changes in the 977 nm peak are related to the changes in concentration of some centers others than Yb3+ ions but spectrally matching them nearby the 977 nm peak; (5) The spectral signature of the latter is seen from Figures 7 and 8 where the difference attenuation spectra after OP are presented. One can capture from Figures 7 and 8 that the PD effect (growth of non-resonant loss in VIS) is accompanied by bleaching of the resonant peak at 977 nm whereas none occurs with the peak at 920 nm. Notice that a similar feature was reported earlier for other type of YF, fabricated by the DND method [8]. All the facts (3-5) being gathered together, tell us that PD in YF at high-power long-term OP at 977 nm occurs among the centers the concentration of which is a non- linear (almost quadratic) function of Yb3+ ions concen- tration. These are most probably the centers composed of couples of Yb3+ ions (“pairs”). Furthermore, similar reactions: e- + Ybp 3+ → Ybp 2+; e+ + Ybp 2+ → Ybp 3+ (see above) can be written to address these transformations at OP, where index p stands to emphasize that a pair of Yb3+ ions is involved in the processes and notations e- and e+ are used for an electron and hole, free or trapped by the nearest ligand, say oxygen [8,24]. Such reactions can also go at the assistance of CT processes between ion pairs where both the constituents are in the excited state. Hence, the spectrally wide background loss (PD) in the fibers, see Figures 5 and 7, can stem from producing of Ybp 2+ and of e–/e+ -related centers (say, ODC and NBOHC) at OP like this takes place at e-irradiation. It is currently believed that PD occurs among clusters of Yb3+ ions (obviously, pairs are their kind). However, a meaningful novelty found in the present study for the first time is the spectral feature, occurring at OP (see dotted rings in Figures 7 and 8 but not - at e-irradiation. 4.2. Pre-concluding Remarks There are evidences for that the PD process can be asso- ciated with non-binding oxygen near surfaces of Yb/Al clusters that can be formed in alumino-silicate glass (our case). The non-binding oxygen originates from Yb3+ substituting Si4+ sites. When subjecting an YF to 977-nm OP, the excess energy is radiated as phonons, causing a lone electron of a non-binding oxygen atom to shift to a nearest neighbour non-binding oxygen atom with crea- tion of a hole and a pair of lone electrons, which results in a Coulomb field between the oxygen atoms to form an unstable “color” center. The conversion of such an un- stable center to a semi-stable center requires the shifting of one electron of the lone electron pair to a nearest neighbour site [25]. As a result of this, the formation of Yb- (and probably Al-) related ODC can occur. On the other hand, PD in alumino-silicate YFs may take place Copyright © 2011 SciRes. OPJ  A. V. KIR’YANOV 164 through the breaking of ODC, which gives rise to release of free electrons. The released electrons may be trapped at Al or Yb sites to form a color center resulting in PD. These hypotheses can serve as the arguments, bringing more clarity in understanding of similarity of the spectral transformations in YFs at e-irradiation (creation of “sec- ondary” carriers in the core glass by an electron beam) and at OP (creation of carriers and color centers by the pump light). II. Some more assumptions can be made in attempt to understand the PD phenomenon at OP. Of course, dif- ferent “paired” complexes (say, Yb-O-Yb or more com- plicate clusters of such kind) can be thought to be in- volved at PD, but we suggest here Yb2O3 “molecules” (or their agglomerates), the presence of which in YFs at increasing Yb3+ ions concentration is quite probabilistic [26]. It is also worth noting that CT transitions are well-known for Yb-doped sesquioxides (Yb2O3 is one of them) while these are still debated for single Yb3+ ions “dissolved” in YF core glass [8,12,27,28]. So, Ybp 3+ in the form of inherent centers Yb2O3, absorption spectrum of which matches well the spectral feature ringed in Figure 8, seem to be relevant candidates to explain PD: Refer e.g. to the works [29,30] where the presence of the strong 977 nm peak and the absence (vanishing) of the 920-nm peak was revealed to be characteristic for Yb2O3 (see also Ref. [31] where the peaks at 977 nm from sin- gle and paired Yb3+ are shown to match spectrally). Fur- thermore, on one hand, the presence of cooperative VIS fluorescence at 977 nm excitation (see inset in Figure 1(b)) is typical for Yb2O3 [32], while on the other hand, PD was proved to be associated with the presence of cooperative processes in YFs [7,33]. (The spectral fea- ture seen in Figure 1(b) in VIS is undoubtedly ascribed by us to the cooperative fluorescence of Yb3+ since no other spectral features were detected which would origi- nate from traces of un-wanted rare-earth dopants [34,35] like Tm3+.) One more assumption can be made that Yb2O3 is a typical defect center in the core glass network which can be formed at high Yb3+ concentrations. Probably, namely this “color” center, firstly detected yet in 1997 [36], is responsible for the presence of non-saturated (by 977-nm radiation) resonant absorption in heavily Yb3+ doped fibers [18,36-38]. This non-saturated absorption can be understandable in virtue of extremely high absorption coefficient at 977 nm (~1x10-20 cm2) and almost quenched fluorescence (~10 µs), characteristic for Yb2O3 centers [28,32,39]. Apparently, these values are com- pletely incompatible with those known for single Yb3+ ions dissolved in the core glass: ~1x10-21 cm2 and ~1 ms, respectively; see e.g. Ref. [40]. Further, possible pre- sence of Yb2O3 centers in heavily-doped YF, which in- tensively absorb the pump light but are non-fluorescent (“quenched”), may cause an excessive temperature rise in YF core. It is logical to bridge here to the papers [41,42] where the idea of an intrinsic color center, like Yb2O3, has been proposed to address some of the concentration phenom- ena in heavily rare-earth doped materials. So, the physi- cal essences given by doping YF with Yb2O3 (non-in- tentionally or intentionally [43]) can be of importance. III. We didn’t discuss above a possible role of the spectral changes in refractive index of YFs at OP and e-irradiation which ought to be induced as well, accor- ding to the Kramers–Kroënig relations. A study of these changes can be the substance of a future work. 5. Conclusions We report a comparative experimental study of the ate- nuation spectra transformations for a series of Yb doped alumino-germano silicate fibers with various Yb3+ con- tents, occurring as the result of irradiation either by a beam of high-energy electrons or at in-band optical pumping at 977 nm wavelength. Substantial and complex but different in appearance changes are found to arise within the resonant absorption band of Yb3+ ions (re- versible bleaching) while monotonous growth of non- resonant background loss to occur in VIS (darkening). Both the trends are shown to originate from the changes in concentrations of either Yb3+ ions (at electron irradia- tion) or other centers, seemingly Yb3+ clusters, closely related to single Yb3+ ions and spectrally matching them at 977 nm (at optical pumping). So, in both cases, i.e. at photodarkening, observed in heavily Yb3+ doped fibers at resonant (977 nm) optical pumping, and at electron irra- diation-induced darkening of the fibers, we can capture a notable role of Yb3+ dopants as the agents, creating high-energy radiation, responsible for formation of color centers in the fibers, and at the same time their role as the sensitizers of these processes. 6. Acknowledgements Author thanks Dr. N.S. Kozlova (MISIS, Moscow, Rus- sia) and Dr. A.D. Guzman Chavez (CIO, Leon, Mexico) for help in making e-irradiation and photodarkening measurements, respectively, and Dr. Yu.O. Barmenkov (CIO, Leon, Mexico) and Dr. N.N. Il’ichev (GPI, Mos- cow, Russia) for useful discussions. 7. References [1] H. M. Pask, R. J. Carman, D. C. Hanna, A. C. Tropper, C. J. Mackechnie, P. R. Barber and J. M. Dawes, “Ytter- Copyright © 2011 SciRes. OPJ  165 A. V. KIR’YANOV bium-Doped Silica Fiber Lasers: Versatile Sources for the 1 - 1.2 µm Region,” IEEE Journal of Quantum Electron- ics, Vol. 1, No. 1, 1995, pp. 2-13. doi:10.1109/2944.468377 [2] D. J. Richardson, J. Nilsson and W. A. Clarkson, “High- Power Fiber Lasers: Current Status and Future Perspec- tives,” Journal of Optical Society of America B, Vol. 27, No. 11, 2010, pp. B63-B92. doi:10.1364/JOSAB.27.000B63 [3] J. J. Koponen, M. J. Soderlund, H. J. Hoffman and S. K. T. Tammela, “Measuring Photodarkening from Sin- gle-Mode Ytterbium Doped Silica Fibers,” Optics Ex- press, Vol. 14, No. 24, 2006, pp. 11539-11544. doi:10.1364/OE.14.011539 [4] J. Kirchhof, S. Unger, A. Schwuchow, S. Grimm and V. Reichel, “Materials for High-Power Fiber Lasers,” Jour- nal of Non-Crystalline Solids, Vol. 352, No. 23-25, 2006, pp. 2399-2403. doi:10.1016/j.jnoncrysol.2006.02.061 [5] I. Manek-Honninger, J. Boullet, T. Cardinal, F. Guillen, M. Podgorski, R. Bello Doua and F. Salin, “Photodark- ening and Photobleaching of an Ytterbium-Doped Silica Double-Clad LMA Fiber,” Optics Express, Vol. 15, No. 4, 2007, pp. 1606-1611. doi:10.1364/OE.15.001606 [6] S. Jetschke, S. Unger, U. Ropke and J. Kirchhof, “Photo- darkening in Yb Doped Fibers: Experimental Evidence of Equilibrium States Depending on the Pump Power,” Op- tics Express, Vol. 15, No. 4, 2007, pp. 14838-14843. doi:10.1364/OE.15.014838 [7] T. Kitabayashi, M. Ikeda, M. Nakai, T. Sakai, K. Himeno and K. Ohashi, “Population Inversion Factor Dependence of Photodarkening of Yb-Doped Fibers and Its Suppres- sion by Highly Aluminum Doping,” Optical Fiber Com- munications Conference, Anaheim, 5 March 2006. doi:10.1109/OFC.2006.215694 [8] A. D. Guzman Chavez, A. V. Kir’yanov, Y. O. Bar- menkov and N. N. Il’ichev, “Reversible Photo-Darkening and Resonant Photo-Bleaching of Ytterbium-Doped Sil- ica Fiber at in-Core 977 nm and 543 nm Irradiation,” La- ser Physics Letters, Vol. 4, No. 10, 2007, pp. 734-739. doi:10.1002/lapl.200710053 [9] J. Koponen, M. Soderlund, H. J. Hoffman, D. A. V. Kli- ner, J. P. Koplow and M. Hotoleanu, “Photodarkening Rate in Yb-Doped Silica Fibers,” Applied Optics, Vol. 47, No. 9, 2008, pp. 1247-1256. doi:10.1364/AO.47.001247 [10] J. Koponen, M. Laurila and M. Hotoleanu, “Inversion Behavior in Core- and Cladding-Pumped Yb-Doped Fi- ber Photodarkening Measurements,” Applied Optics, Vol. 47, No. 9, 2008, pp. 4522-4528. doi:10.1364/AO.47.004522 [11] S. Yoo, C. Basu, A. J. Boyland, C. Sones, J. Nilsson, J. K. Sahu and D. Payne, “Photodarkening in Yb-Doped Alu- minosilicate Fibers Induced by 488 nm Irradiation,” Op- tics Letters, Vol. 32, No. 12, 2007, pp. 1626-1628. doi:10.1364/OL.32.001626 [12] M. Engholm, L. Norin and D. Aberg, “Improved Pho- todarkening Resistivity in Ytterbium-Doped Fiber Lasers by Cerium Codoping,” Optics Letters, Vol. 34, No. 8, 2009, pp. 1285-1287. doi:10.1364/OL.34.001285 [13] M. Engholm, P. Jelger, F. Laurell and L. Norin, “Strong UV Absorption and Visible Luminescence in Ytterbium- Doped Aluminosilicate Glass under UV Excitation,” Op- tics Letters, Vol. 32, No. 22, 2007, pp. 3352-3354. doi:10.1364/OL.32.003352 [14] S. Suzuki, H. A. McKay, X. Peng, L. Fu and L. Dong, “Highly Ytterbium-Doped Silica Fibers with Low Photo- Darkening,” Optics Express, Vol. 17, No. 12, 2009, pp. 9924-9932. doi:10.1364/OE.17.009924 [15] B. P. Fox, Z. V. Schneider, K. Simmons-Potter, W. J. Thomes Jr., D. C. Meister, R. P. Bambha, D. A. V. Kliner and M. J. Soderlund, “Gamma Radiation Effects in Yb- Doped Optical Fiber,” Fiber Lasers IV: Technology, Sys- tems, and Applications, Proceedings of SPIE, San Jose, Vol. 6453, 22 January 2007, paper 645328, pp. 1-8. doi:10.1117/12.712244 [16] T. Arai, K. Ichii, S. Tanigawa and M. Fujimaki, “Gam- ma-Irradiation-Induced Photodarkening in Ytterbium- Doped Silica Glasses,” Fiber Lasers VIII: Technology, Systems, and Applications, Proceedings of SPIE, San Francisco, 24 January 2011, Vol. 7914, paper 79140K, pp. 1-6. [17] N. Groothoff, J. Canning, M. Aslund and S. Jackson, “193 nm Photodarkening of Ytterbium-Doped Optical Fi- bre,” OSA Meeting on Bragg Gratings, Photosensitivity, and Poling in Glass Waveguides, Quebec City, 2-6 Sep- tember 2007, paper BTuC2. [18] A. V. Kir’yanov, Yu. O. Barmenkov, I. Lucio Martinez, A. S. Kurkov and E. M. Dianov, “Cooperative Lumines- cence and Absorption in Ytterbium-Doped Silica Fiber and the Fiber Nonlinear Transmission Coefficient at λ = 980 nm with a Regard to the Ytterbium Ion-Pairs’ Ef- fect,” Optics Express, Vol. 14, No. 9, 2006, pp. 3981- 3992. doi:10.1364/OE.14.006983 [19] C. G. Carlson, K. E. Keister, P. D. Dragic, A. Croteau, and J. G. Eden, “Photoexcitation of Yb-Doped Alumino- silicate Fibers at 250 nm: Evidence for Excitation Trans- fer from Oxygen Deficiency Centers to Yb3+,” Journal of Optical Society of America B, Vol. 27, No. 10, 2010, pp. 2087-2094. doi:10.1364/JOSAB.27.002087 [20] Z. Burshtein, Y. Kalisky, S. Z. Levy, P. Le Boulanger and S. Rotman, “Impurity Local Phonon Nonradiative Quenching of Yb Fluorescence in Ytterbium-Doped Sili- cate Glasses,” IEEE Journal of Quantum Electronics, Vol. 36, No. 8, 2000, pp. 1000-1007. doi:10.1109/3.853562 [21] G. Stryganyuk, S. Zazubovich, A. Voloshinovskii, M. Pidzyrailo, G. Zimmerer, R. Peters and K. Petermann, “Charge Transfer Luminescence of Yb3+ Ions in LiY1 -xYbxP4O12 Phosphates,” Journal of Physics: Conden- sed Matter, Vol. 19, No. 47, 2007, Article No. 036202. doi:10.1088/0953-8984/19/3/036202 [22] S. Girard, Y. Ouerdane, G. Origlio, C. Marcandella, A. Boukenter, N. Richard, J. Baggio, P. Paillet, M. Cannas, J. Bisutti, J.-P. Meunier and R. Boscaino, “Radiation Ef- fects on Silica-Based Preforms and Optical Fibers I: Ex- perimental Study with Canonical Samples,” IEEE Trans- actions of Nuclear Science, Vol. 35, No. 5, 2008, pp. 3473-3482. doi:10.1109/TNS.2008.2007297 Copyright © 2011 SciRes. OPJ  A. V. KIR’YANOV Copyright © 2011 SciRes. OPJ 166 [23] M. N. Zervas, F. Ghiringhelli, M. K. Durkin and I. Crowe, “Distribution of Photodarkening-Induced Loss in Yb- Doped Fiber Amplifiers,” Fiber Lasers VIII: Technology, Systems, and Applications, Proceedings of SPIE, San Francisco, Vol. 7914, 24 January 2011, paper 79140L, pp. 1-8.. [24] F. Mady, M. Benabdesselam and W. Blanc, “Thermolu- minescence Characterization of Traps Involved in the Photodarkening of Ytterbium-Dopes Silica Fibers,” Op- tics Letters, Vol. 35, No. 21, 2011, pp. 3541-3543. doi:10.1364/OL.35.003541 [25] K. E. Mattsson, S. N. Knudsen, B. Cadier and T.Robin, “Photo Darkening in Ytterbium Co-Doped Silica Material,” Fiber Lasers V: Technology, Syst e ms, and Applications, Proceedings of SPIE, San Jose, Vol. 6873, 21 January 2008, paper 68731C, pp. 1-11. doi:10.1117/12.763117 [26] S. Sen, R. Rakhmatullin, R. Gubaydullin and A. Silakov, “A Pulsed EPR Study of Clustering of Yb3+ Ions Incor- porated in GeO2 Gass,” Journal of Non-Crystalline Sol- ids, Vol. 333, No. 1, 2004, pp. 22-27. doi:10.1016/j.jnoncrysol.2003.09.051 [27] M. Engholm and L. Norin, “Comment on ‘Photo Dark- ening in Yb-Doped Aluminosilicate Fibers Induced by 488 nm Irradiation’,” Optics Letters, Vol. 33, No. 11, 2008, pp. 1216-1218. doi:10.1364/OL.33.001216 [28] S. Yoo, C. Basu, A. J. Boyland, C. Sones, J. Nilsson, J. K. Sahu and D. Payne, “Reply to Comment on ‘Photodark- ening in Yb-Doped Aluminosilicate Fibers Induced by 488 nm Irradiation’,” Optics Letters, Vol. 33, No. 11, 2008, pp. 1217-1218. doi:10.1364/OL.33.001217 [29] H. J. Schugar, E. I. Solomon, W. L. Cleveland and L. Goodman, “Simultaneous Pair Electronic Transitions in Yb2O3,” Journal of American chemical Society, Vol. 97, No. 22, 1975, pp. 6442-6450. doi:10.1021/ja00855a024 [30] F. Auzel and P. Goldner, “Towards Rare-Earth Clustering Control in Doped Glasses,” Optical Materials, Vol. 16, No. 11, 2001, pp. 93-103. doi:10.1016/S0925-3467(00)00064-1 [31] A. Lupei and V. Lupei, “RE3+ Pairs in Garnets and Ses- quioxides,” Optical Materials, Vol. 24, No. 1-2, 2003, pp. 181-189. doi:10.1016/S0925-3467(03)00123-X [32] M. A. Noginov, G. B. Loutts, C. S. Steward, B. D. Lucas, D. Fider, V. Peters, E. Mix and G. Huber, “Spectroscopic Study of Yb Doped Oxide Crystals for Intrinsic Optical Bistability,” Journal of Luminiscence, Vol. 96, No. 2-4, 2002, pp. 129-140. doi:10.1016/S0022-2313(01)00210-1 [33] B. Morasse, S. Chatigny, E. Gagnon, C. Hovington, J.-P. Martin and J.-P. de Sandro, “Low Photodarkening Single Cladding Ytterbium Fibre Amplifier,” Fiber Lasers IV: Technology, Systems, and Applications, Proceedings of SPIE, San Jose, Vol. 6453, 26 January 2009, paper 64530H, pp. 1-8. doi:10.1117/12.700529 [34] R. Peretti, A.-M. Jurdyc, B. Jacquier, C. Gonnet, A. Pas- touret, E. Burov and O. Cavani, “How do Traces of Thu- lium can Explain Photodarkening in Yb-Doped Fibers?,” Optics Express, Vol. 18, No. 19, 2010, pp. 20455-20460. doi:10.1364/OE.18.020455 [35] S. Jetschke, M. Leich, S. Unger, A. Schwuchow and J. Kirchhof, “Influence of Tm- or Er-Codoping on the Photodarkening Kinetics in Yb Fibers,” Optics Express, Vol. 19, No. 15, 2011, pp. 14473-14478. doi:10.1364/OE.19.014473 [36] R. Paschotta, J. Nilsson, P. R. Barber, J. E. Caplen, A. C. Tropper and D. C. Hanna, “Lifetime Quenching in Yb- Doped Fibres,” Optics Communications, Vol. 136, No. 5- 6, 1997, pp. 375-378. doi:10.1016/S0030-4018(96)00720-1 [37] A. Iho, M. Soderlund, J. J. Montiel i Ponsoda, J. Koponen and S. Honkanen, “Modeling Inversion in an Ytter- bium-Doped Fiber,” Optical Components and Materials VI, Proceedings of SPIE, San Jose, 26 January 2009, pa- per 721209, pp. 1-8. [38] M. P. Hehlen, N. J. Cockroft, T. R. Gosnell and A. J. Bruce, “Spectroscopic Properties of Er and Yb -Doped Soda-Lime Silicate and Aluminosilicate Glasses,” Physi- cal Review, Vol. 56, No. 15, 1997, pp. 9302-9318. doi:10.1103/PhysRevB.56.9302 [39] V. Peters, “Growth and spectroscopy of Ytterbium-doped sesquioxides,” PhD dissertation, Hamburg, 2001. [40] P. Barua, E. H. Sekiya, K. Saito and A. J. Ikushima, “In- fluences of Yb3+ Concentration on the Spectroscopic Pro- perties of Silica Glass,” Journal of Non-Crystalline Solids, Vol. 354, No. 42-44, 2008, pp. 4760-4764. doi:10.1016/j.jnoncrysol.2008.04.020 [41] F. Auzel, “A Fundamental Self-Generated Quenching Center for Lanthanide-Doped High-Purity Solids,” Jour- nal of Luminiscence, Vol. 100, No. 1-4, 2002, pp. 125- 130. doi:10.1016/S0022-2313(02)00457-X [42] F. Auzel, “Upconversion and Anti-Stokes Processes with f and d Ions in Solids,” Chemicals Review, Vol. 104, No. 1, 2004, pp. 139-173. doi:10.1021/cr020357g [43] M. Leich, F. Just, A. Langner, M. Such, G. Schotz, T. Eschrich and S. Grimm, “Highly Efficient Yb-Doped Si- lica Fibers Prepared by Powder Sinter Technology,” Op- tics Letters, Vol. 36, No. 9, 2011, pp. 1557-1559. doi:10.1364/OL.36.001557
|