 Vol.1, No.3, 143-153 (2011) doi:10.4236/ojpm.2011.13019 C opyright © 2011 SciRes. Openly accessible at http://www.scirp.org/journal/OJPM/ Open Journal of Preventive Medicine Perception and prevalence of behavioral risk factors: the lifestyle risk scale (LRS)* Beatrix Algurén1,2#, Rolf Weitkunat3,4 1School of Health Sciences, Jönköping University, Jönköping, Sweden; 2Institute for Health and Rehabilitation Sciences (IHRS), Ludwig-Maximilians-University, Munich, Germany; #Corresponding Author: beatrix.alguren@hhj.hj.se 3Institute for Medical Informatics, Biometry and Epidemiology, University of Munich, Munich, Germany (during the study period); 4R&D Fellow, Philip Morris Products SA, Neuchâtel, Switzerland (current affiliation). Received 29 August 2011; revised 23 September 2011; accepted 21 October 2011. ABSTRACT Objective: To de v e lop a life style risk scale (L RS ) of health-related behaviors based on risk as- sessments of study participants. Method: By means of pairwise comparisons of assessed risks associated with tobacco, alcohol, obesity, fast-food, physical inactivity, and lack of sleep, each at four lev els, 24 behav iors were ranked on a unidimensional risk scale. Results: Overall, use of tobacco was assigned the highest risk score (3.7), consumption of fast-food and lack of sleep the lowest (1.7, 1.6). Minor risk factors (lack of sleep and fast-food) were, at their highest levels, assigned similar risk values as major risk factors (tobacco, alcohol, obesity) at their lowest levels. Lifestyles of female partici- pants were less hazardous than those of male participants, as measured with the LRS. In con- trast, perception of behavioral health risks was more precise in men. Conclusions: The LRS provides a practical quantification to identify and compare groups with different risk behavior patterns as well as clusters of risky health be- haviors in and across populations. It can also support the communication of behavi oral health risks. Keywords: Health Behavior; Lifestyle Score; Risk Communication; Risk Perception 1. INTRODUCTION It is generally accepted that in Western populations chronic diseases are largely due to unhealthy lifestyles [1,2]. In addition, health-related behaviors affect a va- riety of acute illness conditions [3]. The need for moni- toring and promoting healthy lifestyles arises as being probably the major public health challenge to decrease the burden of non-communicable diseases [2-4]. One of the problems related to lifestyle-prevention is the causal and structural complexity of lifestyles. A more general problem in health-education is that epidemiologic risk measures are not easily understood by most addressees [5,6]. To address unhealthy lifestyles effectively, it ap- pears that four aspects need to be considered: 1) an association of the target risk behaviors with negative health outcomes must have been verified, 2) risk groups and clusters of risk factors have to have been identified, 3) successful procedures must be developed to address the target groups effectively, and 4) effectiveness of interventions must be rigorously evaluated. Step one has been achieved generally for several risk factors [7-16]. To succeed with step two, several scores have been developed [17-20], the chronic disease risk index (CDRI) [17] and the Lifestyle Index (LI) [18] are two examples. Diet, physical activity, smoking, and alcohol consump- tion are considered in both instruments. The CDRI addi- tionally includes the body mass index (BMI). In these studies, behavioral risk factors were assigned scores relative to their epidemiological risks. The CDRI scoring system helped to identify different populations at dif- ferent levels of risk in a multiethnic cohort [17]. In a cross national comparison between China and the United States similarities of lifestyle patterns but also different unhealthy behaviors were identified with the Lifestyle Index [18]. Both indices seem to solve the problem of identifying and comparing high risk groups. On the other hand, neither directly allows for comparing risks across different behaviors and behavior patterns. Consequently, neither supports evaluating interventions with multidi- mensional behavioral effects, since so far it is not possi- ble to assess changes in health risks associated with *The opinions and conclusions of the researchers are their own and do not necessarily reflect Philip Morris International, Inc.’s position.  B. Algurén et al. / Open Journal of Preventive Medicine 1 (2011) 143-153 Copyright © 2011 SciRes. Openly accessible at http://www.scirp.org/journal/OJPM/ 144 complex changes in health risk behavior patterns. It would therefore be desirable to have a unidimensional risk scale available for combinations of health-related beha- viors, which could also support communicating lifestyle risks in an easily understandable way [6]. The lack of such an instrument was the motivation to develop a unidimensional risk scale for ranking beha- vioral risks according to their health impact. In the ab- sence of comprehensive epidemiological data on the health impacts of multiple behavioral risk factors, that would allow a direct analysis of risks, the underlying quantification can only be based on subjective knowl- edge represented in a sample of individuals. In the pre- sent study, based on pair-wise comparisons, six behave- ioral risks were ranked on a lifestyle risk scale, reflecting subjective risk perceptions using a multidimensional scaling method [21]. The development of the Lifestyle Risk Scale (LRS) is descrybed, as well as the risks of the study population, based on applying the scale to the re- ported actual behaviors. 2. METHODS 2.1. Design This cross-sectional survey sampled primarily health experts from public health schools in Germany and staff from the Munich university hospital. No random sample could be drawn since a population-representative list of potential participants with information on professions was not available. Initially, 713 questionnaires were e- mailed with the request to reply anonymously and to possibly forward the questionnaire on to others. Recruit- ment of the targeted convenience sample was ongoing from May to August 2004. The sample size was deter- mined by the available number of addresses of health ex- perts. 2.2. Measurements The self-administered questionnaire covered three ar- eas: sociodemographic and anthropometric variables (sex, age, weight, height, citizenship, professional train- ing, current occupation, partnership, children), individ- ual health related behaviors (smoking, alcohol consump- tion, physical activity, fast food consumption, duration of sleep) using four ordinal response categories, and the appraisal of 24 pairs of lifestyle risk factors. The latter were defined considering the guidelines for reducing chronic diseases [2], and study participants were asked about their risk assessment regarding tobacco and alco- hol consumption, obesity, daily physical activity, weekly fast food consumption and sleeping hours, each dimen- sion divided into four increasing degrees of risk. The 24 intensities (or levels of manifestation) of the six con- sidered behavior related risk dimensions are shown in Table 3 Each of the 24 manifestations was to be com- pared with each other by participants indicating in each pairwise comparison which specific health-related be- havior they considered more dangerous. The instruction was to imagine an 18-year-old man, sticking to either behavior to be assessed for the rest of his life. Due to the large number of 240 not permuted pairs of risk behavior manifestation comparisons (276 possible minus six triv- ial intra-dimension comparisons for each of the six be- havior-related risk dimensions), ten different question- naires were used, each containing a randomly selected fixed set of 24 comparisons. Prior to the main study the questionnaires were answered by 39 public health stu- dents and no difficulties were reported during this pre- test. 2.3. Statistical Analyses All measured and derived sociodemographic, anth- ropometric, and health behavior variables were des- cribed according to their measurement scale by absolute and relative frequencies or by mean ±standard deviation as well as median and 25th and 75th percentiles. The BMI (weight (kg)/height (m2)) was derived and BMI under 18.5 indicated underweight, BMI between 18.5 and 25 normal weight, BMI between 25 and 30 overweight, and BMI above 30 obesity (WHO 1998). LRS item scores were estimated using the Bradley-Terry- Luce (BTL) model for paired comparisons of ranked stimuli [22]. The model is based on the assumption that the probability of choosing an alternative is proportional to the “utility” of this alternative in terms of its health risk impact [23]. It is assumed that the utility of a specific item is linked to the response probability by a logistic function. The regression parameters were derived from fitting logistic models without offset to the data obtained in the study. By subtracting the smallest re- gression parameter from each of the 24 regression parameters [21], a rational scale with a minimum value of zero was obtained. The lifestyle risk scale was derived using the SAS program provided in [24]. In addition to analyzing the total sample, separate models were fitted to the data obtained from health professionals and laymen. For every participant, an individual risk score cor- responding to his or her actual lifestyle was calculated by using the parameter estimates derived with the BTL scoring of the total sample data. In addition, individual risk perception scores based on individual appraisals of life-styles were determined for each participant. This was done accounting for the fact that the 240 com- parisons were distributed to ten versions of the question- naire. In the first step, each risk specification as assessed by each participant was quantified using the final LRS  B. Algurén et al. / Open Journal of Preventive Medicine 1 (2011) 143-153 Copyright © 2011 SciRes. Openly accessible at http://www.scirp.org/journal/OJMP/ 145 parameters. Then the sum of the 24 values of each par- ticipant was subtracted from the maximal value which was possible with the specific version of the question- naire. Finally, to warrant comparability across the ten versions of the questionnaire, the score was divided by the range of risk appraisals possible with the specific questionnaire version. For convenience, the score was finally multiplied by 100. Higher values represent larger deviations of the group estimates, i.e. poorer risk perception in terms of underestimation of risk. The assumption of homogeneity of the assessments of the study participants regarding their comparisons of pairs of risk behaviors was analyzed by an adaptation of Cochran’s Q-test [23], based on calculating the ratio of inter-item and inter-individual variability. To assess the split-half reliability of the scale, Cronbach’s alpha (coef- ficient of reliability) was calculated [25], considering a value of 0.9 or above as being indicative of high reliabil- ity [26]. U-tests were performed to investigate differ- ences in sex and partnership status as well as differences between subgroups of age, professional training, and current occupation with respect to risk scores and risk perception scores. Spearman rank correlation coeffi- cients (rsp) were used to correlate risk scores with age as well as with risk perception scores. All tests were per- formed two-sided at local alpha levels of 5 percent without adjustment for multiplicity. All statistical analy- ses were carried out with SAS (Statistical Analysis Sys- tem, Version 8.2). 3. RESULTS 3.1. Demographic and Lifestyle Characteristics As expected, the number of returned questionnaires was different for each of the ten versions. To obtain an equal distribution, 32 returned questionnaires of each of the ten versions were randomly retained. Therefore, only 320 of the 434 returned questionnaires (64 question- naires were undeliverable because of wrong emailad- dresses) were used for further analyses, 43 percent of which were from health professionals. The analyses included 202 women with an average age of 33.3 ± 8.2 years and an average BMI of 21.6 ± 2.2 kg/m2. The 116 men were 33.2 ± 9.0 years old and had an average BMI of 24.2 ± 2.8 kg/m2. Two partici- pants did not report their sex. Most participants lived in Germany (77%) and did not lead risky lifestyles: 85 percent were non-smokers, 83 percent had normal weight, 71 percent drank less than one drink per day and 69 percent ate fast food less than once a week. Sample characteristics and lifestyle variables are described in Table 1 and Table 2, respectively. 3.2. Assessment of Risk Behaviors The assessments of risk behaviors were homogeneous in the sample (p < 0.001). Table 3 contains the LRS scores based on the pairwise assessments of the 24 risk behavior manifestations. The reported results refer to models based on the total sample data set, as well as on data obtained from laymen and from health profes- sionals. The values range from 0 (‘sleep less than six hours once a week’) to 4.8 (‘four drinks per day’). On average, smoking was perceived as the most risky behavior (3.7), followed by alcohol consumption (3.1) and obesity (3.0). Lack of sleep and fast-food consumption were assessed as being less risky (1.7 and 1.6). The assessed health risk of physical inactivity was 57 percent of that of smoking (2.1 vs. 3.7). Less major risks such as lack of sleep and fast-food consumption were at higher levels of mani- festation assigned similar risk scores as the major risks of smoking, alcohol and obesity at lower levels. For instance, “fast-food four times per week” scored 2.8, a similar value to that obtained for “two drinks per day” (2.7) or “five cigarettes per day” (2.6). “Daily sleep under six hours four times per week” scored as even riskier (3.2). Figure 1 contains the unidimensional LRS scores based on the total sample analysis. As can be seen, in order to apply the scale, only information related to the considered health-behaviors is required at sufficient granularity, whereas there is no need for using a particular questionnaire. This has the advantage that data collected with different instruments can be analyzed using the LRS scoring, given the required information is available. An individual lifestyle risk index can be determined by adding up the values corresponding to an individual’s health-behaviors and levels of manifestation. To evaluate the reliability of the scores, the two scales were compared which were derived separately for the assessments made by health professionals (participants with professional medical or public health background, N = 136) and laymen (participants with neither profes- sional medical, public health, sociological/pedagogical, psychological, biological, nor pharmacological back- ground, N = 129). To warrant some homogeneity of the two assessment populations, participants which did not fall in one of these two subgroups were not considered in the reliability analysis. The two scales were found to correlate strongly (Cronbach’s Alpha = 0.98, p < 0.0001). For almost all specific risk behaviors, scores were higher in the assessments of health professionals than in those of laymen. Overall, the highest scores were obtained for obacco, the lowest for fast food consumption. t  B. Algurén et al. / Open Journal of Preventive Medicine 1 (2011) 143-153 Copyright © 2011 SciRes. http://www.scirp.org/journal/OJPM/Openly accessible at 146 Table 1. Characteristics of the sample. Women (N = 202) Men (N = 116) Total (N = 320) Va riab l e No. % No. % No. % Age [years] 20 - 29 30 - 39 40 - 49 50 - 59 60 + no answer 59 67 22 7 1 46 29.2 33.2 10.9 3.5 0.5 22.8 45 29 14 3 2 23 38.8 25.0 12.1 2.6 1.7 19.8 104 96 36 10 3 71 32.5 30.0 11.3 3.1 0.9 22.2 Weight underweight normal weight overweight adiposity no answer 9 175 17 0 1 4.5 86.6 8.4 0 0.5 1 76 33 6 0 0.9 65.5 28.5 5.2 0 10 253 50 6 1 3.1 79.1 15.6 1.9 0.3 Partnership alone with partner 67 135 33.2 66.8 38 78 32.8 67.3 107 213 33.4 66.6 Children yes no no answer 49 153 0 24.3 75.7 0 30 85 1 25.9 73.3 0.9 79 240 1 24.7 75.0 0.3 Citizenship Germany Switzerland Austria other 157 29 5 11 77.7 14.4 2.5 5.5 89 22 2 3 76.7 19.0 1.7 2.6 247 52 7 14 77.2 16.3 2.2 4.4 Professional training Medicine Public health Sociology/Pedagogy Psychology Biology Pharmacy other no answer 23 76 13 14 8 3 63 2 11.4 37.6 6.4 6.9 4.0 1.5 31.2 1.0 15 20 6 4 1 2 66 2 13.0 17.2 5.2 3.5 0.9 1.7 56.9 1.7 38 98 19 18 9 5 129 4 11.9 30.6 5.9 5.6 2.8 1.6 40.3 1.3 Current occupation self-employed company-employed civil servant unemployed student other no answer 16 123 5 5 46 6 1 7.9 60.9 2.5 2.5 22.8 3.0 0.5 18 67 4 3 19 5 0 15.5 57.8 3.5 2.6 16.4 4.3 0 34 191 9 9 65 11 1 10.6 59.7 2.8 2.8 20.3 3.4 0.3 3.3. Lifestyle Risk Scores and Risk Perception Scores in the Study Population The risk scores according to actual health-related be- haviors of the study participants are shown in Table 4, stratified by sex, age, professional training, occupation and partnership. The observed risk scores in the sample ranged from 0 to 12.5, the median being 2.2. Men scored higher (2.9) than women (1.5, p < 0.001), singles higher (2.6) than non-singles (1.5, p < 0.013), self-employed participants higher (2.5) than students (1.5, p < 0.083), and parti- cipants with a medical background scored higher (2.7) than participants without a health-professional back- ground (2.0, p < 0.078). Table 5 contains the risk perception scores, stratified by sex, age, professional training, occupation, partner- ship, and by their risk behaviors. Higher values denote more pronounced underestimation of the health risks relative to the assessment of the total sample. The scores ranged from 0 to 29.4, the median was 4.0. The risk perception score correlated slightly negatively with age (rsp = –0.15, p < 0.05). Risk perception in men (3.7) was more accurate than in women (4.1, p < 0.91), more accurate in participants with medical background (3.2) than in those with no health professional background (4.2, p < 0.071), and more accurate in students (4.4) than 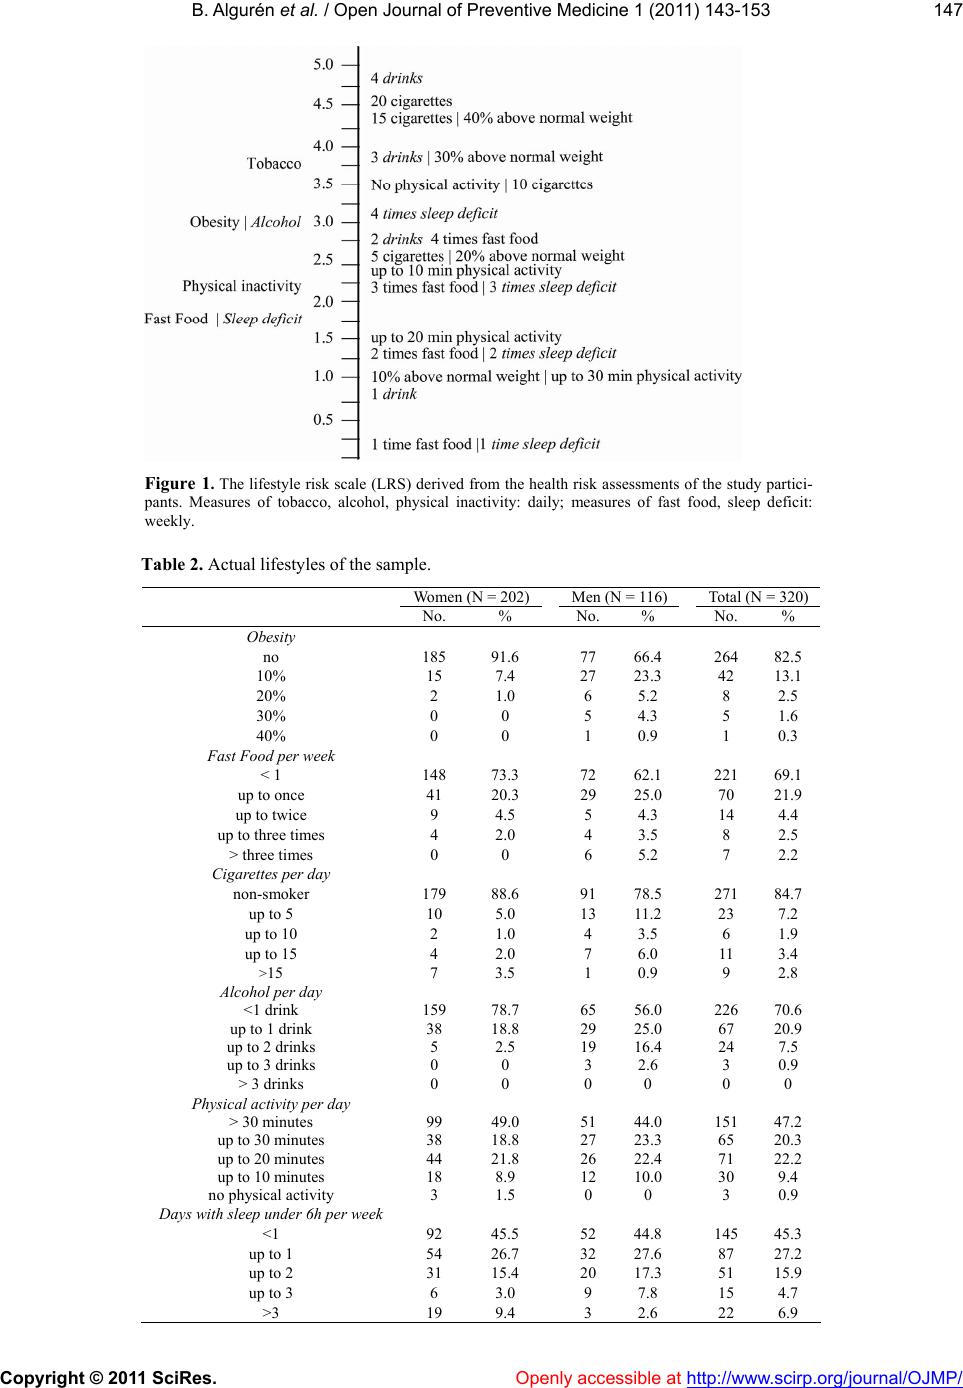 B. Algurén et al. / Open Journal of Preventive Medicine 1 (2011) 143-153 Copyright © 2011 SciRes. Openly accessible at http://www.scirp.org/journal/OJMP/ 147 Figure 1. The lifestyle risk scale (LRS) derived from the health risk assessments of the study partici- pants. Measures of tobacco, alcohol, physical inactivity: daily; measures of fast food, sleep deficit: weekly. Table 2. Actual lifestyles of the sample. Women (N = 202)Men (N = 116)Total (N = 320) No. % No. % No. % Obesity no 185 91.6 77 66.4 264 82.5 10% 15 7.4 27 23.3 42 13.1 20% 2 1.0 6 5.2 8 2.5 30% 0 0 5 4.3 5 1.6 40% 0 0 1 0.9 1 0.3 Fast Food per week < 1 148 73.3 72 62.1 221 69.1 up to once 41 20.3 29 25.0 70 21.9 up to twice 9 4.5 5 4.3 14 4.4 up to three times 4 2.0 4 3.5 8 2.5 > three times 0 0 6 5.2 7 2.2 Cigarettes per day non-smoker 179 88.6 91 78.5 271 84.7 up to 5 10 5.0 13 11.2 23 7.2 up to 10 2 1.0 4 3.5 6 1.9 up to 15 4 2.0 7 6.0 11 3.4 >15 7 3.5 1 0.9 9 2.8 Alcohol per day <1 drink 159 78.7 65 56.0 226 70.6 up to 1 drink 38 18.8 29 25.0 67 20.9 up to 2 drinks 5 2.5 19 16.4 24 7.5 up to 3 drinks 0 0 3 2.6 3 0.9 > 3 drinks 0 0 0 0 0 0 Physical activity per day > 30 minutes 99 49.0 51 44.0 151 47.2 up to 30 minutes 38 18.8 27 23.3 65 20.3 up to 20 minutes 44 21.8 26 22.4 71 22.2 up to 10 minutes 18 8.9 12 10.0 30 9.4 no physical activity 3 1.5 0 0 3 0.9 Days with sleep under 6h per week <1 92 45.5 52 44.8 145 45.3 up to 1 54 26.7 32 27.6 87 27.2 up to 2 31 15.4 20 17.3 51 15.9 up to 3 6 3.0 9 7.8 15 4.7 >3 19 9.4 3 2.6 22 6.9  B. Algurén et al. / Open Journal of Preventive Medicine 1 (2011) 143-153 Copyright © 2011 SciRes. Openly accessible at http://www.scirp.org/journal/OJPM/ 148 Table 3. LRS scores derived by the BTL-model in the total sample, in health experts, and in laymen (separate models). Health professionals (N = 136) Laymen (N = 129) Total (N = 320) Risk factor Score Score Score Obesity Mean 4.2 Mean 3.6 Mean 3.0 10% above normal weight 20% above normal weight 30% above normal weight 40% above normal weight –2.9257 –0.2255 0.9285 1.7184 1.4 4.1 5.3 6.1 –2.5611 –1.1138 0.7983 1.1689 1.5 3.0 4.9 5.2 –2.1593 –0.5908 0.71 1.2238 1.0 2.6 3.9 4.4 Fast Food (e.g., hamburger, hot dogs, pizzas, french fries, currywurst) Mean 2.3 Mean 2.1 Mean 1.6 Once a week Twice a week Three times a week Four times a week –4.3664 –2.3563 –1.1345 –0.2205 0 2.0 3.2 4.1 –3.6121 –2.3964 –1.3054 –0.6798 0.5 1.7 2.8 3.4 –3.1223 –1.9093 –0.9146 –0.4349 0.1 1.3 2.3 2.8 Tobacco Mean 5.3 Mean 4.5 Mean 3.7 Up to 5 cigarettes a day Up to 10 cigarettes a day Up to 15 cigarettes a day Up to 20 cigarettes a day –0.6156 0.6778 1.571 2.0311 3.8 5.0 5.9 6.4 –0.8145 –0.0106 1.3056 1.0855 3.3 4.1 5.4 5.2 –0.6357 0.308 1.2042 1.3025 2.6 3.5 4.4 4.5 Alcohol (Definition “drink”: 0.25 l wine or 0.5 l beer or one little glass of liquor) Mean 4.4 Mean 3.6 Mean 3.1 1 drink a day 2 drinks a day 3 drinks a day 4 drinks a day –3.2276 –0.594 1.3141 2.4534 1.1 3.8 5.7 6.8 –2.8617 –0.8962 0.4244 1.4899 1.2 3.2 4.5 5.6 –2.3394 –0.4649 0.7275 1.6203 0.9 2.7 3.9 4.8 Physical inactivity Mean 3.2 Mean 2.4 Mean 2.1 Maximal 30 min a day Maximal 20 min a day Maximal 10 min a day None a day –2.8638 –1.6235 –0.8944 0.7417 1.5 2.7 3.5 5.1 –3.0063 –2.4243 –1.1975 –0.0837 1.1 1.7 2.9 4.0 –2.1958 –1.748 –0.8167 0.3006 1.0 1.5 2.4 3.5 Lack of sleep (“Sleeping less than six hours a day”) Mean 2.4 Mean 2.2 Mean 1.7 Once a week Twice a week Three times a week Four times a week –4.0309 –2.8267 –0.944 0 0.3 1.5 3.4 4.4 –4.0741 –2.4233 –1.1113 0 0 1.7 3.0 4. 1 –3.2046 –1.9859 –0.8788 0 0 1.2 2.3 3.2 in self-employed participants (5.2, p < 0.078). When the distribution of the risk perception score was examined across body weight strata as well as across tobacco and alcohol consumption patterns, no substantial associations were apparent. There was virtually no correlation be- tween actual behavior-based scores on the one hand and risk perception scores on the other (rsp = 0.02, p < 0.72). 4. DISCUSSION A lifestyle risk scale (LRS) was developed, based on pairwise comparisons of health-risks of specific health- related behaviors, using the BTL model. Lifestyles were treated as objects with specific manifestations of risk behaviors as their attributes. For a realistic evaluation of the attributes, the measures had to be easy to com- prehend and overloading study participants with too many pairwise comparisons [22] had to be avoided. Consequently, the 240 pairwise comparisons were ran- domly distributed to ten questionnaires, each comprising 24 pairwise comparisons. Six health-related behavior in- dicators, each of which had four ordinal levels of mani- festation, were to be assessed. In addition to LRS scores, risk scores corresponding to actual individual behaviors as well as to individual LRS risk perception scores were determined for each participant. Among the six risk categories to be assessed, para- mount importance was assigned to smoking as well as to obesity. This is in agreement with epidemiological find- ings [2,27-30]. The LRS scores thus appear to allow for a fine-grained unidimensional ranking of perceived as well as of actual risk, not only of dimensions of risk be- haviors, but also of specific intensity levels at which these behaviors are performed. The finding, for example, that ‘one drink per day’ was perceived as less risky than ‘phy- sical activity not longer than 30 minutes a day’ seems to reflect the available evidence on health benefits of mode- rate red wine consumption [4,31-33] and also the recom- mendation of daily moderate physical activity with a minimum of 30 minutes [2]. The findings of the study further indicate that with regar to subjective risk percep- d  B. Algurén et al. / Open Journal of Preventive Medicine 1 (2011) 143-153 Copyright © 2011 SciRes. Openly accessible at http://www.scirp.org/journal/OJMP/ 149 Table 4. Lifestyle risk scores of the sample based on applying the LRS on actual behaviors. Women (N=202) Men (N=116) Total (N=320) Va riables 25th percentile Median 75th percentile Mean 25th percentile Median 75th percentile Mean 25th percentile Median 75th percentile Mean total 1.0 1.5 3.3 2.21.1 2.9 5.1 3.71.0 2.2 4.0 2.7 Age years 20 - 29 30 - 39 40 - 49 50 - 59 60 + no answer 0.9 0.1 1.2 1.1 2.6 1.0 1.5 1.2 1.4 3.7 2.6 1.7 3.2 3.2 2.7 4.8 2.6 3.3 2.1 2.2 2.1 3.7 2.6 2.1 1.2 0.9 1.0 0 0 2.1 2.9 2.4 2.2 3.4 1.4 4.3 5.0 4.7 5.5 6.8 2.8 7.3 3.4 3.3 3.3 3.4 1.4 5.0 0.9 0.9 1.5 1.5 0 1.0 2.1 1.5 1.7 3.5 2.6 2.4 4.2 3.5 3.6 4.8 2.8 4.1 2.7 2.5 2.6 3.6 1.8 3.1 Professional training Medicine Psychology Sociology/Pedagogy Public health others 0.1 1.0 1.0 0.9 1.0 2.4 1.7 1.3 1.5 1.5 4.3 3.5 1.5 3.3 2.9 2.9 2.3 1.6 2.2 2.1 2.5 0.6 1.0 1.5 1.0 3.4 2.4 2.8 3.9 2.3 5.1 5.0 3.7 6.2 5.0 4.0 2.8 3.8 4.1 3.4 1.5 1.0 1.0 1.0 1.0 2.7 1.5 1.5 2.3 2.0 4.7 3.7 2.5 4.2 3.5 3.3 2.3 2.3 2.6 2.7 Current occupation self-employed company-employed student 0.9 1.0 0.9 1.2 1.9 1.5 2.5 3.5 2.7 1.8 2.4 2.0 2.4 1.1 0 4.6 2.5 2.9 8.3 5.1 5.0 5.4 3.4 3.2 1.1 1.0 0.9 2.5 2.3 1.5 5.0 4.1 3.6 3.7 2.8 2.4 Partnership single with partner 1.0 0.9 2.4 1.5 3.5 2.9 2.6 2.0 2.0 1.0 3.3 2.6 6.7 4.7 4.5 3.2 1.1 1.0 2.6 1.5 5.0 3.6 3.3 2.5 tion, minor risk behaviors such as lack of sleep and fast-food consumption might, if performed excessively, reach the same levels as smoking or drinking. It should be noted that, in addition to being in line with epide- miologic risk assessment, individual risk perception scores possibly allow for gauging deviations from group level perception scores and may thereby have diagnostic potential in terms of indicating individual-level miscon- ceptions or information gaps regarding certain beha- vioral risks. The LRS appears to have a very high split-half re- liability and was not found to depend substantially on professional background, i.e., on whether the scoring was based on assessments of health-experts or on assess- ments of laymen. While the group-specific pairwise asses- sments did not change the ordinal sequence of specific risk behaviors, the scores were somewhat different: Tobacco use, obesity, alcohol consumption, and physical inactivity were perceived to be about 15 percent more risky when assessed by health experts as compared to laymen. Obviously, the risk values cannot (and are not in- tended to) substitute for clinical and epidemiological risk quantifications. However, as the ranking of behavioral risk factors is consistent with epidemiologic risk as- sessment, the scale appears to be useful to identify high- risk groups and clusters of risk behaviors. As the LRS estimates individual lifestyle risks without requiring clinical measurements or detailed interviews, it might be useful in epidemiologic as well as in prevention studies, where fine-grained individual-level assessments of beha- vioral risk factors might be impractical. An essential benefit of the LRS is its ability to rank health risks of different behavioral domains on a com- mon scale. Because obesity is a result of lifestyle and not a risk behavior itself, and since the association between lack of sleep and diseases is inconsistent [34-37], the scale was, in an additional exploratory analysis, adjusted by excluding these dimensions. The scale for the remain- ing behavioral risk factors did not differ from the original scale using all available assessments. From this it might be concluded that other behavioral risk factors could be added to the scale in the future. In addition to the aspect of making highly different behavioral risks comparable, the LRS allows for com- paring different populations as well as different sub- groups. This opens a wide field of possible applications, for example targeting groups for the specification or evaluation of behavioral intervention programs. Although information on behavioral risks can be and has often been given in an objective way by providing epide- miologic findings, the LRS does so at a different level: It  B. Algurén et al. / Open Journal of Preventive Medicine 1 (2011) 143-153 Copyright © 2011 SciRes. Openly accessible at http://www.scirp.org/journal/OJPM/ 150 Table 5. Risk perception scores of the sample. Women (N=202) Men (N=116) Total (N=320) Va riables 25th percentileMedian 75th percentile Mean 25th percentile Median75th percentileMean 25th percentile Median 75th percentile Mean total 2.1 4.1 6.6 4.81.8 3.7 7.7 5.22.0 4.0 7.1 4.9 Age years 20 - 29 2.8 4.7 7.1 5.62.8 4.6 8.0 6.42.8 4.6 7.7 6.0 30 - 39 2.0 3.4 6.0 4.20.6 4.2 9.5 5.71.8 3.5 6.7 4.6 40 - 49 0.9 3.2 8.0 4.61.4 3.2 4.3 3.41.1 3.2 6.3 4.1 50 - 59 2.1 3.2 9.4 6.21.7 2.2 2.4 2.12.1 3.8 7.9 5.0 60+ 7.6 5.7 7.6 6.20 1.4 2.7 1.40 2.7 7.6 3.4 no answer 1.9 7.6 5.8 4.30.9 2.4 7.6 4.21.0 3.9 6.9 4.2 Professional training Medicine 1.8 3.3 6.2 4.01.0 3.1 6.9 3.71.7 3.2 6.4 3.9 Psychology 3.6 5.1 8.3 5.92.1 5.3 9.6 5.83.6 5.2 8.3 6.3 Sociology/Pedagogy 2.1 3.5 6.1 3.84.5 7.9 9.8 9.32.8 4.5 7.1 5.5 Public health 1.2 3.9 5.4 4.50.4 2.2 7.1 3.70.9 3.9 5.8 4.4 other 2.5 4.4 7.6 5.32.3 3.6 7.7 5.72.4 4.2 7.6 5.5 Current occupation self-employed 3.6 5.2 8.7 6.12.8 6.0 8.6 7.03.1 5.2 8.6 6.6 company-employed 1.9 3.8 6.3 4.71.7 3.6 7.4 5.11.9 3.7 6.6 4.9 student 1.9 4.6 6.9 4.62.1 3.6 7.7 4.52.1 4.4 6.9 4.6 Partnership single 2.0 4.2 7.1 4.72.4 3.9 7.7 5.32.1 4.2 7.6 4.9 with partner 2.5 4.0 6.3 4.81.7 3.6 7.6 5.21.9 3.9 6.6 4.9 Weight underweight 1.8 6.9 7.2 5.14.6 4.6 4.6 4.61.8 5.8 7.2 5.1 normal weight 2.5 4.1 6.3 4.72.0 3.5 7.4 4 2.1 3.9 6.5 4.8 overweight 1.9 4.2 7.6 5.41.0 4.2 7.7 5.71.6 4.2 7.7 5.6 adiposity - - - - 3.9 5.8 9.5 7.23.9 5.8 9.5 7.2 Fast Food per week <1 2.0 4.1 6.6 4.82.2 4.1 8.3 5.82.0 4.1 7.3 5.1 up to once 2.7 3.9 6.3 4.71.4 2.8 5.8 4.72.1 3.7 6.1 4.7 up to twice 1.0 4.2 7.1 4.00.0 0.5 1.8 0.80.2 1.9 5.6 2.9 up to three times 1.2 4.6 8.3 4.72.5 5.5 8.5 5.52.5 4.6 8.5 5.1 >three times - - - - 1.6 5.1 7.9 4.82.1 7.4 7.7 5.1 Cigarettes per day Non-smoker 2.1 4.2 6.6 4.81.6 3.2 7.4 4.61.9 3.9 6.9 4.7 Up to 5 2.1 3.9 4.6 3.63.5 5.9 8.6 7.22.5 4.6 8.0 5.6 Up to 10 0 8.0 15.9 8.03.7 7.4 8.5 6.10 7.4 9.5 6.7 Up to 15 1.4 3.1 6.3 3.93.5 9.0 11.0 9.92.8 4.0 10.1 7.7 >15 2.8 4.4 8.0 6.02.1 2.1 2.1 2.12.1 3.9 4.8 4.9 Alcohol per day <1 drink 2.1 4.2 6.7 4.81.8 4.0 7.7 5.42.1 4.1 7.3 5.0 Up to 1 drink 1.9 3.8 5.7 4.32.1 3.2 6.0 4.61.9 3.7 6.0 4.4 Up to 2 drinks 2.8 2.8 9.4 5.61.6 3.6 8.6 6.11.9 3.5 7.3 6.0 Up to 3 drinks - - - - 0 0 7.5 2.56.0 0 6.0 2.5 Physical activity per day >30 minutes 2.1 4.2 6.4 4.82.3 4.1 7.9 5.82.2 4.1 7.1 5.2 up to 30 minutes 2.7 4.1 6.3 4.90.9 3.2 7.4 3.81.4 3.7 6.5 4.4 up to 20 minutes 1.2 4.0 5.7 4.10.8 2.6 7.5 4.40.9 3.1 6.1 4.2 up to 10 minutes 2.6 3.8 9.3 5.82.6 4.8 10.2 7.62.8 4.0 10.2 6.5 no physical activity 2.1 7.8 8.1 6.1- - - - 2.1 7.8 8.1 6.1 Days with sleep under 6h per week <1 2.0 4.4 6.9 5.11.7 2.8 8.6 5.51.8 4.2 7.6 5.2 up to 1 1.8 3.5 6.7 4.21.2 3.9 7.6 5.12.0 3.7 6.8 4.6 up to 2 2.1 4.1 6.2 5.02.4 3.6 7.1 4.42.2 4.1 6.4 4.7 up to 3 0.0 2.8 4.2 2.40.4 3.8 6.6 4.20.0 2.8 5.1 3.5 >3 2.4 4.6 7.3 5.13.4 12.214.8 11.02.7 4.9 9.1 5.9  B. Algurén et al. / Open Journal of Preventive Medicine 1 (2011) 143-153 Copyright © 2011 SciRes. Openly accessible at http://www.scirp.org/journal/OJMP/ 151 allows people to obtain, based on fine-grained levels of assessment, feedback on their risk perception and/or health-related behavior as compared to others, thus pos- sibly supporting them in adjusting their views and life- styles. By applying the LRS to the actual behaviors of the study population, some interesting findings were ob- tained, although the present sample had a rather low average risk score and reported rather healthy lifestyles. The findings that lifestyles were healthier in female than in male participants, that participants living with a part- ner led healthier lifestyles than singles, and that younger participants engaged more often in risky lifestyles than older ones correspond well with findings reported in the literature [38-45]. Although men perceived risks more accurately, their lifestyles were more risky than those of females. Also, professionals with medical training did not show less risky behaviors than others, even though they perceived health risks as more serious. This cor- responds to the well-known fact that being aware of risks does not automatically lead to their avoidance [46]. It is clear that independent validation of the LRS should be undertaken prior to applying it without reser- vation in research or individual-level diagnostic or inter- ventional settings. Out-of-sample replication studies and possibly recalibration of the proposed scoring should be undertaken. Other than the present sampling and measure- ment procedures might provide important insights re- garding the generalizability of the scale and the reported findings. The response rate of 67 percent was reasonably high and selection bias seems to be unlikely. While there appears to be no prima facie reason to assume that the sampling procedure might have biased the results, this possibility cannot be fully excluded. Replication studies might therefore attempt to draw population-repre- sentative random samples of study participants. Also, epidemiological analyses of the predictive value of the LRS should be undertaken, either based on existing data (where available) or on data of future case-control or (preferably) prospective cohort studies. By addressing different disease-specific endpoints and settings, a fine grained purpose-specific assessment of the instrument might eventually become available. In summary, it was possible to quantify multidimen- sional health-behaviors and risk perceptions concisely with a unidimensional risk scale. The LRS, although pre- liminary at present, can be useful in epidemiologic research as well as in developing and evaluating inter- ventions, and possibly as a tool for risk communication in prevention contexts. There is ample evidence that for most diseases, effective strategies for risk communi- cation need to focus on health-related behaviors [2,4]. Scoring multidimensional health-related behavioral risks on a single dimension of subjective risk appears now feasible, but additional work is required to further va- lidate and calibrate the instrument. 5. ACKNOWLEDGEMENTS There was no funding for this project. REFERENCES [1] Weisburger, J. (1998) Worldwide prevention of cancer and other chronic diseases based on knowledge of mechanisms. Mutatution Research, 402, 331-337. doi:/10.1016/S0027-5107(97)00313-8 [2] Blanchard, C.G., Labrecque, M.S., Ruckdeschel, J.C. and Blanchard, E.B. (1988) Information and decision-making preferences of hospitalized adult cancer patients. Social Science & Medicine, 27, 1139-1145. doi:/10.1016/0277-9536(88)90343-7 [3] Barbor, T., Sciamanna, C. and Pronk, N. (2004) Assess- ing multiple risk behaviors in primary care. Screening issues and related concepts. American Journal of Preven- tive Medicine, 27, 42-53. [4] Rimm, E. and Stampfer, M. (2004) Diet, lifestyle, and longevity―The next steps? Journal of the American Me- dical Association, 292, 1490-1492. doi:/10.1001/jama.292.12.1490 [5] Battegay, E., Gasche, A., Zimmerli, L., Martina, B., Gyr, N. and Keller, U. (1997) Risk factors control and percep- tions of risk factors in patients with coronary heart dis- ease. Blood Press Supplies, 1, 17-22. [6] Cohn, L., Schydlower, M., Foley, J. and Copeland, R. (1995) Adolescents’ misinterpretation of health risk pro- bability expressions. Pediatrics, 95, 713-716. [7] Tsubono, Y., Koizumi, Y., Nakaya, N., Fujita, K., Taka- hashi, H., Hozawa, A., Suzuki, Y., Kuriyama, S., Tsuji, I., Fukao, A. and Hisamichi, S. (2004) Health practices and mortality in Japan: combined effects of smoking, drink- ing, walking and body mass index in the Miyagi Cohort Journal of Epidemiology, 14, S39-45. doi:/10.2188/jea.14.S39 [8] Mao, Y., Pan, S., Wen, S.W. and Johnson, K.C. (2003) Physical inactivity, energy intake, obesity and the risk of rectal cancer in Canada. International Journal of Cancer, 105, 831-837. doi:/10.1002/ijc.11159 [9] Kjaer, M. (2000) Physical inactivity is an underestimated risk factor for development of morbidity and mortality. Scandinavian Journal of Medicine and Science in Sports, 10, 247-248. [10] Heidrich, J., Wellmann, J., Hense, H.W., Siebert, E., Li- ese, A.D., Lowel, H. and Keil, U. (2003) Classical risk factors for myocardial infarction and total mortality in the community-13-year follow-up of the MONICA Augsburg cohort study. Z Kardiol, 92, 445-454. [11] Haveman-Nies, A., De Groot, L., Burema, J., Cruz, J., Osler, M. and van Staveren, W. (2002) Dietary quality and lifestyle factors in relation to 10-year mortality in older Europeans. The SENECA study. American Journal of Epidemiology, 156, 962-968. doi:/10.1093/aje/kwf144 [12] Emberson, J., Shaper, A., Wannemethee, S., Morris, R.  B. Algurén et al. / Open Journal of Preventive Medicine 1 (2011) 143-153 Copyright © 2011 SciRes. Openly accessible at http://www.scirp.org/journal/OJPM/ 152 and Whincup, P. (2005) Alcohol Intake in middle age and risk of cardiovascular disease and mortality: Accounting for intake variation over time. American Journal of Epi- demiology, 161, 856-863. doi:/10.1093/aje/kwi111 [13] Bercault, N., Boulain, T., Kuteifan, K., Wolf, M., Runge, I. and Fleury, J.C. (2004) Obesity-related excess mortal- ity rate in an adult intensive care unit: A risk-adjusted matched cohort study. Critical Care Medicine, 32, 998- 1003. doi:/10.1097/01.CCM.0000119422.93413.08 [14] Belloc, N. (1973) Relationship of health practices and mortality. Preventive Medicine, 2, 67-81. doi:/10.1016/0091-7435(73)90009-1 [15] Andersen, L.B. (2004) Relative risk of mortality in the physically inactive is underestimated because of real changes in exposure level during follow-up. American Journal of Epidemiology, 160, 189-195. doi:/10.1093/aje/kwh195 [16] World Health Organization. (1999) Healthy living. What is a healthy lifestyle? Copenhagen, Denmark: World Health Organization Regional Office for Europe. World Wide Web URL: http://www.euro.who.int/document/e66134.pdf [17] Meng, L., Maskarinec, G., Lee, J. and Kolonel, L. (1999) Lifestyle factors and chronic diseases: application of a composite risk index. Preventive Medicine, 29, 296-304. doi:/10.1006/pmed.1999.0538 [18] Kim, S., Popkin, B., Siega-Riz, A., Haines, P. and Arab, L. (2004) A cross-national comparison of lifestyle be- tween China and the United States, using a comprehend- sive cross-national measurement tool of the healthfulness of lifestyles: The Lifestyle Index. Preventive Medicine, 38, 160-171. doi:/10.1016/j.ypmed.2004.02.003 [19] D'Agostino, B., Grundy, S., Sullivan, L. and Wilson, P. (2001) Validation of the Framingham Coronary Heart Disease Prediction Scores. Results of a Multiple Ethnic Groups Investigation. Journal of the American Medical Association, 286, 180-187. doi:/10.1001/jama.286.2.180 [20] Aktas, M., Ozduran, V., Pothier, C., Lang, R. and Lauer, M. (2004) Global risk scores and exercise testing for predicting all-cause mortality in a preventive medicine program. Journal of the American Medical Association, 292, 1462-1468. doi:/10.1001/jama.292.12.1462 [21] Agresti, A. (1996) Chapter 9.6. Bradley-Terry model for paired preferences, Eds., An introduction to categorial data analysis, John Wiley & Sons, Inc., New York, 246- 279. [22] Klein, M. (2002) Die Conjoint-Analyse. Eine Einführung in das Verfahren mit einem Ausblick auf mögliche sozialwissenschaftliche Anwendungen. ZA-Information 50, 7-45. [23] Gediga, G. (1998) Kapitel 6. Wahlmodelle für Präferenz- DatenEds., Skalierung. Eine Einführung in die Me- tho- dik zur Entwicklung von Testund Meßinstrumenten in den Verhaltenswissenschaften, Lit Verlag, Münster, 90- 106. [24] SAS Institute. Samples: Bradley. SAS Institute, 2000. World Wide Web URL: http://ftp.sas.com/techsup/download/stat/bradley.html [25] Cronbach, L.J. (1951) Coefficient alpha and the internal structure of tests. Psychometrika, 16, 297-334. [26] Bland, M.J. and Altman, D.G. (1997) Cronbach’s alpha. British Medical Journal, 314, 572. [27] Mokdad, A., Marks, J., Stroup, D. and Gerbering, J. (2004) Actual causes of death in the United States, 2000. Journal of the American Medical Association, 291, 1238- 1245. doi:/10.1001/jama.291.10.1238 [28] Keil, U. and Kuulasmaa, K. (1989) WHO MONICA Project: risk factors. American Journal of Epidemiology, 18, S46-S55. [29] Jaatun, H.J., Sutradhar, S.C. and Dickstein, K. (2004) Comparison of mortality rates after acute myocardial in- farction in smokers versus nonsmokers. American Jour- nal of Cardiology, 94, 632-636, A9. [30] Haustein, K. (2003) Smoking and body weight—a main topic. Deutsche Medizinische Wochenschrift, 128, 2085- 2090.doi:/10.1055/s-2003-42705 [31] Wellmann, J., Heidrich, J., Berger, K., Doring, A., Heu- schmann, P.U. and Keil, U. (2004) Changes in alcohol intake and risk of coronary heart disease and all-cause mortality in the MONICA/KORA-Augsburg cohort 1987- 1997. European Journal of Cardiovascular Prevention & Rehabilitation, 11 , 48-55. doi:/10.1097/01.hjr.0000118174.70522.20 [32] San-Jose, B. (2003) Alcohol consumption and mortality: Comparison between countries and meta-analyses. Euro- pean Journal of Epidemiology, 18, 603-605. doi:/10.1023/A:1024985601188 [33] de Vegt, F., Dekker, J.M., Groeneveld, W.J., Nijpels, G., Stehouwer, C.D., Bouter, L.M. and Heine, R. J. (2002) Moderate alcohol consumption is associated with lower risk for incident diabetes and mortality: the Hoorn Study. Diabetes Research and Clinical Practice, 57, 53-60. doi:/10.1016/S0168-8227(02)00013-X [34] Youngstedt, S.D. and Kripke, D.F. (2004) Long sleep and mortality: have we been chasing the wrong tail? Sleep Medicine Reviews, 8, 175-176. doi:/10.1016/j.smrv.2004.03.001 [35] Tamakoshi, A. and Ohno, Y. (2004) Self-reported sleep duration as a predictor of all-cause mortality: Results from the JACC study, Japan. Sleep, 27, 51-54. [36] Kripke, D.F. (2003) Sleep and mortality. Psychosomatic Medicine, 65, 74. doi:/10.1097/01.PSY.0000039752.23250.69 [37] Heslop, P., Smith, G.D., Metcalfe, C., Macleod, J. and Hart, C. (2002) Sleep duration and mortality: The effect of short or long sleep duration on cardiovascular and all-cause mortality in working men and women. Sleep Medicine, 3, 305-314. doi:/10.1016/S1389-9457(02)00016-3 [38] Becker, C. and Arnold, W. (2004) Health Promoting be- haviors of older Americans versus young and middle aged adults. Educational Gerontology, 30, 835-844. doi:/10.1080/03601270490507277 [39] Burger, M. and Mensink, G. (2003) Bundes-gesund-heits- survey: Alkohol. konsumverhalten in deutschland. Bei- träge zur gesundheitsberichterstattung des bundes, Ro- bert Koch-Institut, 1-16. [40] Fransson, E., Alfredsson, L., de Faire, U., Knutsson, A. and Westerholm, P. (2003) Leisure time, occupational and household physical activity, and risk factors for car- diovascular disease in working men and women: The WOLF study. Scandinavian Journal of Public Health, 31, 324-333. doi:/10.1080/14034940210165055 [41] Freidl, W., Stronegger, W. and Neuhold, C. (2003) Le-  B. Algurén et al. / Open Journal of Preventive Medicine 1 (2011) 143-153 Copyright © 2011 SciRes. http://www.scirp.org/journal/OJMP/Openly accessible at 153 bensstile in Wien. Stadt Wien (Hrsg.), 1-320. [42] Knopf, H., Ellert, U. and Melchert, H. (1999) Sozialschi- cht und Gesundheit. Gesundheitswesen, 61, S169-S177. [43] Mensink, G. (2003) Beiträge zur Gesundheitsberichter- stattung des Bundes. Bundes-Gesundheitssurvey: Kör- perliche Aktivität. Aktive Freizeitgestaltung in Deutsch- land. Robert Koch-Institut, 1-12. [44] Sánchez-Villegas, A., Delgado-Rodríguez, M., Martínez- González, M., de Irala-Estévez, J. et al. (2003) Gender, age, socio-demographic and lifestyle factors associated with major dietary patterns in the Spanish project SUN (Seguimiento Universidad de Navarra). European Jour- nal of Clinical Nutrition, 57, 285-292. doi:/10.1038/sj.ejcn.1601528 [45] Umberson, D. (1987) Family status and health behaviors: social control as a dimension of social integration. Jour nal of Health and Social Behavior, 28, 306-319. doi:/10.2307/2136848 [46] LaPiere, R. (1934) Attitudes versus actions. Social Fo rces, 13, 230-237. doi:/10.2307/2570339
|